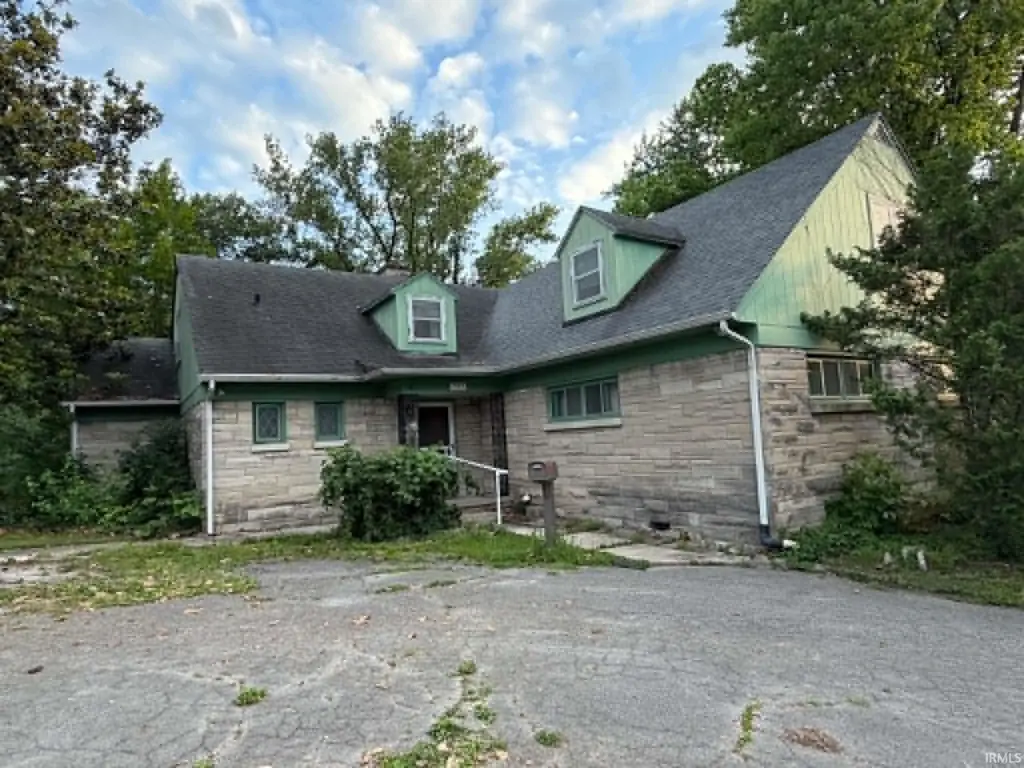
785 W Main Street St · Bloomfield, IN
Flood risk 1/10 · Minimal
- FEMA flood zone
- X (unshaded)
- Chance of flooding over 30 yrs
- 0.0%
- Est. flood insurance / yr
- $473 – $860
Fire risk 3/10 · Minor
- Est. fire insurance / yr
- $717 – $1,331
Heat risk 4/10 · Minor
- Hot days now (above 106°F)
- 7 days/yr
- Hot days in 30 yrs
- 18 days/yr
Wind risk 2/10 · Minimal
- Chance of severe wind over 30 yrs
- 1.0%
Air-quality risk 3/10 · Minor
- Unhealthy air days now
- 2 days/yr
- Unhealthy air days in 30 yrs
- 3 days/yr
Risk factors via First Street. Map © Google.
Why this score? — see what drove the D grade
The composite is a weighted blend of 9 inputs, each scored 0–100. Each bar is that input's sub-score; the figure is the points it added to the 100-point composite (weight × sub-score).
- Cash flow +13.1/30.0
- ARV discount +7.5/15.0
- DSCR +3.9/10.0
- Livability +3.7/5.0
- Appreciation +3.6/10.0
- Schools +3.2/10.0
- 1% rule +3.1/10.0
- Rent growth +2.5/5.0
- Condition / age +2.5/5.0
$199,900
🖨 Deal sheet (PDF) 📄 Offer letter ✓ Due diligence
Listing remarks
Opportunity awaits with this spacious 5-bedroom, 4 full bath, 1 half-bath home situated on approximately 0.97 acres along State Road 54 at the edge of Bloomfield. Offering over 4,000 square feet of living space, this unique property provides room to grow, entertain, work, or create the layout that best fits your needs. Inside, you'll find generously sized rooms, multiple living areas, and a rare basement shower room that adds additional functionality. The home's size and layout offer endless possibilities for a large family, multigenerational living, hobby space, home office needs, or future updates tailored to your vision. Outside, the nearly one-acre lot provides a park-like setting with
Key facts
- Basement shower room
- Nearly one-acre lot
- Mature trees
Tags
Property features AI
Exterior
- Parking: Attached 2-car garage
- Utilities: Public water; Public sewer
- Home design: Single-family site-built home; 2 stories
- Construction: Has basement
- Exterior features: Level to rolling slope lot; Irregular lot dimensions; Approximately 0.97-acre lot
Interior
- Kitchen: Electric oven; Electric range
- Flooring: Hardwood floors; Carpeted areas
- Bathrooms: 4 full bathrooms; 2 half bathrooms; 3 main-level bathrooms
- Heating & cooling: Natural gas heating; No central cooling
- Interior features: Living room fireplace; Unfinished walk-out basement; 5 total rooms
- Laundry & utility: Main-level laundry
Neighborhood map
What this means for you Summary
Snapshot
- This is a 5-bed/4.0-bath single-family listed at $200k.
Deal economics
- At list price, monthly cash flow is $-6 ($-72/yr) — negative.
- To cash-flow at today's rent, offer at most $199k (0.5% below list).
- To meet the 1% rule (rent ≥ 1% of price), the offer needs to be $163k (18.6% below list).
- Recommended offer: $163k (18.6% below list) — sets the bar for 1% rule.
Location & tenants
- Location reads 73/100 on livability (#96 in IN) — a middle-class / working-renter tenant base. Strengths: crime A+, cost of living A+, housing A+; Watch: amenities F, commute F.
- Bloomfield School District (town): math 33% / reading 41% proficiency, ranked #169 of 301 in IN (top 56%) — families likely to look elsewhere, expect single-tenant / working-renter base with shorter leases.
- Zoned schools: Bloomfield Elementary School (math 30% / reading 34%, grade F, #652 of 994 statewide, top 68%, 457 students, 51% FRL); Bloomfield Middle School (168 students, 51% FRL); Bloomfield High School (math 37% / reading 52%, grade F, #169 of 369 statewide, top 51%, 233 students, 40% FRL) — zoned schools average 47% FRL vs 32% district-wide (15 pts higher); higher-poverty schools than district average — tighter screening recommended.
- Market conditions: 55 active listings in the ZIP.
Forward outlook
- Local home prices are declining (-2.8%/yr); year-one equity from $1k of loan paydown is wiped out by about $6k of value loss. Plan a longer hold.
- Greene County population projected at -22% by 2050 — secular population decline; favor cash flow + early exit over multi-decade hold.
Negotiation context
- It's been on market 17 days — a 2% lower offer ($197k) is reasonable based on typical stale-listing flexibility.
Risks & watch-outs
- Watch-outs: built in 1933 — expect roof / HVAC / electrical / plumbing capex.
Questions for the listing agent
- What do current leases actually rent for vs. the listed asking? Can we see a recent rent roll and the last 12 months of T-12 income?
- Built in 1933 — when were the roof, HVAC, electrical panel, plumbing, and water heater last replaced?
- Is there a deadline driving the sale (1031 exchange, divorce, estate, relocation)? That informs how much negotiation room exists.
- Schools are D-rated, which usually means shorter tenancies and higher turnover. Who's the typical renter profile here, and what's been the actual vacancy rate?
- The area grade is low — what's the realistic commute time and amenity access for the typical tenant pool here? Any planned neighborhood developments (good or bad) we should know about?
- What's the average days-on-market for RENTAL listings here right now (not sales)? A rising rental-DOM trend means longer vacancies and softer asking-rent achievability than the comps imply.
- What's the recent tenant-quality profile in this submarket — average credit score on applications, eviction rate, late-payment / NSF rate, and stable-employment percentage? A property-management company in the area should have these aggregated.
- How much new for-sale + rental construction is in the pipeline within 1–3 miles? Heavy new supply typically softens prices + rents 12–24 months out; constrained supply supports both.
Investment metrics
- 1% rule
- 0.81% ✗
- Cap rate
- 6.26%
- Cash-on-cash
- -0.13%
- DSCR
- 0.99
- GRM
- 10.2
CMA / ARV
No comps found within radius.
Projected returns pro-forma
-2.84% appreciation · 3.0% rent growth · sell at horizon
- IRR
- -15.6%
- Equity multiple
- 0.44×
- Total profit
- $-31,463
- Equity at exit
- $31,235
- IRR
- -7.3%
- Equity multiple
- 0.52×
- Total profit
- $-26,868
- Equity at exit
- $19,749
Cash invested: $55,972 (down + closing). Projections, not guarantees.
Landlord ↔ Tenant lean methodology
- Overall (STATE)
- 90 Strongly Landlord-Friendly
- State Indiana
- 90 Strongly Landlord-Friendly · R+11
- County
- — inherits STATE
- City
- — inherits STATE
ZIP-level market 47424
- Home prices YoY
- -1.3%
- Active inventory
- 55
- Price-to-rent
- 10.2×
Monthly cashflow live
- Estimated rent
- $1,627 medium interval (Pro) →
- Mortgage (P&I)
- −$1,048
- Tax from tax record
- −$160 /mo · $1,918/yr
- Insurance
- −$83
- HOA
- −$0
- Vacancy / Maint / Mgmt
- −$342
- Net cashflow
- $-6
Break-even live
Sensitivity live
| Price | -10% $107 | -5% $51 | +0% $-6 | +5% $-63 | +10% $-119 |
|---|---|---|---|---|---|
| Rent | -10% $-135 | -5% $-70 | +0% $-6 | +5% $58 | +10% $123 |
| Rate | -1.0pp $95 | -0.5pp $45 | base $-6 | +0.5pp $-58 | +1.0pp $-111 |
UW: 25.0% down · 7.5% · 30yr · 1.5% tax · 5.0% vac · 8.0% maint · 8.0% mgmt
Financing live
Cash to close
- Down payment
- $49,975
- Closing costs
- $5,997
- Reserves months
- —
- Total cash needed
- —
Loan-product check · same deal, 3 products live
Conventional
25% down · 7.5% · 30yr
- Down + closing
- —
- Monthly P&I
- —
- Monthly cashflow
- —
- DSCR
- —
- Eligible?
- —
Personal DTI + credit; lowest rate.
DSCR
20% down · 8.5% · 30yr
- Down + closing
- —
- Monthly P&I
- —
- Monthly cashflow
- —
- DSCR
- —
- Eligible?
- —
No personal income docs; deal must DSCR.
Hard money
10% down · 12.0% · 12mo
- Down + closing
- —
- Monthly P&I
- —
- Monthly cashflow
- —
- DSCR
- —
- Eligible?
- —
Short-term bridge; refi at stabilization.
Listing history 14 events
-
2026-06-22days on market $199,900 Active 17 DOM
-
2026-06-21days on market $199,900 Active 16 DOM
-
2026-06-21days on market $199,900 Active 15 DOM
-
2026-06-18days on market $199,900 Active 13 DOM
-
2026-06-17days on market $199,900 Active 12 DOM
-
2026-06-16days on market $199,900 Active 11 DOM
-
2026-06-15days on market $199,900 Active 10 DOM
-
2026-06-13days on market $199,900 Active 8 DOM
-
2026-06-12days on market $199,900 Active 7 DOM
-
2026-06-09days on market $199,900 Active 4 DOM
-
2026-06-08days on market $199,900 Active 3 DOM
-
2026-06-07days on market $199,900 Active 2 DOM
-
2026-06-07remarks 699-char remark
-
2026-06-07$199,900 Active 1 DOM
ⓘ Source: listings_history table (triggers on properties + properties_extension) + one-shot
backfill from property_details.listing_events for pre-trigger history.
Tax reassessment forecast IN · Partial reset (capped growth)
- Current annual tax
- $1,918 · $160/mo
- Projected year-2 tax
- $1,918 · $160/mo
- Expected delta
- $0/yr ($0/mo · 0.0%)
ⓘ Screening estimate from a state-policy table — verify with the county assessor before closing.
Climate risk First Street
- Flood 1/10 Low FEMA zone X (unshaded) · 0% chance over 30 yrs
- Wildfire 3/10 Moderate
- Heat 4/10 Moderate 7 d/yr ≥106°F today · 18 d/yr by 30 yrs out
- Wind 2/10 Low 100% chance of damaging wind over 30 yrs
- Air quality 3/10 Moderate 2 unhealthy d/yr today · 3 by 30 yrs out
Nearby sold comps map
Loading sold comps map…
Walkable amenities ~0.75 mi
Loading nearby amenities…
Taxation est. · year 1
- Rental income
- $19,525
- − Mortgage interest
- −$11,198
- − Property taxes
- −$1,918
- − Insurance
- −$1,000
- − Repairs & maintenance
- −$1,562
- − Management
- −$1,562
- − Depreciation
- −$5,815
- Taxable loss
- −$3,529
- Est. tax savings @ 24.0%
- +$847
- After-tax cash flow
- $775/yr
For passive investors: Depreciation is non-cash, so a rental often shows a tax loss while cash-flowing — sheltering income. Rental losses are passive: they offset passive income freely, and up to $25,000/yr can offset ordinary (W-2) income if you actively participate and your MAGI is under $100k (phasing out to $0 by $150k); unused losses carry forward. On sale, claimed depreciation is recaptured at up to 25%, and gains may owe capital-gains tax (a 1031 exchange can defer both). Figures are a year-1 estimate at your 24.0% rate — not tax advice; consult a CPA.
Schools (NCES district)
- District
- Bloomfield School District
- NCES district ID
- 1800600
- Math proficiency
- 33% ▼ -11.00%
- Reading proficiency
- 41% ▼ -4.00%
- Median HH income
- $50,351
- Composite
- 32.01/100
- National rank
- #5828
- State rank
- #169 of 301 in IN
Livability — Bloomfield
- Score
- 73/100
- State rank
- #96
- US rank
- #5394
Category grades
Schools grade is shown separately in the Schools card above.
Census & demographics
- Census place
- Bloomfield, IN
- Population (ZIP)
- 8,620
Population outlook (Greene County) Hauer SSP2
- Today (2025)
- 30,724 people
- By 2030
- 29,506 · -4.0%
- By 2040
- 26,744 · -13.0%
- By 2050
- 23,879 · -22.3%
- By 2075
- 18,341 · -40.3%
- By 2100
- 13,976 · -54.5%
Race, ethnicity, and origin ACS 2023
- Neighborhood character
- Predominantly White (96%)
- Race & ethnicity
- White 96% Two or more races 2%
- Common ancestry
- Italian 2% Iranian 2% Slovak 2%
- Foreign-born
- 0%
Political lean MEDSL · Greene
- 2024 margin
- Solid R (+53.7) · D 22.4% · R 76.1% · Other 1.6%
- 2008→2024 swing
- -39.2pp toward R · 2008: -14.5pp · 2024: -53.7pp
- All cycles
- 2024: R+53.7 2020: R+52.2 2016: R+53.4 2012: R+31.4 2008: R+14.5
Not yet ingested
- Civics
- —
Market trends
- HPI YoY
- ▼ -2.84%
- Current HPI
- 208.554
- Rent YoY
- —
- Metro
- —
- State GDP YoY
- ▲ 2.90%
- F500 in state
- 18
Industry mix (Fortune 500 HQ in IN)
| Industry | F500 HQs | Revenue |
|---|---|---|
| Industrial Machinery | 2 | $37B |
|
||
| Healthcare | 1 | $177B |
|
||
| Pharmaceuticals | 1 | $45B |
|
||
| Metals / Steel | 1 | $18B |
|
||
| Agriculture | 1 | $17B |
|
||
| Packaging | 1 | $12B |
|
||
Price history
1 event — show timeline
- 2026-06-05 Listed $199,900 IRMLS
Property tax history
+2.3%/yrLatest (2025): $1,918 · +11.6% YoY. Source: county tax records.
Cash-flow waterfall
monthlySold comps — $/sqft
last 12 mo · ≤1 miLoading sold comps…