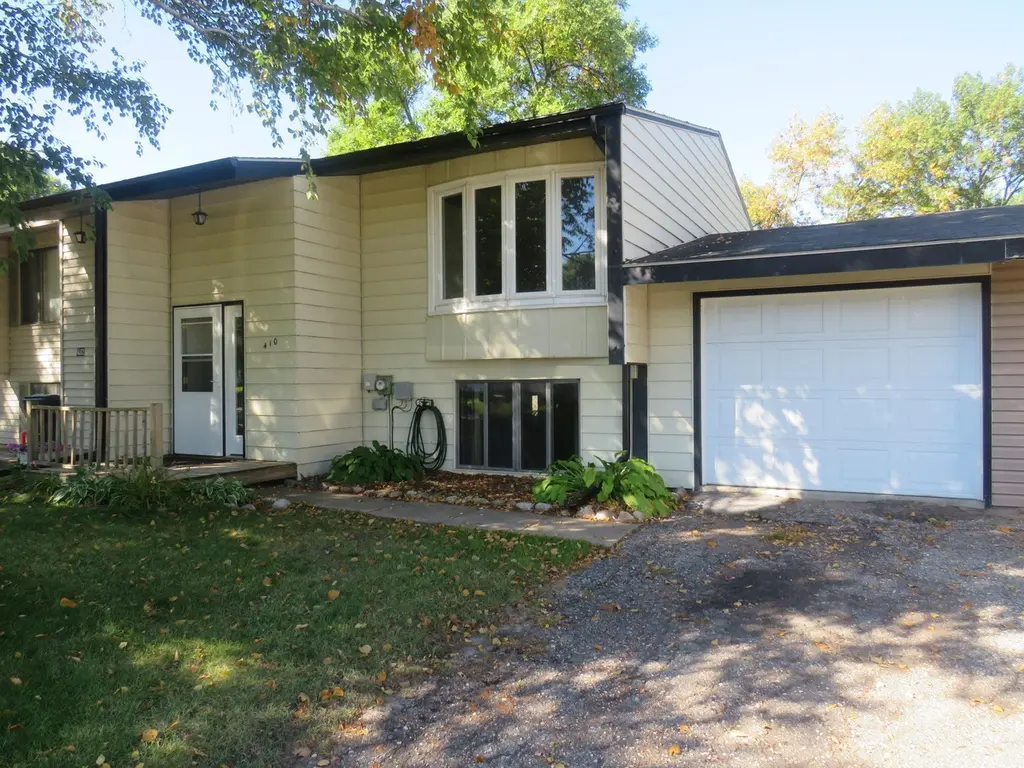
410 S 19th St · Benson, MN
Flood risk 1/10 · Minimal
- FEMA flood zone
- X (unshaded)
- Chance of flooding over 30 yrs
- 0.0%
- Est. flood insurance / yr
- $473 – $860
Fire risk 3/10 · Minor
- Est. fire insurance / yr
- $888 – $1,650
Heat risk 2/10 · Minimal
- Hot days now (above 99°F)
- 7 days/yr
- Hot days in 30 yrs
- 13 days/yr
Wind risk 2/10 · Minimal
- Chance of severe wind over 30 yrs
- —
Air-quality risk 2/10 · Minimal
- Unhealthy air days now
- 2 days/yr
- Unhealthy air days in 30 yrs
- 2 days/yr
Risk factors via First Street. Map © Google.
Why this score? — see what drove the C grade
The composite is a weighted blend of 9 inputs, each scored 0–100. Each bar is that input's sub-score; the figure is the points it added to the 100-point composite (weight × sub-score).
- Cash flow +22.7/30.0
- ARV discount +7.5/15.0
- DSCR +7.3/10.0
- 1% rule +5.9/10.0
- Livability +3.8/5.0
- Schools +3.4/10.0
- Rent growth +2.5/5.0
- Condition / age +2.5/5.0
- Appreciation +0.0/10.0
$105,900
🖨 Deal sheet (PDF) 📄 Offer letter ✓ Due diligence
Listing remarks MLS
Efficient Townhome With Many Recent Upgrades to the Flooring, HVAC and some appliances. Appliances Included. Front and Back Decks. 1 1/2 Baths With One on Each Level. Ready For Quick Close! Seller is Agent
Key facts
- Hvac
- Appliances included
- Front and back decks
Tags
Neighborhood map
What this means for you Summary
Snapshot
- This is a 3-bed/2.0-bath single-family listed at $106k.
Deal economics
- At list price, monthly cash flow is $181 ($2k/yr) — positive.
- The deal already cash-flows at list — no discount required.
- Meets the 1% rule at list price ($1k rent vs $106k).
- Recommended offer: $93k (12.0% below list) — sets the bar for market timing.
- Cap rate 8.3% vs local median 5.8% in Benson — top-decile yield for the area; either an underpriced asset or a hidden risk that comps aren't pricing in. Stress-test before assuming the spread holds.
Location & tenants
- Location reads 75/100 on livability (#189 in MN, #4,068 nationally) — a middle-class / working-renter tenant base. Strengths: crime A+, cost of living A+, housing A+; Watch: employment C-, amenities F, commute F.
- Benson Public School District (town): math 37% / reading 41% proficiency, ranked #228 of 301 in MN (top 76%) — families likely to look elsewhere, expect single-tenant / working-renter base with shorter leases.
- Market conditions: 32 active listings in the ZIP; 3 comparable units currently listed for rent nearby; rentals lingering (median 45d on market — plan ~5-8 weeks vacancy on turnover, expect pricing pressure); 100% of comp listings sitting > 30 days — soft ceiling on asking rent; 15 units permitted in Swift County in 2024 (0 in 5+ unit buildings).
Forward outlook
- Local home prices are declining (-3.0%/yr); year-one equity from $732 of loan paydown is wiped out by about $3k of value loss. Plan a longer hold.
- Swift County population projected at -20% by 2050 — secular population decline; favor cash flow + early exit over multi-decade hold.
Negotiation context
- It's been on market 232 days — a 12% lower offer ($93k) is reasonable based on typical stale-listing flexibility.
- 5 sale attempts since 14y ago; this cycle's ask has dropped $14k (12%) from the opening price — seller is motivated, your offer sets the floor, not the list.
- Current owner paid $30k; list at $106k implies a 253% gain — meaningful room to come down on a strong offer.
Questions for the listing agent
- It's been on market 232 days. Have you received any prior offers? Is the seller open to a 12% concession, seller financing, or rate buy-down credit?
- Built in 1973 — when were the roof, HVAC, electrical panel, plumbing, and water heater last replaced?
- Why hasn't it sold? Are there any deal-killer items the seller is aware of (foundation, flood, title, zoning, code violations)?
- Is there a deadline driving the sale (1031 exchange, divorce, estate, relocation)? That informs how much negotiation room exists.
- What's the average days-on-market for RENTAL listings here right now (not sales)? A rising rental-DOM trend means longer vacancies and softer asking-rent achievability than the comps imply.
- What's the recent tenant-quality profile in this submarket — average credit score on applications, eviction rate, late-payment / NSF rate, and stable-employment percentage? A property-management company in the area should have these aggregated.
- How much new for-sale + rental construction is in the pipeline within 1–3 miles? Heavy new supply typically softens prices + rents 12–24 months out; constrained supply supports both.
Investment metrics
- 1% rule
- 1.09% ✓
- Cap rate
- 8.35%
- Cash-on-cash
- 7.33%
- DSCR
- 1.33
- GRM
- 7.6
CMA / ARV
- ARV (median comp)
- $252,934
- List price
- $105,900
- Delta
- -58.13%
- Verdict
- UNDERPRICED
- Comps
- 1 within 2.0 mi
Projected returns pro-forma
-3.0% appreciation · 3.0% rent growth · sell at horizon
- IRR
- -5.1%
- Equity multiple
- 0.81×
- Total profit
- $-5,599
- Equity at exit
- $15,790
- IRR
- 4.6%
- Equity multiple
- 1.34×
- Total profit
- $10,061
- Equity at exit
- $9,156
Cash invested: $29,652 (down + closing). Projections, not guarantees.
Landlord ↔ Tenant lean methodology
- Overall (STATE)
- 46 Balanced
- State Minnesota
- 46 Balanced · D+2
- County
- — inherits STATE
- City
- — inherits STATE
ZIP-level market 56215
- Home prices YoY
- -18.0%
- Active inventory
- 32
- Price-to-rent
- 7.6×
Monthly cashflow live
- Estimated rent
- $1,156 medium interval (Pro) →
- Mortgage (P&I)
- −$555
- Tax from tax record
- −$133 /mo · $1,594/yr
- Insurance
- −$44
- HOA
- −$0
- Vacancy / Maint / Mgmt
- −$243
- Net cashflow
- $181
Break-even live
Sensitivity live
| Price | -10% $241 | -5% $211 | +0% $181 | +5% $151 | +10% $121 |
|---|---|---|---|---|---|
| Rent | -10% $90 | -5% $136 | +0% $181 | +5% $227 | +10% $273 |
| Rate | -1.0pp $235 | -0.5pp $208 | base $181 | +0.5pp $154 | +1.0pp $126 |
UW: 25.0% down · 7.5% · 30yr · 1.5% tax · 5.0% vac · 8.0% maint · 8.0% mgmt
Financing live
Cash to close
- Down payment
- $26,475
- Closing costs
- $3,177
- Reserves months
- —
- Total cash needed
- —
Loan-product check · same deal, 3 products live
Conventional
25% down · 7.5% · 30yr
- Down + closing
- —
- Monthly P&I
- —
- Monthly cashflow
- —
- DSCR
- —
- Eligible?
- —
Personal DTI + credit; lowest rate.
DSCR
20% down · 8.5% · 30yr
- Down + closing
- —
- Monthly P&I
- —
- Monthly cashflow
- —
- DSCR
- —
- Eligible?
- —
No personal income docs; deal must DSCR.
Hard money
10% down · 12.0% · 12mo
- Down + closing
- —
- Monthly P&I
- —
- Monthly cashflow
- —
- DSCR
- —
- Eligible?
- —
Short-term bridge; refi at stabilization.
Rent comps 3 comps
| Address | Beds | Baths | Sqft | Rent | $/sqft | DOM | Units | Dist |
|---|---|---|---|---|---|---|---|---|
| 1009 13th St N Benson, MN | 2.0 | 1.5 | 964 | $1,090 | $1.13 | 44d | 1 | 0.94mi |
| 1027 13th St N Benson, MN | 3.0 | 1.5 | 964 | $1,240 | $1.29 | 44d | 1 | 0.95mi |
| 1017 13th St N Benson, MN | 2.0 | 1.5 | 964 | $1,140 | $1.18 | 44d | 1 | 0.96mi |
Listing history 16 events
-
2026-04-11price $105,900 208-char remark
Show marketing remark (208 chars)
Efficient Townhome With Many Recent Upgrades to the Flooring, HVAC and some appliances. Appliances Included. Front and Back Decks. 1 1/2 Baths With One on Each Level. Ready For Quick Close! Seller is Agent
-
2026-02-07price $110,900 208-char remark
Show marketing remark (208 chars)
Efficient Townhome With Many Recent Upgrades to the Flooring, HVAC and some appliances. Appliances Included. Front and Back Decks. 1 1/2 Baths With One on Each Level. Ready For Quick Close! Seller is Agent
-
2026-01-08price $112,900 208-char remark
Show marketing remark (208 chars)
Efficient Townhome With Many Recent Upgrades to the Flooring, HVAC and some appliances. Appliances Included. Front and Back Decks. 1 1/2 Baths With One on Each Level. Ready For Quick Close! Seller is Agent
-
2025-12-17price $115,900 208-char remark
Show marketing remark (208 chars)
Efficient Townhome With Many Recent Upgrades to the Flooring, HVAC and some appliances. Appliances Included. Front and Back Decks. 1 1/2 Baths With One on Each Level. Ready For Quick Close! Seller is Agent
-
2025-11-08price $116,900 208-char remark
Show marketing remark (208 chars)
Efficient Townhome With Many Recent Upgrades to the Flooring, HVAC and some appliances. Appliances Included. Front and Back Decks. 1 1/2 Baths With One on Each Level. Ready For Quick Close! Seller is Agent
-
2025-10-16status Active 208-char remark
Show marketing remark (208 chars)
Efficient Townhome With Many Recent Upgrades to the Flooring, HVAC and some appliances. Appliances Included. Front and Back Decks. 1 1/2 Baths With One on Each Level. Ready For Quick Close! Seller is Agent
-
2025-09-23status Pending 208-char remark
Show marketing remark (208 chars)
Efficient Townhome With Many Recent Upgrades to the Flooring, HVAC and some appliances. Appliances Included. Front and Back Decks. 1 1/2 Baths With One on Each Level. Ready For Quick Close! Seller is Agent
-
2025-09-15$119,900 Active 208-char remark
Show marketing remark (208 chars)
Efficient Townhome With Many Recent Upgrades to the Flooring, HVAC and some appliances. Appliances Included. Front and Back Decks. 1 1/2 Baths With One on Each Level. Ready For Quick Close! Seller is Agent
-
2019-02-02historical 100-char remark
Show marketing remark (100 chars)
Efficient Townhome in Need if Some TLC. Vinyl Siding, Deck, Central AC. An Economical Home or Rental
-
2019-02-02historical
Show marketing remark (100 chars)
Efficient Townhome in Need if Some TLC. Vinyl Siding, Deck, Central AC. An Economical Home or Rental
-
2015-09-14soldstatus $30,000 100-char remark
Show marketing remark (100 chars)
Efficient Townhome in Need if Some TLC. Vinyl Siding, Deck, Central AC. An Economical Home or Rental
-
2015-09-08soldstatus $30,000
-
2015-01-27price $38,000
-
2014-08-15$34,000 100-char remark
Show marketing remark (100 chars)
Efficient Townhome in Need if Some TLC. Vinyl Siding, Deck, Central AC. An Economical Home or Rental
-
2012-02-08$50,100
-
2012-02-08$50,100
ⓘ Source: listings_history table (triggers on properties + properties_extension) + one-shot
backfill from property_details.listing_events for pre-trigger history.
Tax reassessment forecast MN · Partial reset (capped growth)
- Current annual tax
- $1,594 · $133/mo
- Projected year-2 tax
- $1,594 · $133/mo
- Expected delta
- $0/yr ($0/mo · 0.0%)
ⓘ Screening estimate from a state-policy table — verify with the county assessor before closing.
Climate risk First Street
- Flood 1/10 Low FEMA zone X (unshaded) · 0% chance over 30 yrs
- Wildfire 3/10 Moderate
- Heat 2/10 Low 7 d/yr ≥99°F today · 13 d/yr by 30 yrs out
- Wind 2/10 Low
- Air quality 2/10 Low 2 unhealthy d/yr today · 2 by 30 yrs out
Nearby sold comps map
Loading sold comps map…
Walkable amenities ~0.75 mi
Loading nearby amenities…
Taxation est. · year 1
- Rental income
- $13,877
- − Mortgage interest
- −$5,932
- − Property taxes
- −$1,594
- − Insurance
- −$530
- − Repairs & maintenance
- −$1,110
- − Management
- −$1,110
- − Depreciation
- −$3,081
- Taxable income
- $520
- Est. tax owed @ 24.0%
- −$125
- After-tax cash flow
- $2,050/yr
For passive investors: Depreciation is non-cash, so a rental often shows a tax loss while cash-flowing — sheltering income. Rental losses are passive: they offset passive income freely, and up to $25,000/yr can offset ordinary (W-2) income if you actively participate and your MAGI is under $100k (phasing out to $0 by $150k); unused losses carry forward. On sale, claimed depreciation is recaptured at up to 25%, and gains may owe capital-gains tax (a 1031 exchange can defer both). Figures are a year-1 estimate at your 24.0% rate — not tax advice; consult a CPA.
Schools (NCES district)
- District
- Benson Public School District
- NCES district ID
- 2704470
- Math proficiency
- 37% ▼ -13.00%
- Reading proficiency
- 41% ▼ -9.00%
- Median HH income
- $49,024
- Composite
- 33.56/100
- National rank
- #5423
- State rank
- #228 of 301 in MN
Livability — Benson
- Score
- 75/100
- State rank
- #189
- US rank
- #4068
Category grades
Schools grade is shown separately in the Schools card above.
Census & demographics
- Census place
- Benson, MN
- Population (ZIP)
- 4,701
Population outlook (Swift County) Hauer SSP2
- Today (2025)
- 8,635 people
- By 2030
- 8,257 · -4.4%
- By 2040
- 7,528 · -12.8%
- By 2050
- 6,891 · -20.2%
- By 2075
- 5,879 · -31.9%
- By 2100
- 5,045 · -41.6%
Race, ethnicity, and origin ACS 2023
- Neighborhood character
- Predominantly White (88%)
- Race & ethnicity
- White 88% Hispanic / Latino 6% Two or more races 6% Black 1%
- Hispanic origin (detail)
- Mexican 3%
- Common ancestry
- Portuguese 28% Italian 3% Romanian 3%
- Foreign-born
- 1% · Canada
- Languages at home
- 97% English-only · Spanish 2%
Political lean MEDSL · Swift
- 2024 margin
- Solid R (+34.2) · D 32.1% · R 66.3% · Other 1.6%
- 2008→2024 swing
- -47.9pp toward R · 2008: 13.8pp · 2024: -34.2pp
- All cycles
- 2024: R+34.2 2020: R+29.5 2016: R+25.8 2012: D+9.9 2008: D+13.8
Not yet ingested
- Civics
- —
Market trends
- HPI YoY
- ▼ -47.08%
- Current HPI
- 214.9157
- Rent YoY
- —
- Metro
- —
- State GDP YoY
- ▲ 2.41%
- F500 in state
- 34
Industry mix (Fortune 500 HQ in MN)
| Industry | F500 HQs | Revenue |
|---|---|---|
| Healthcare | 2 | $407B |
|
||
| Retail | 2 | $150B |
|
||
| Consumer Goods | 2 | $32B |
|
||
| Industrial Machinery | 2 | $6B |
|
||
| Agriculture | 1 | $40B |
|
||
| Healthcare / Medical Devices | 1 | $32B |
|
||
Price history
+111.4% since first listed16 events — show timeline
- 2026-04-11 Price Changed $105,900 NORTHSTARMLS as Distributed by MLS Grid
- 2026-02-07 Price Changed $110,900 NORTHSTARMLS as Distributed by MLS Grid
- 2026-01-08 Price Changed $112,900 NORTHSTARMLS as Distributed by MLS Grid
- 2025-12-17 Price Changed $115,900 NORTHSTARMLS as Distributed by MLS Grid
- 2025-11-08 Price Changed $116,900 NORTHSTARMLS as Distributed by MLS Grid
- 2025-10-16 Relisted — NORTHSTARMLS as Distributed by MLS Grid
- 2025-09-23 Pending — NORTHSTARMLS as Distributed by MLS Grid
- 2025-09-15 Listed $119,900 NORTHSTARMLS as Distributed by MLS Grid
- 2019-02-02 Listing Removed — NORTHSTARMLS as Distributed by MLS Grid
- 2019-02-02 Listing Removed — NORTHSTARMLS as Distributed by MLS Grid
- 2015-09-14 Sold (MLS) $30,000 NORTHSTARMLS as Distributed by MLS Grid
- 2015-09-08 Sold (Public Records) $30,000 Public Records
- 2015-01-27 Price Changed $38,000 NORTHSTARMLS as Distributed by MLS Grid
- 2014-08-15 Listed $34,000 NORTHSTARMLS as Distributed by MLS Grid
- 2012-02-08 Listed $50,100 NORTHSTARMLS as Distributed by MLS Grid
- 2012-02-08 Listed $50,100 NORTHSTARMLS as Distributed by MLS Grid
Property tax history
+5.2%/yrLatest (2025): $1,594 · +33.7% YoY. Source: county tax records.
Cash-flow waterfall
monthlySold comps — $/sqft
last 12 mo · ≤1 miLoading sold comps…