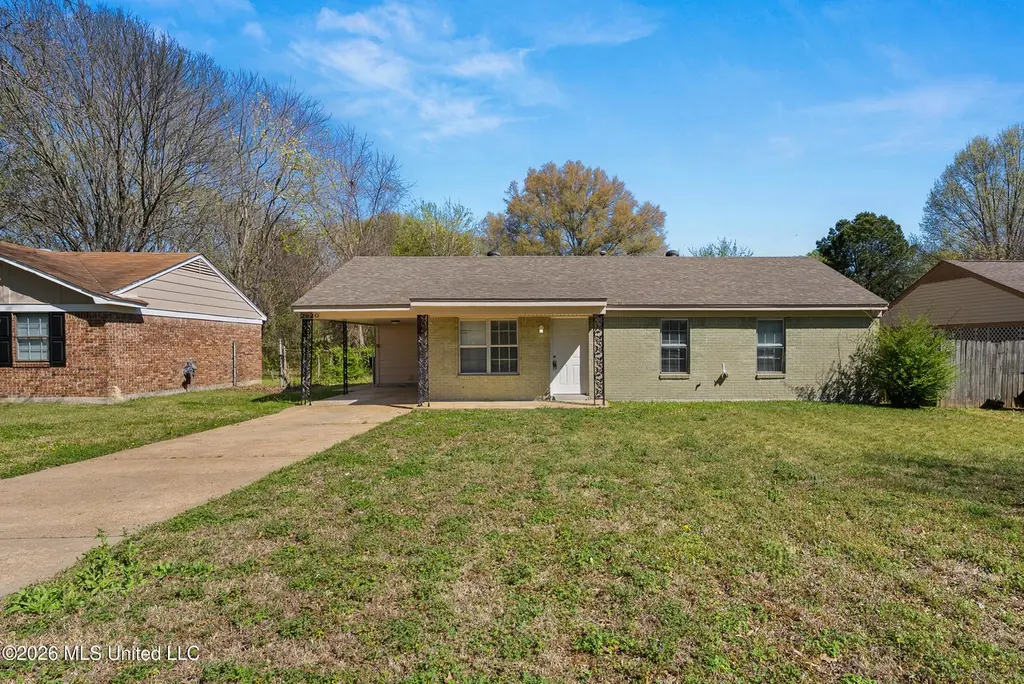
2920 Devon Cir · Horn Lake, MS
Flood risk 1/10 · Minimal
- FEMA flood zone
- X (unshaded)
- Chance of flooding over 30 yrs
- 0.0%
- Est. flood insurance / yr
- $507 – $1,088
Fire risk 4/10 · Minor
- Est. fire insurance / yr
- $1,241 – $2,305
Heat risk 6/10 · Moderate
- Hot days now (above 109°F)
- 7 days/yr
- Hot days in 30 yrs
- 21 days/yr
Wind risk 4/10 · Minor
- Chance of severe wind over 30 yrs
- 19.0%
Air-quality risk 2/10 · Minimal
- Unhealthy air days now
- 2 days/yr
- Unhealthy air days in 30 yrs
- 2 days/yr
Risk factors via First Street. Map © Google.
Why this score? — see what drove the D+ grade
The composite is a weighted blend of 9 inputs, each scored 0–100. Each bar is that input's sub-score; the figure is the points it added to the 100-point composite (weight × sub-score).
- Cash flow +17.7/30.0
- ARV discount +10.2/15.0
- DSCR +5.5/10.0
- 1% rule +4.2/10.0
- Schools +4.0/10.0
- Livability +3.1/5.0
- Condition / age +2.5/5.0
- Rent growth +2.3/5.0
- Appreciation +0.0/10.0
$164,900
🖨 Deal sheet 📄 Offer letter ✓ Due diligence
Listing remarks MLS
Spacious single-story home featuring 4 bedrooms, 1.5 bath with a functional and inviting layout. The main living areas offer comfortable space for both everyday living and entertaining, while the kitchen provides ample cabinet and counter space and flows into the dining and living areas. The primary bedroom includes an en-suite bathroom and generous closet space. Additional bedrooms offer flexibility for guests, office, or hobbies. Enjoy the backyard with space to relax or entertain. Great opportunity with plenty of potential! One or more photo(s) was virtually staged.
Key facts
- 7,840 sq ft lot
- Parking
- Built 2000
Neighborhood map
What this means for you Summary
Snapshot
- This is a 3-bed/1.5-bath single-family listed at $165k.
Deal economics
- At list price, monthly cash flow is $131 ($2k/yr) — positive.
- The deal already cash-flows at list — no discount required.
- To meet the 1% rule (rent ≥ 1% of price), the offer needs to be $151k (8.5% below list).
- Recommended offer: $151k (8.5% below list) — sets the bar for 1% rule.
- Cap rate 7.2% vs local median 6.0% in Horn Lake — meaningfully above typical; check what's discounted (condition, days-on-market, listing class) to confirm the premium yield is real.
Location & tenants
- Location reads 61/100 on livability (#196 in MS) — a middle-class / working-renter tenant base. Strengths: cost of living A+, housing A+, crime A; Watch: employment D, schools F, amenities F.
- Desoto County School District (suburban): math 48% / reading 42% proficiency, ranked #20 of 130 in MS (top 15%) — families likely to look elsewhere, expect single-tenant / working-renter base with shorter leases.
- Market conditions: Rents soft (-0.7%/yr); 95 active listings in the ZIP; 40 comparable units currently listed for rent nearby; rentals at typical pace (median 21d on market — plan ~3-4 weeks tenant-placement turnaround); 1,155 units permitted in DeSoto County in 2024 (0 in 5+ unit buildings).
- This rent runs 34% of the median local income ($53k/yr) — at the standard rent-burdened threshold; future hikes will face affordability resistance.
Forward outlook
- Local home prices are declining (-3.0%/yr); year-one equity from $1k of loan paydown is wiped out by about $5k of value loss. Plan a longer hold.
- DeSoto County population projected at +33% by 2050 — long-run rental-demand tailwind backs the buy-and-hold thesis.
Negotiation context
- It's been on market 80 days — a 6% lower offer ($155k) is reasonable based on typical stale-listing flexibility.
- 5 sale attempts since 11y ago with the ask held roughly flat each time — persistent listings suggest the price (not the market) is what's stuck; bring a comps-based counter.
Risks & watch-outs
- Climate carrying-cost: extreme-heat days projected 7→21/yr by 2055 (HVAC capex compounding) — expect insurance premiums to compound above CPI over the hold.
Questions for the listing agent
- It's been on market 80 days. Have you received any prior offers? Is the seller open to a 8% concession, seller financing, or rate buy-down credit?
- Why hasn't it sold? Are there any deal-killer items the seller is aware of (foundation, flood, title, zoning, code violations)?
- Is there a deadline driving the sale (1031 exchange, divorce, estate, relocation)? That informs how much negotiation room exists.
- Schools are F-rated, which usually means shorter tenancies and higher turnover. Who's the typical renter profile here, and what's been the actual vacancy rate?
- The area grade is low — what's the realistic commute time and amenity access for the typical tenant pool here? Any planned neighborhood developments (good or bad) we should know about?
- What's the average days-on-market for RENTAL listings here right now (not sales)? A rising rental-DOM trend means longer vacancies and softer asking-rent achievability than the comps imply.
- What's the recent tenant-quality profile in this submarket — average credit score on applications, eviction rate, late-payment / NSF rate, and stable-employment percentage? A property-management company in the area should have these aggregated.
- How much new for-sale + rental construction is in the pipeline within 1–3 miles? Heavy new supply typically softens prices + rents 12–24 months out; constrained supply supports both.
Investment metrics
- 1% rule
- 0.92% ✗
- Cap rate
- 7.25%
- Cash-on-cash
- 3.41%
- DSCR
- 1.15
- GRM
- 9.1
CMA / ARV
- ARV (median comp)
- $175,254
- List price
- $164,900
- Delta
- -5.91%
- Verdict
- FAIR
- Comps
- 20 within 1.0 mi
Show comp detail 12 sales within ~0.75 mi
| Address | Dist | Beds/Ba | Sqft | Sold | Price | $/sf | Match |
|---|---|---|---|---|---|---|---|
| 6160 Lynnfield Rd | 0.29mi | 3/1.5 | 1,183 (+1%) | 2mo | $190,000 | $161 | 84 |
| 3140 Forest Glen Dr | 0.50mi | 3/1.5 | 1,206 (+3%) | 2mo | $170,000 | $141 | 70 |
| 2515 Bryce Cv | 0.53mi | 3/2.0 | 1,194 (+2%) | 1mo | $194,000 | $162 | 70 |
| 2947 Waverly Dr | 0.21mi | 3/2.0 | 1,320 (+12%) | 1mo | $209,000 | $158 | 67 |
| 3435 Carroll Dr | 0.50mi | 3/2.0 | 1,173 (-0%) | 9mo | $162,000 | $138 | 67 |
| 6450 Yorkshire Rd | 0.45mi | 3/2.0 | 1,150 (-2%) | 9mo | $189,000 | $164 | 65 |
| 3045 Normandy Dr | 0.60mi | 4/1.5 (+1) | 1,238 (+5%) | 2mo | $160,000 | $129 | 57 |
| 6455 Knight Cv | 0.67mi | 3/2.0 | 1,117 (-5%) | 8mo | $209,900 | $188 | 52 |
| 3430 Mayfair Dr | 0.69mi | 3/2.0 | 1,089 (-7%) | 3mo | $204,900 | $188 | 51 |
| 2935 Briarwood Dr | 0.67mi | 3/1.0 | 1,274 (+8%) | 5mo | $180,000 | $141 | 48 |
| 6701 Tulane Rd | 0.71mi | 4/2.0 (+1) | 1,236 (+5%) | 6mo | $219,000 | $177 | 46 |
| 6705 Gatewood Cir | 0.71mi | 3/1.5 | 1,069 (-9%) | 8mo | $199,900 | $187 | 45 |
Match score weights: distance 35% · size 25% · config 20% · recency 20%. Top-matched comps best support the ARV.
Projected returns pro-forma
-3.0% appreciation · 0.0% rent growth · sell at horizon
- IRR
- -14.2%
- Equity multiple
- 0.51×
- Total profit
- $-22,803
- Equity at exit
- $24,587
- IRR
- -10.8%
- Equity multiple
- 0.43×
- Total profit
- $-26,279
- Equity at exit
- $14,258
Cash invested: $46,172 (down + closing). Projections, not guarantees.
Landlord ↔ Tenant lean methodology
- Overall (STATE)
- 90 Strongly Landlord-Friendly
- State Mississippi
- 90 Strongly Landlord-Friendly · R+11
- County
- — inherits STATE
- City
- — inherits STATE
ZIP-level market 38637
- Home prices YoY
- -13.4%
- Rents YoY
- -0.7%
- Active inventory
- 95
- Price-to-rent
- 9.1×
Monthly cashflow live
- Estimated rent
- $1,509 high interval (Pro) →
- Mortgage (P&I)
- −$865
- Tax from tax record
- −$127 /mo · $1,529/yr
- Insurance
- −$69
- HOA
- −$0
- Vacancy / Maint / Mgmt
- −$317
- Net cashflow
- $131
Break-even live
UW: 25.0% down · 7.5% · 30yr · 1.5% tax · 5.0% vac · 8.0% maint · 8.0% mgmt
Financing live
Cash to close
- Down payment
- $41,225
- Closing costs
- $4,947
- Reserves months
- —
- Total cash needed
- —
Loan-product check · same deal, 3 products live
Conventional
25% down · 7.5% · 30yr
- Down + closing
- —
- Monthly P&I
- —
- Monthly cashflow
- —
- DSCR
- —
- Eligible?
- —
Personal DTI + credit; lowest rate.
DSCR
20% down · 8.5% · 30yr
- Down + closing
- —
- Monthly P&I
- —
- Monthly cashflow
- —
- DSCR
- —
- Eligible?
- —
No personal income docs; deal must DSCR.
Hard money
10% down · 12.0% · 12mo
- Down + closing
- —
- Monthly P&I
- —
- Monthly cashflow
- —
- DSCR
- —
- Eligible?
- —
Short-term bridge; refi at stabilization.
Rent comps 40 comps
| Address | Beds | Baths | Sqft | Rent | $/sqft | DOM | Units | Dist |
|---|---|---|---|---|---|---|---|---|
| 2905 Brook Cv Horn Lake, MS | 3.0 | 1.0 | 1112 | $1,195 | $1.07 | 21d | 1 | 0.04mi |
| 2905 Brook Cv Horn Lake, MS | 3.0 | 1.0 | 1112 | $1,195 | $1.07 | 2d | 1 | 0.04mi |
| 2900 Brachton Cv W Horn Lake, MS | 2.0 | 2.0 | 1000 | $1,225 | $1.23 | 23d | 1 | 0.10mi |
| 5905 Tulane Rd Horn Lake, MS | 2.0 | 2.0 | 1342 | $1,300 | $0.97 | 21d | 1 | 0.18mi |
| 2912 Waverly Dr Horn Lake, MS | 3.0 | 2.0 | 1366 | $1,793 | $1.31 | 4d | 1 | 0.19mi |
| 5961 Kentwood Dr Horn Lake, MS | 3.0 | 2.0 | 1290 | $1,535 | $1.19 | 23d | 1 | 0.21mi |
| 6230 Somerset Dr Horn Lake, MS | 3.0 | 2.0 | 1204 | $1,593 | $1.32 | 3d | 1 | 0.23mi |
| 6360 Greenbriar Dr Horn Lake, MS | 3.0 | 1.5 | 1328 | $1,465 | $1.10 | 43d | 1 | 0.30mi |
| 3305 Laurel Dr Horn Lake, MS | 3.0 | 2.0 | 1085 | $1,450 | $1.34 | 23d | 1 | 0.35mi |
| 3060 Fairmeadow Dr Horn Lake, MS | 3.0 | 1.5 | 1104 | $1,663 | $1.51 | 2d | 1 | 0.38mi |
| 6475 Forest Glen Dr Horn Lake, MS | 3.0 | 1.5 | 1100 | $1,395 | $1.27 | 43d | 1 | 0.44mi |
| 2563 Waverly Dr Horn Lake, MS | 3.0 | 2.0 | 1133 | $1,550 | $1.37 | 21d | 1 | 0.48mi |
| 6165 Forestgate Rd Horn Lake, MS | 3.0 | 1.5 | 1079 | $1,400 | $1.30 | 43d | 1 | 0.56mi |
| 2675 Ridgewood Cv Horn Lake, MS | 3.0 | 1.0 | 1035 | $1,195 | $1.15 | 23d | 1 | 0.56mi |
| 2675 Ridgewood Cv Horn Lake, MS | 3.0 | 1.0 | 1065 | $1,195 | $1.12 | 21d | 1 | 0.56mi |
| 6420 Forestgate Rd Horn Lake, MS | 3.0 | 2.0 | 1120 | $1,573 | $1.40 | 21d | 1 | 0.56mi |
| 2890 Meadowbrook Dr Horn Lake, MS | 3.0 | 2.0 | 1171 | $1,375 | $1.17 | 3d | 1 | 0.57mi |
| 6545 Hermitage Rd Horn Lake, MS | 3.0 | 1.5 | 1200 | $1,295 | $1.08 | 43d | 1 | 0.57mi |
| 2921 Normandy Dr Horn Lake, MS | 3.0 | 1.5 | 1250 | $1,200 | $0.96 | 23d | 1 | 0.65mi |
| 2881 Normandy Dr Horn Lake, MS | 3.0 | 1.5 | 1283 | $1,450 | $1.13 | 43d | 1 | 0.71mi |
| 6420 Cornwall Rd Horn Lake, MS | 3.0 | 2.0 | 1189 | $1,550 | $1.30 | 14d | 1 | 0.74mi |
| 3530 Mayfair Dr Horn Lake, MS | 4.0 | 2.0 | 1300 | $1,595 | $1.23 | 14d | 1 | 0.78mi |
| 3285 Edenshire Ln Horn Lake, MS | 2.0 | 2.0 | 1407 | $1,573 | $1.12 | 23d | 1 | 0.81mi |
| 6585 Fairwood Cv Horn Lake, MS | 3.0 | 2.0 | 1473 | $1,553 | $1.05 | 23d | 1 | 0.83mi |
| 6445 Collinwood Rd Horn Lake, MS | 3.0 | 2.0 | 1450 | $1,593 | $1.10 | 2d | 1 | 0.83mi |
| 6290 Sandhurst Rd Horn Lake, MS | 3.0 | 2.0 | 1178 | $1,600 | $1.36 | 4d | 1 | 0.85mi |
| 3437 Laurelwood St Horn Lake, MS | 3.0 | 2.0 | 1200 | $1,480 | $1.23 | 11d | 1 | 0.86mi |
| 6225 Sandhurst Rd Horn Lake, MS | 3.0 | 2.0 | 1200 | $1,395 | $1.16 | 43d | 1 | 0.87mi |
| 2628 Hillcrest Cir Horn Lake, MS | 3.0 | 1.0 | 1260 | $1,275 | $1.01 | 43d | 1 | 0.87mi |
| 6455 Walnut Grove Rd Horn Lake, MS | 3.0 | 2.0 | 1178 | $1,600 | $1.36 | 43d | 1 | 0.89mi |
| 6420 Sandhurst Rd Horn Lake, MS | 3.0 | 2.0 | 1101 | $1,623 | $1.47 | 21d | 1 | 0.89mi |
| 3780 Southbrook Dr Horn Lake, MS | 4.0 | 2.0 | 1444 | $1,550 | $1.07 | 4d | 1 | 0.94mi |
| 3560 Lakehurst Dr Horn Lake, MS | 4.0 | 2.0 | 1300 | $1,425 | $1.10 | 17d | 1 | 0.97mi |
| 5640 Ingleside Dr Horn Lake, MS | 3.0 | 2.0 | 1500 | $1,575 | $1.05 | 4d | 1 | 0.99mi |
| 6270 Jamestown Ave Horn Lake, MS | 3.0 | 2.0 | 1053 | $1,523 | $1.45 | 43d | 1 | 1.09mi |
| 6871 Center St Horn Lake, MS | 2.0 | 1.0 | 1400 | $1,395 | $1.00 | 43d | 1 | 1.09mi |
| 7101 Tulane Rd N Horn Lake, MS | 2.0–3.0 | 2.0 | 1189 | $1,750 | $1.47 | 2d | 6 | 1.18mi |
| 7084 Windsor Dr Horn Lake, MS | 4.0 | 2.0 | 1480 | $1,815 | $1.23 | 4d | 1 | 1.19mi |
| 7080 Benji Ave Horn Lake, MS | 3.0 | 2.0 | 1276 | $1,550 | $1.21 | 43d | 1 | 1.22mi |
| 3915 Woodland Dr Horn Lake, MS | 3.0 | 2.0 | 1400 | $1,775 | $1.27 | 43d | 1 | 1.24mi |
Listing history 27 events
-
2026-06-18days on market $164,900 Active 80 DOM
-
2026-06-17days on market $164,900 Active 79 DOM
-
2026-06-16days on market $164,900 Active 78 DOM
-
2026-06-15days on market $164,900 Active 77 DOM
-
2026-06-13days on market $164,900 Active 75 DOM
-
2026-06-10days on market $164,900 Active 72 DOM
-
2026-06-09days on market $164,900 Active 71 DOM
-
2026-06-08days on market $164,900 Active 70 DOM
-
2026-06-07days on market $164,900 Active 69 DOM
-
2026-06-03days on market $164,900 Active 65 DOM
-
2026-06-02days on market $164,900 Active 64 DOM
-
2026-06-01days on market $164,900 Active 63 DOM
-
2026-05-31days on market $164,900 Active 62 DOM
-
2026-03-30$169,900 Active 575-char remark
Show marketing remark (575 chars)
Spacious single-story home featuring 4 bedrooms, 1.5 bath with a functional and inviting layout. The main living areas offer comfortable space for both everyday living and entertaining, while the kitchen provides ample cabinet and counter space and flows into the dining and living areas. The primary bedroom includes an en-suite bathroom and generous closet space. Additional bedrooms offer flexibility for guests, office, or hobbies. Enjoy the backyard with space to relax or entertain. Great opportunity with plenty of potential! One or more photo(s) was virtually staged.
-
2026-01-09price $159,000
-
2025-12-15status Active
-
2025-11-19price $159,900
-
2025-11-07status Active
-
2025-10-23status Pending
-
2025-10-23historical
-
2025-10-23historical
-
2025-10-15price $165,000
-
2025-09-05price $169,900
-
2025-08-15$173,400 Active
-
2015-11-24soldstatus
-
2015-11-19soldstatus
-
2015-06-04$57,500
ⓘ Source: listings_history table (triggers on properties + properties_extension) + one-shot
backfill from property_details.listing_events for pre-trigger history.
Tax reassessment forecast MS · Resets to sale price
- Current annual tax
- $1,529 · $127/mo
- Projected year-2 tax
- $1,529 · $127/mo
- Expected delta
- $0/yr ($0/mo · 0.0%)
ⓘ Screening estimate from a state-policy table — verify with the county assessor before closing.
Climate risk First Street
- Flood 1/10 Low FEMA zone X (unshaded) · 0% chance over 30 yrs
- Wildfire 4/10 Moderate
- Heat 6/10 Major 7 d/yr ≥109°F today · 21 d/yr by 30 yrs out
- Wind 4/10 Moderate 19% chance of damaging wind over 30 yrs
- Air quality 2/10 Low 2 unhealthy d/yr today · 2 by 30 yrs out
Nearby sold comps map
Loading sold comps map…
Walkable amenities ~0.75 mi
Loading nearby amenities…
Taxation est. · year 1
- Rental income
- $18,110
- − Mortgage interest
- −$9,237
- − Property taxes
- −$1,529
- − Insurance
- −$824
- − Repairs & maintenance
- −$1,449
- − Management
- −$1,449
- − Depreciation
- −$4,797
- Taxable loss
- −$1,175
- Est. tax savings @ 24.0%
- +$282
- After-tax cash flow
- $1,858/yr
For passive investors: Depreciation is non-cash, so a rental often shows a tax loss while cash-flowing — sheltering income. Rental losses are passive: they offset passive income freely, and up to $25,000/yr can offset ordinary (W-2) income if you actively participate and your MAGI is under $100k (phasing out to $0 by $150k); unused losses carry forward. On sale, claimed depreciation is recaptured at up to 25%, and gains may owe capital-gains tax (a 1031 exchange can defer both). Figures are a year-1 estimate at your 24.0% rate — not tax advice; consult a CPA.
Schools (NCES district)
- District
- Desoto County School District
- NCES district ID
- 2801320
- Math proficiency
- 48% ▼ -13.00%
- Reading proficiency
- 42% ▼ -6.00%
- Median HH income
- $59,272
- Composite
- 39.56/100
- National rank
- #3933
- State rank
- #20 of 130 in MS
Livability — Horn Lake
- Score
- 61/100
- State rank
- #196
- US rank
- #17977
Category grades
Schools grade is shown separately in the Schools card above.
Census & demographics
- Census place
- Horn Lake, MS
- County
- DeSoto County · 176,513 people
- City population
- 26,647
- Metro
- Memphis, TN-MS-AR
- Population (ZIP)
- 26,647
- Household income
- $53,311
- Rent vs Own
- Severe rent burden
- 1052.0
Population outlook (DeSoto County) Hauer SSP2
- Today (2025)
- 203,338 people
- By 2030
- 217,692 · +7.1%
- By 2040
- 245,320 · +20.6%
- By 2050
- 270,133 · +32.8%
- By 2075
- 323,341 · +59.0%
- By 2100
- 348,742 · +71.5%
Race, ethnicity, and origin ACS 2023
- Neighborhood character
- Diverse neighborhood (Simpson 0.62)
- Race & ethnicity
- Black 44% White 42% Hispanic / Latino 9% Two or more races 5% Asian 1%
- Hispanic origin (detail)
- Mexican 7%
- Common ancestry
- Slovak 2% Lithuanian 1% Serbian 1%
- Foreign-born
- 7% · Canada
- Languages at home
- 91% English-only · Spanish 8%
Political lean MEDSL · DeSoto
- 2024 margin
- Strong R (+24.1) · D 36.7% · R 60.8% · Other 2.5%
- 2008→2024 swing
- +14.2pp toward D · 2008: -38.2pp · 2024: -24.1pp
- All cycles
- 2024: R+24.1 2020: R+23.9 2016: R+34.8 2012: R+33.5 2008: R+38.2
Not yet ingested
- Civics
- —
Market trends
- HPI YoY
- ▼ -32.08%
- Current HPI
- 206.5542
- Rent YoY
- ▼ -0.66%
- Metro
- Memphis, TN-MS-AR
- State GDP YoY
- —
- F500 in state
- 0
Price history
+195.5% since first listed14 events — show timeline
- 2026-03-30 Listed $169,900 MLSU
- 2026-01-09 Price Changed $159,000 MLSU
- 2025-12-15 Relisted — MLSU
- 2025-11-19 Price Changed $159,900 MLSU
- 2025-11-07 Relisted — MLSU
- 2025-10-23 Pending — MLSU
- 2025-10-23 Listing Removed — MLSU
- 2025-10-23 Listing Removed — MLSU
- 2025-10-15 Price Changed $165,000 MLSU
- 2025-09-05 Price Changed $169,900 MLSU
- 2025-08-15 Listed $173,400 MLSU
- 2015-11-24 Sold (Public Records) — Public Records
- 2015-11-19 Sold (MLS) — MLSU
- 2015-06-04 Listed $57,500 MLSU
Property tax history
+2.1%/yrLatest (2025): $1,529 · +13.6% YoY. Source: county tax records.
Cash-flow waterfall
monthlySold comps — $/sqft
last 12 mo · ≤1 miLoading sold comps…