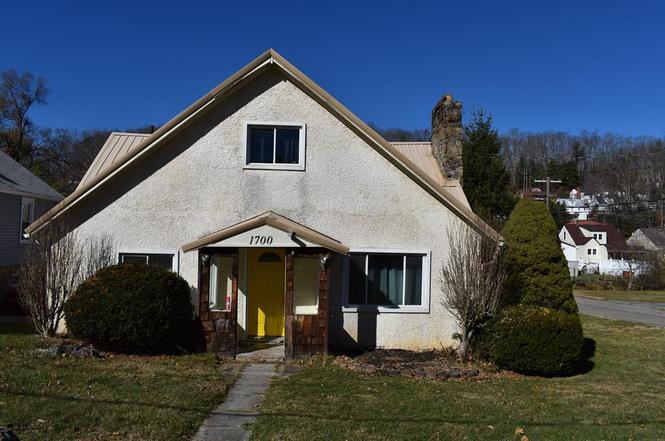
1700 Ohio St · Bluefield, WV
Flood risk 9/10 · Severe
- FEMA flood zone
- X (unshaded)
- Chance of flooding over 30 yrs
- 0.99%
- Est. flood insurance / yr
- $473 – $860
Fire risk 4/10 · Minor
- Est. fire insurance / yr
- $787 – $1,461
Heat risk 3/10 · Minor
- Hot days now (above 90°F)
- 8 days/yr
- Hot days in 30 yrs
- 25 days/yr
Wind risk 2/10 · Minimal
- Chance of severe wind over 30 yrs
- 1.0%
Air-quality risk 1/10 · Minimal
- Unhealthy air days now
- 0 days/yr
- Unhealthy air days in 30 yrs
- 0 days/yr
Risk factors via First Street. Map © Google.
Why this score? — see what drove the A- grade
The composite is a weighted blend of 9 inputs, each scored 0–100. Each bar is that input's sub-score; the figure is the points it added to the 100-point composite (weight × sub-score).
- Cash flow +30.0/30.0
- ARV discount +15.0/15.0
- DSCR +10.0/10.0
- 1% rule +8.2/10.0
- Appreciation +6.7/10.0
- Livability +2.8/5.0
- Schools +2.6/10.0
- Rent growth +2.5/5.0
- Condition / age +2.5/5.0
$95,000
🖨 Deal sheet (PDF) 📄 Offer letter ✓ Due diligence
Listing remarks
Charming 4-Bedroom Home on a Corner Level Lot Welcome to this charming 4-bedroom, 1-bath home located in a great neighborhood, perfect for first-time buyers or anyone looking to downsize. This inviting home features both a living room and a family room, offering flexible spaces for relaxing, entertaining, or creating a home office. The property includes original hardwood floors that add character and timeless appeal, along with a durable metal roof for long-lasting protection and low-maintenance peace of mind. Situated on a level corner lot, the home provides ample outdoor space to enjoy. Located within walking distance to the VA line with access to all amenities.
Key facts
- Durable metal roof
- Ample outdoor space
- Corner level lot
Tags
Property features AI
Exterior
- Parking: Asphalt parking
- Utilities: Public water; Public sewer
- Home design: Single-family residence; 2-story
- Construction: Stucco exterior; Has a crawl space and partial, unfinished basement
- Exterior features: Storage structure on property
Interior
- Bathrooms: 1 full bathroom
- Heating & cooling: Forced air heating (natural gas); Window air conditioning units
- Interior features: Insulated windows; Storm door(s)
Neighborhood map
What this means for you Summary
Snapshot
- This is a 4-bed/1.0-bath single-family listed at $95k.
Deal economics
- At list price, monthly cash flow is $304 ($4k/yr) — positive.
- The deal already cash-flows at list — no discount required.
- Meets the 1% rule at list price ($1k rent vs $95k).
- Recommended offer: $84k (12.0% below list) — sets the bar for market timing.
- Cap rate 10.8% vs local median 5.2% in Bluefield — top-decile yield for the area; either an underpriced asset or a hidden risk that comps aren't pricing in. Stress-test before assuming the spread holds.
Location & tenants
- Location reads 56/100 on livability (#265 in WV) — a working-class tenant base; expect higher turnover. Strengths: cost of living A+, housing A+; Watch: crime D+, amenities F, commute F.
- Mercer County Schools (town): math 26% / reading 37% proficiency, ranked #28 of 55 in WV (top 51%) — families likely to look elsewhere, expect single-tenant / working-renter base with shorter leases.
- Zoned schools: Bluefield Primary School (346 students, 0% FRL); Bluefield Middle School (math 21% / reading 35%, grade F, #66 of 109 statewide, top 63%, 467 students, 0% FRL); Bluefield High School (math 22% / reading 47%, grade F, #42 of 110 statewide, top 47%, 608 students, 0% FRL) — zoned schools average 0% FRL vs 54% district-wide (54 pts lower); this property's tenant base skews higher-income than the district average.
- Market conditions: 52 active listings in the ZIP; 4 units permitted in Mercer County in 2024 (0 in 5+ unit buildings).
Forward outlook
- In year one you build about $4k of equity ($657 loan paydown + $3k appreciation (3.4% local appreciation)).
- Mercer County population projected at -18% by 2050 — secular population decline; favor cash flow + early exit over multi-decade hold.
- At projected returns (3.4% appreciation + 3.0% rent growth), your $27k cash investment doubles in ~4 years — after that, you're playing with house money.
- By year 9, paydown + projected appreciation supports a ~$33k cash-out refi (75% LTV) — recoverable capital for the next deal without selling this one.
Negotiation context
- It's been on market 196 days — a 12% lower offer ($84k) is reasonable based on typical stale-listing flexibility.
- 3 sale attempts; this cycle's ask has dropped $22k (19%) from the opening price — seller is motivated, your offer sets the floor, not the list.
Risks & watch-outs
- Watch-outs: flood insurance adds $56/mo; built in 1940 — expect roof / HVAC / electrical / plumbing capex.
- Climate carrying-cost: severe flood risk — expect insurance premiums to compound above CPI over the hold.
Questions for the listing agent
- It's been on market 196 days. Have you received any prior offers? Is the seller open to a 12% concession, seller financing, or rate buy-down credit?
- Built in 1940 — when were the roof, HVAC, electrical panel, plumbing, and water heater last replaced?
- What's the actual annual flood-insurance premium (NFIP or private), and is the property in a SFHA with mandatory coverage?
- Why hasn't it sold? Are there any deal-killer items the seller is aware of (foundation, flood, title, zoning, code violations)?
- Is there a deadline driving the sale (1031 exchange, divorce, estate, relocation)? That informs how much negotiation room exists.
- Schools are F-rated, which usually means shorter tenancies and higher turnover. Who's the typical renter profile here, and what's been the actual vacancy rate?
- Crime grade is D in this area — have there been break-ins, vandalism, or insurance claims at this property in the last 3 years? What carrier currently insures it and at what premium?
- What's the average days-on-market for RENTAL listings here right now (not sales)? A rising rental-DOM trend means longer vacancies and softer asking-rent achievability than the comps imply.
- What's the recent tenant-quality profile in this submarket — average credit score on applications, eviction rate, late-payment / NSF rate, and stable-employment percentage? A property-management company in the area should have these aggregated.
- How much new for-sale + rental construction is in the pipeline within 1–3 miles? Heavy new supply typically softens prices + rents 12–24 months out; constrained supply supports both.
Investment metrics
- 1% rule
- 1.32% ✓
- Cap rate
- 10.84%
- Cash-on-cash
- 16.24%
- DSCR
- 1.72
- GRM
- 6.3
CMA / ARV
- ARV (on-the-fly)
- $123,714
- Comps found
- 4
Show comp detail 4 sales within ~0.75 mi
| Address | Dist | Beds/Ba | Sqft | Sold | Price | $/sf | Match |
|---|---|---|---|---|---|---|---|
| 1217 Augusta St | 0.44mi | 3/2.0 (-1) | 1,680 (+7%) | 20mo | $120,000 | $71 | 42 |
| 901 Frederick St | 0.67mi | 3/1.0 (-1) | 1,420 (-9%) | 16mo | $100,000 | $70 | 34 |
| 870 Shenandoah Ave | 0.71mi | 3/2.0 (-1) | 1,704 (+9%) | 16mo | $134,000 | $79 | 30 |
| 912 Augusta St | 0.63mi | 3/2.0 (-1) | 1,776 (+13%) | 22mo | $147,500 | $83 | 21 |
Match score weights: distance 35% · size 25% · config 20% · recency 20%. Top-matched comps best support the ARV.
Projected returns pro-forma
3.42% appreciation · 3.0% rent growth · sell at horizon
- IRR
- 21.3%
- Equity multiple
- 2.24×
- Total profit
- $33,020
- Equity at exit
- $45,002
- IRR
- 22.1%
- Equity multiple
- 4.30×
- Total profit
- $87,823
- Equity at exit
- $71,185
Cash invested: $26,600 (down + closing). Projections, not guarantees.
Landlord ↔ Tenant lean methodology
- Overall (STATE)
- 83 Strongly Landlord-Friendly
- State West Virginia
- 83 Strongly Landlord-Friendly · R+22
- County
- — inherits STATE
- City
- — inherits STATE
ZIP-level market 24701
- Home prices YoY
- 1.6%
- Active inventory
- 52
- Price-to-rent
- 6.3×
Monthly cashflow live
- Estimated rent
- $1,253 medium interval (Pro) →
- Mortgage (P&I)
- −$498
- Tax from tax record
- −$92 /mo · $1,104/yr
- Insurance
- −$40
- Flood insurance flood zone
- −$56 /mo · $666/yr
- HOA
- −$0
- Vacancy / Maint / Mgmt
- −$263
- Net cashflow
- $304
Break-even live
Sensitivity live
| Price | -10% $358 | -5% $331 | +0% $304 | +5% $278 | +10% $251 |
|---|---|---|---|---|---|
| Rent | -10% $205 | -5% $255 | +0% $304 | +5% $354 | +10% $403 |
| Rate | -1.0pp $352 | -0.5pp $329 | base $304 | +0.5pp $280 | +1.0pp $255 |
UW: 25.0% down · 7.5% · 30yr · 1.5% tax · 5.0% vac · 8.0% maint · 8.0% mgmt
Financing live
Cash to close
- Down payment
- $23,750
- Closing costs
- $2,850
- Reserves months
- —
- Total cash needed
- —
Loan-product check · same deal, 3 products live
Conventional
25% down · 7.5% · 30yr
- Down + closing
- —
- Monthly P&I
- —
- Monthly cashflow
- —
- DSCR
- —
- Eligible?
- —
Personal DTI + credit; lowest rate.
DSCR
20% down · 8.5% · 30yr
- Down + closing
- —
- Monthly P&I
- —
- Monthly cashflow
- —
- DSCR
- —
- Eligible?
- —
No personal income docs; deal must DSCR.
Hard money
10% down · 12.0% · 12mo
- Down + closing
- —
- Monthly P&I
- —
- Monthly cashflow
- —
- DSCR
- —
- Eligible?
- —
Short-term bridge; refi at stabilization.
Listing history 20 events
-
2026-06-19days on market $95,000 Active 196 DOM
-
2026-06-18days on market $95,000 Active 195 DOM
-
2026-06-17days on market $95,000 Active 194 DOM
-
2026-06-16days on market $95,000 Active 193 DOM
-
2026-06-15days on market $95,000 Active 192 DOM
-
2026-06-14days on market $95,000 Active 190 DOM
-
2026-06-12days on market $95,000 Active 189 DOM
-
2026-06-09days on market $95,000 Active 186 DOM
-
2026-06-08days on market $95,000 Active 185 DOM
-
2026-06-07days on market $95,000 Active 184 DOM
-
2026-06-05days on market $95,000 Active 181 DOM
-
2026-06-02days on market $95,000 Active 179 DOM
-
2026-06-01days on market $95,000 Active 178 DOM
-
2026-05-31days on market $95,000 Active 177 DOM
-
2026-05-30days on market $95,000 Active 176 DOM
-
2026-05-26status Active
-
2026-04-14price $95,000
-
2026-02-12price $104,900
-
2025-12-15status Active
-
2025-11-19$117,500 Active
ⓘ Source: listings_history table (triggers on properties + properties_extension) + one-shot
backfill from property_details.listing_events for pre-trigger history.
Tax reassessment forecast WV · Resets to sale price
- Current annual tax
- $1,104 · $92/mo
- Projected year-2 tax
- $1,104 · $92/mo
- Expected delta
- $0/yr ($0/mo · 0.0%)
ⓘ Screening estimate from a state-policy table — verify with the county assessor before closing.
Climate risk First Street
- Flood 9/10 Extreme FEMA zone X (unshaded) · 99% chance over 30 yrs
- Wildfire 4/10 Moderate
- Heat 3/10 Moderate 8 d/yr ≥90°F today · 25 d/yr by 30 yrs out
- Wind 2/10 Low 100% chance of damaging wind over 30 yrs
- Air quality 1/10 Low 0 unhealthy d/yr today · 0 by 30 yrs out
Nearby sold comps map
Loading sold comps map…
Walkable amenities ~0.75 mi
Loading nearby amenities…
Taxation est. · year 1
- Rental income
- $15,034
- − Mortgage interest
- −$5,321
- − Property taxes
- −$1,104
- − Insurance
- −$1,142
- − Repairs & maintenance
- −$1,203
- − Management
- −$1,203
- − Depreciation
- −$2,764
- Taxable income
- $2,298
- Est. tax owed @ 24.0%
- −$552
- After-tax cash flow
- $3,102/yr
For passive investors: Depreciation is non-cash, so a rental often shows a tax loss while cash-flowing — sheltering income. Rental losses are passive: they offset passive income freely, and up to $25,000/yr can offset ordinary (W-2) income if you actively participate and your MAGI is under $100k (phasing out to $0 by $150k); unused losses carry forward. On sale, claimed depreciation is recaptured at up to 25%, and gains may owe capital-gains tax (a 1031 exchange can defer both). Figures are a year-1 estimate at your 24.0% rate — not tax advice; consult a CPA.
Schools (NCES district)
- District
- Mercer County Schools
- NCES district ID
- 5400840
- Math proficiency
- 26% ▼ -13.00%
- Reading proficiency
- 37% ▼ -6.00%
- Median HH income
- $35,064
- Composite
- 25.98/100
- National rank
- #7325
- State rank
- #28 of 55 in WV
Livability — Bluefield
- Score
- 56/100
- State rank
- #265
- US rank
- #22470
Category grades
Schools grade is shown separately in the Schools card above.
Census & demographics
- Census place
- Bluefield, WV
- County
- Mercer County · 33,615 people
- City population
- 17,117
- Metro
- Bluefield, WV-VA
- Population (ZIP)
- 17,117
- Household income
- $50,455
- Rent vs Own
- Severe rent burden
- 302.0
Population outlook (Mercer County) Hauer SSP2
- Today (2025)
- 57,860 people
- By 2030
- 55,781 · -3.6%
- By 2040
- 51,365 · -11.2%
- By 2050
- 47,476 · -17.9%
- By 2075
- 38,851 · -32.9%
- By 2100
- 30,053 · -48.1%
Race, ethnicity, and origin ACS 2023
- Neighborhood character
- Predominantly White (82%)
- Race & ethnicity
- White 82% Black 9% Two or more races 7% Hispanic / Latino 2%
- Common ancestry
- Slovak 2% Serbian 1% Danish 1%
- Foreign-born
- 1%
- Languages at home
- 96% English-only · Spanish 3%
Political lean MEDSL · Mercer
- 2024 margin
- Solid R (+57.3) · D 20.6% · R 77.9% · Other 1.5%
- 2008→2024 swing
- -29.8pp toward R · 2008: -27.6pp · 2024: -57.3pp
- All cycles
- 2024: R+57.3 2020: R+54.4 2016: R+55.3 2012: R+47.1 2008: R+27.6
Not yet ingested
- Civics
- —
Market trends
- HPI YoY
- ▲ 3.42%
- Current HPI
- 215.9682
- Rent YoY
- —
- Metro
- Bluefield, WV-VA
- State GDP YoY
- —
- F500 in state
- 0
Price history
-19.1% since first listed5 events — show timeline
- 2026-05-26 Relisted — MTCBOR
- 2026-04-14 Price Changed $95,000 MTCBOR
- 2026-02-12 Price Changed $104,900 MTCBOR
- 2025-12-15 Relisted — MTCBOR
- 2025-11-19 Listed $117,500 MTCBOR
Property tax history
+22.6%/yrLatest (2025): $1,104 · +6.6% YoY. Source: county tax records.
Cash-flow waterfall
monthlySold comps — $/sqft
last 12 mo · ≤1 miLoading sold comps…