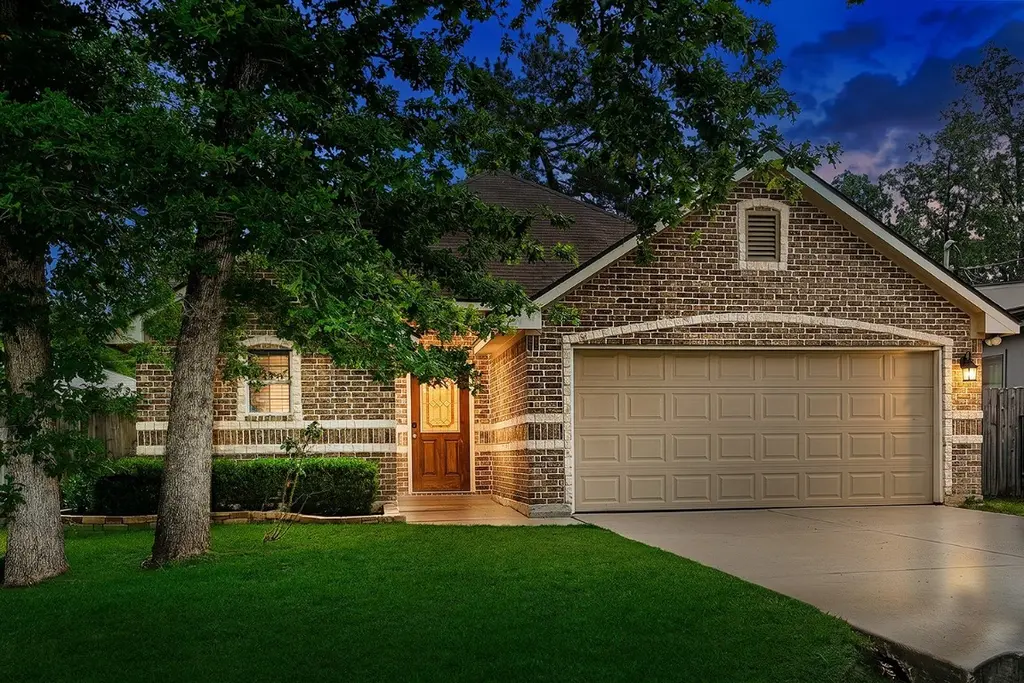
10912 Redbird · Oak Ridge North, TX
Flood risk 1/10 · Minimal
- FEMA flood zone
- X (unshaded)
- Chance of flooding over 30 yrs
- 0.0%
- Est. flood insurance / yr
- $507 – $1,088
Fire risk 3/10 · Minor
- Est. fire insurance / yr
- $1,222 – $2,270
Heat risk 8/10 · Major
- Hot days now (above 111°F)
- 7 days/yr
- Hot days in 30 yrs
- 24 days/yr
Wind risk 8/10 · Major
- Chance of severe wind over 30 yrs
- 99.0%
Air-quality risk 3/10 · Minor
- Unhealthy air days now
- 2 days/yr
- Unhealthy air days in 30 yrs
- 3 days/yr
Risk factors via First Street. Map © Google.
Why this score? — see what drove the D- grade
The composite is a weighted blend of 9 inputs, each scored 0–100. Each bar is that input's sub-score; the figure is the points it added to the 100-point composite (weight × sub-score).
- ARV discount +10.3/15.0
- Cash flow +8.7/30.0
- Schools +5.1/10.0
- Livability +4.2/5.0
- Rent growth +3.5/5.0
- 1% rule +3.0/10.0
- Condition / age +2.5/5.0
- DSCR +2.4/10.0
- Appreciation +0.0/10.0
$260,000
🖨 Deal sheet (PDF) 📄 Offer letter ✓ Due diligence
Listing remarks MLS
Beautiful and well priced! Come take a look at this updated 3 bedroom home built in 2009. Well cared for by the original owners, this home boasts, fresh paint in the latest colors, beautiful tile, updated carpet, crown molding, stainless steel appliances and granite counters. It will be hard to find a comparable home at this price. Don't let this opportunity pass you by. Call to see it today.
Key facts
- Open concept kitchen
- Convenient access
- Generous storage
Tags
Property features AI
Exterior
- Parking: Attached garage with 2 spaces
- Security: Smoke detectors
- Utilities: Public water; Public sewer
- Home design: Residential property; Single-story (entry level: first floor)
- Construction: Built in 2009; Brick, cement siding and stone exterior; Composition roof; Slab foundation
- Exterior features: Covered patio; Deck; Patio; Fenced backyard; Private yard
Interior
- Kitchen: Dishwasher; Electric oven; Electric range; Microwave; Garbage disposal
- Bedrooms: Primary bedroom on first floor (approx. 14x12); Bedroom on first floor (approx. 10x10); Bedroom on first floor (approx. 10x10)
- Flooring: Carpet; Tile
- Bathrooms: 2 full bathrooms
- Heating & cooling: Central heating (gas); Central electric air conditioning
- Interior features: High ceilings; Kitchen/family room combo; Pantry; Separate shower; Ceiling fans; Programmable thermostat
- Laundry & utility: Washer hookup; Electric dryer hookup; Utility room on first floor
Neighborhood map
What this means for you Summary
Snapshot
- This is a 3-bed/2.0-bath single-family listed at $260k.
Deal economics
- At list price, monthly cash flow is $-221 ($-3k/yr) — negative.
- To cash-flow at today's rent, offer at most $221k (15.0% below list).
- To meet the 1% rule (rent ≥ 1% of price), the offer needs to be $209k (19.8% below list).
- Recommended offer: $209k (19.8% below list) — sets the bar for 1% rule.
- Cap rate 5.3% vs local median 3.1% in Oak Ridge North — top-decile yield for the area; either an underpriced asset or a hidden risk that comps aren't pricing in. Stress-test before assuming the spread holds.
Location & tenants
- Location reads 84/100 on livability (#8 in TX, #708 nationally) — a professional / high-income tenant draw. Strengths: employment A+, housing A+, crime B+; Watch: amenities D+.
- Conroe ISD (other): math 57% / reading 57% proficiency, ranked #69 of 826 in TX (top 8%) — acceptable for families but not a draw, mixed tenant base, ~2y average lease.
- Zoned schools: Houser El (math 47% / reading 42%, grade F, #1,155 of 4,322 statewide, top 29%, 636 students, 70% FRL); Irons J H (math 54% / reading 53%, grade C+, #275 of 1,662 statewide, top 17%, 1,344 students, 52% FRL); Conroe H S (math 32% / reading 51%, grade F, #767 of 1,632 statewide, top 47%, 4,915 students, 61% FRL) — zoned schools average 61% FRL vs 34% district-wide (27 pts higher); higher-poverty schools than district average — tighter screening recommended.
- Market conditions: Rents rising (+3.9%/yr); 320 active listings in the ZIP; 5 comparable units currently listed for rent nearby; rentals at typical pace (median 16d on market — plan ~3-4 weeks tenant-placement turnaround); high-income renter base; 13,259 units permitted in Montgomery County in 2024 (1,402 in 5+ unit buildings).
Forward outlook
- Local home prices are declining (-3.0%/yr); year-one equity from $2k of loan paydown is wiped out by about $8k of value loss. Plan a longer hold.
- Montgomery County population projected at +65% by 2050 — long-run rental-demand tailwind backs the buy-and-hold thesis.
Negotiation context
- It's been on market 21 days — a 2% lower offer ($256k) is reasonable based on typical stale-listing flexibility.
- 4 sale attempts since 17y ago with the ask held roughly flat each time — persistent listings suggest the price (not the market) is what's stuck; bring a comps-based counter.
Risks & watch-outs
- Climate carrying-cost: severe wind risk, 99% chance of damaging wind over 30y; extreme-heat days projected 7→24/yr by 2055 (HVAC capex compounding) — expect insurance premiums to compound above CPI over the hold.
Questions for the listing agent
- What do current leases actually rent for vs. the listed asking? Can we see a recent rent roll and the last 12 months of T-12 income?
- Is there a deadline driving the sale (1031 exchange, divorce, estate, relocation)? That informs how much negotiation room exists.
- Schools are A-rated — typically a magnet for longer-tenancy family renters. What's the average tenant stay here, and is there a school-zone premium baked into asking?
- The area grade is low — what's the realistic commute time and amenity access for the typical tenant pool here? Any planned neighborhood developments (good or bad) we should know about?
- What's the average days-on-market for RENTAL listings here right now (not sales)? A rising rental-DOM trend means longer vacancies and softer asking-rent achievability than the comps imply.
- What's the recent tenant-quality profile in this submarket — average credit score on applications, eviction rate, late-payment / NSF rate, and stable-employment percentage? A property-management company in the area should have these aggregated.
- How much new for-sale + rental construction is in the pipeline within 1–3 miles? Heavy new supply typically softens prices + rents 12–24 months out; constrained supply supports both.
Investment metrics
- 1% rule
- 0.80% ✗
- Cap rate
- 5.27%
- Cash-on-cash
- -3.64%
- DSCR
- 0.84
- GRM
- 10.4
CMA / ARV
- ARV (median comp)
- $277,298
- List price
- $260,000
- Delta
- -2.99%
- Verdict
- FAIR
- Comps
- 20 within 1.0 mi
Show comp detail 12 sales within ~0.75 mi
| Address | Dist | Beds/Ba | Sqft | Sold | Price | $/sf | Match |
|---|---|---|---|---|---|---|---|
| 10921 Oriole Pl | 0.25mi | 3/2.0 | 1,542 (+12%) | 1mo | $279,999 | $182 | 68 |
| 1615 Beech Dr Dr | 0.46mi | 3/2.0 | 1,456 (+5%) | 2mo | $259,900 | $179 | 68 |
| 32014 Quail Terrace Ln | 0.56mi | 3/2.0 | 1,389 (+0%) | 7mo | $274,000 | $197 | 67 |
| 1527 Glen Oaks Dr | 0.22mi | 3/2.0 | 1,494 (+8%) | 12mo | $322,000 | $216 | 66 |
| 10915 Hummingbird Pl | 0.14mi | 3/2.0 | 1,527 (+10%) | 16mo | $314,000 | $206 | 62 |
| 10615 Twin Oak Dr | 0.34mi | 4/2.0 (+1) | 1,461 (+6%) | 11mo | $218,500 | $150 | 61 |
| 10732 Twin Oaks Dr | 0.29mi | 3/2.0 | 1,550 (+12%) | 7mo | $250,000 | $161 | 60 |
| 10626 Fussel Rd | 0.65mi | 3/2.0 | 1,400 (+1%) | 9mo | $355,000 | $254 | 60 |
| 1306 Glen Oaks Dr | 0.33mi | 3/2.0 | 1,506 (+9%) | 14mo | $350,000 | $232 | 58 |
| 10705 Fairview Dr | 0.39mi | 3/1.0 | 1,240 (-10%) | 5mo | $209,999 | $169 | 56 |
| 1245 Chateau Woods Pkwy Dr | 0.58mi | 3/2.0 | 1,498 (+8%) | 8mo | $299,000 | $200 | 53 |
| 10217 Wood Fern Ct | 0.72mi | 3/2.0 | 1,540 (+11%) | 20mo | $257,000 | $167 | 31 |
Match score weights: distance 35% · size 25% · config 20% · recency 20%. Top-matched comps best support the ARV.
Projected returns pro-forma
-3.0% appreciation · 3.88% rent growth · sell at horizon
- IRR
- -21.4%
- Equity multiple
- 0.25×
- Total profit
- $-54,257
- Equity at exit
- $38,767
- IRR
- -12.9%
- Equity multiple
- 0.21×
- Total profit
- $-57,269
- Equity at exit
- $22,480
Cash invested: $72,800 (down + closing). Projections, not guarantees.
Landlord ↔ Tenant lean methodology
- Overall (STATE)
- 87 Strongly Landlord-Friendly
- State Texas
- 87 Strongly Landlord-Friendly · R+5
- County
- — inherits STATE
- City
- — inherits STATE
ZIP-level market 77385
- Home prices YoY
- -27.5%
- Rents YoY
- 3.9%
- Active inventory
- 320
- Price-to-rent
- 10.4×
Monthly cashflow live
- Estimated rent
- $2,085 high interval (Pro) →
- Mortgage (P&I)
- −$1,363
- Tax from tax record
- −$396 /mo · $4,756/yr
- Insurance
- −$108
- HOA
- −$0
- Lot rent
- −$0
- Vacancy / Maint / Mgmt
- −$438
- Net cashflow
- $-221
Break-even live
Sensitivity live
| Price | -10% $-74 | -5% $-147 | +0% $-221 | +5% $-294 | +10% $-368 |
|---|---|---|---|---|---|
| Rent | -10% $-386 | -5% $-303 | +0% $-221 | +5% $-138 | +10% $-56 |
| Rate | -1.0pp $-90 | -0.5pp $-155 | base $-221 | +0.5pp $-288 | +1.0pp $-357 |
UW: 25.0% down · 7.5% · 30yr · 1.5% tax · 5.0% vac · 8.0% maint · 8.0% mgmt
Financing live
Cash to close
- Down payment
- $65,000
- Closing costs
- $7,800
- Reserves months
- —
- Total cash needed
- —
Loan-product check · same deal, 3 products live
Conventional
25% down · 7.5% · 30yr
- Down + closing
- —
- Monthly P&I
- —
- Monthly cashflow
- —
- DSCR
- —
- Eligible?
- —
Personal DTI + credit; lowest rate.
DSCR
20% down · 8.5% · 30yr
- Down + closing
- —
- Monthly P&I
- —
- Monthly cashflow
- —
- DSCR
- —
- Eligible?
- —
No personal income docs; deal must DSCR.
Hard money
10% down · 12.0% · 12mo
- Down + closing
- —
- Monthly P&I
- —
- Monthly cashflow
- —
- DSCR
- —
- Eligible?
- —
Short-term bridge; refi at stabilization.
Rent comps 5 comps
| Address | Beds | Baths | Sqft | Rent | $/sqft | DOM | Units | Dist |
|---|---|---|---|---|---|---|---|---|
| 10648 Fussel Rd Conroe, TX | 4.0 | 2.0 | 1708 | $2,300 | $1.35 | 46d | 1 | 0.68mi |
| 32331 Summer Park Ln Conroe, TX | 3.0 | 2.0 | 1796 | $2,000 | $1.11 | 24d | 1 | 0.99mi |
| 10118 Falvey Lake Ln Unit 19551 Conroe, TX | 3.0 | 2.0 | 1200 | $1,560 | $1.30 | 9d | 1 | 1.03mi |
| 10118 Falvey Lake Ln Unit 19547 Conroe, TX | 3.0 | 2.0 | 1216 | $1,650 | $1.36 | 9d | 1 | 1.03mi |
| 2519 Braley Park Ln Conroe, TX | 3.0 | 2.0 | 1802 | $2,049 | $1.14 | 16d | 1 | 1.05mi |
Listing history 24 events
-
2026-06-22days on market $260,000 Active 21 DOM
-
2026-06-21days on market $260,000 Active 20 DOM
-
2026-06-18days on market $260,000 Active 17 DOM
-
2026-06-17days on market $260,000 Active 16 DOM
-
2026-06-16days on market $260,000 Active 15 DOM
-
2026-06-15days on market $260,000 Active 14 DOM
-
2026-06-13days on market $260,000 Active 12 DOM
-
2026-06-09days on market $260,000 Active 8 DOM
-
2026-06-08days on market $260,000 Active 7 DOM
-
2026-06-07days on market $260,000 Active 6 DOM
-
2026-06-04days on market $260,000 Active 3 DOM
-
2026-06-03days on market $260,000 Active 2 DOM
-
2026-06-02pricedays on market $260,000 Active 1 DOM
-
2026-06-01days on market $269,000 Active 32 DOM
-
2026-05-31days on market $269,000 Active 31 DOM
-
2026-04-30$269,000 Active 755-char remark
-
2017-03-30soldstatus
-
2017-03-30soldstatus
-
2017-03-29soldstatus Sold 397-char remark
Show marketing remark (397 chars)
Beautiful and well priced! Come take a look at this updated 3 bedroom home built in 2009. Well cared for by the original owners, this home boasts, fresh paint in the latest colors, beautiful tile, updated carpet, crown molding, stainless steel appliances and granite counters. It will be hard to find a comparable home at this price. Don't let this opportunity pass you by. Call to see it today.
-
2017-02-15status Pending 397-char remark
Show marketing remark (397 chars)
Beautiful and well priced! Come take a look at this updated 3 bedroom home built in 2009. Well cared for by the original owners, this home boasts, fresh paint in the latest colors, beautiful tile, updated carpet, crown molding, stainless steel appliances and granite counters. It will be hard to find a comparable home at this price. Don't let this opportunity pass you by. Call to see it today.
-
2017-02-02$169,800 Active 397-char remark
Show marketing remark (397 chars)
Beautiful and well priced! Come take a look at this updated 3 bedroom home built in 2009. Well cared for by the original owners, this home boasts, fresh paint in the latest colors, beautiful tile, updated carpet, crown molding, stainless steel appliances and granite counters. It will be hard to find a comparable home at this price. Don't let this opportunity pass you by. Call to see it today.
-
2010-03-12soldstatus
-
2010-02-08historical
-
2009-12-17$119,900
ⓘ Source: listings_history table (triggers on properties + properties_extension) + one-shot
backfill from property_details.listing_events for pre-trigger history.
Tax reassessment forecast TX · Resets to sale price
- Current annual tax
- $4,756 · $396/mo
- Projected year-2 tax
- $4,758 · $396/mo
- Expected delta
- +$2/yr ($0/mo · 0.0%)
ⓘ Screening estimate from a state-policy table — verify with the county assessor before closing.
Climate risk First Street
- Flood 1/10 Low FEMA zone X (unshaded) · 0% chance over 30 yrs
- Wildfire 3/10 Moderate
- Heat 8/10 Severe 7 d/yr ≥111°F today · 24 d/yr by 30 yrs out
- Wind 8/10 Severe 99% chance of damaging wind over 30 yrs
- Air quality 3/10 Moderate 2 unhealthy d/yr today · 3 by 30 yrs out
Nearby sold comps map
Loading sold comps map…
Walkable amenities ~0.75 mi
Loading nearby amenities…
Taxation est. · year 1
- Rental income
- $25,023
- − Mortgage interest
- −$14,564
- − Property taxes
- −$4,756
- − Insurance
- −$1,300
- − Repairs & maintenance
- −$2,002
- − Management
- −$2,002
- − Depreciation
- −$7,564
- Taxable loss
- −$7,165
- Est. tax savings @ 24.0%
- +$1,720
- After-tax cash flow
- $-930/yr
For passive investors: Depreciation is non-cash, so a rental often shows a tax loss while cash-flowing — sheltering income. Rental losses are passive: they offset passive income freely, and up to $25,000/yr can offset ordinary (W-2) income if you actively participate and your MAGI is under $100k (phasing out to $0 by $150k); unused losses carry forward. On sale, claimed depreciation is recaptured at up to 25%, and gains may owe capital-gains tax (a 1031 exchange can defer both). Figures are a year-1 estimate at your 24.0% rate — not tax advice; consult a CPA.
Schools (NCES district)
- District
- Conroe ISD
- NCES district ID
- 4815000
- Math proficiency
- 57% ▼ -6.00%
- Reading proficiency
- 57% ▼ -1.00%
- Median HH income
- $71,541
- Composite
- 50.65/100
- National rank
- #1833
- State rank
- #69 of 826 in TX
Livability — Oak Ridge North
- Score
- 84/100
- State rank
- #8
- US rank
- #708
Category grades
Schools grade is shown separately in the Schools card above.
Census & demographics
- County
- Montgomery County · 663,713 people
- Metro
- Houston-The Woodlands-Sugar Land, TX
- Population (ZIP)
- 28,156
- Household income
- $117,118
- Rent vs Own
- Severe rent burden
- 471.0
Population outlook (Montgomery County) Hauer SSP2
- Today (2025)
- 713,896 people
- By 2030
- 805,263 · +12.8%
- By 2040
- 992,708 · +39.1%
- By 2050
- 1,179,590 · +65.2%
- By 2075
- 1,628,084 · +128.1%
- By 2100
- 1,937,880 · +171.5%
Race, ethnicity, and origin ACS 2023
- Neighborhood character
- Diverse neighborhood (Simpson 0.63)
- Race & ethnicity
- White 53% Hispanic / Latino 27% Two or more races 16% Black 11% Asian 5%
- Hispanic origin (detail)
- Mexican 15% Puerto Rican 2% Cuban 1%
- Common ancestry
- Slovak 3% Romanian 2% Italian 2%
- Foreign-born
- 15% · Canada, Jamaica, Vietnam
- Languages at home
- 76% English-only · Spanish 16% Other Indo-European 2% Other Asian/Pacific 1%
Political lean MEDSL · Montgomery
- 2024 margin
- Solid R (+45.5) · D 26.8% · R 72.3%
- 2008→2024 swing
- +7.2pp toward D · 2008: -52.7pp · 2024: -45.5pp
- All cycles
- 2024: R+45.5 2020: R+43.8 2016: R+51.4 2012: R+60.7 2008: R+52.7
Not yet ingested
- Civics
- —
Market trends
- HPI YoY
- ▼ -91.09%
- Current HPI
- 239.9434
- Rent YoY
- ▲ 3.88%
- Metro
- Houston-The Woodlands-Sugar Land, TX
- State GDP YoY
- ▲ 3.95%
- F500 in state
- 110
Industry mix (Fortune 500 HQ in TX)
| Industry | F500 HQs | Revenue |
|---|---|---|
| Energy | 16 | $1,198B |
|
||
| Technology | 5 | $198B |
|
||
| Engineering / Construction | 4 | $72B |
|
||
| Energy Services | 3 | $60B |
|
||
| Utilities | 3 | $41B |
|
||
| Healthcare | 2 | $330B |
|
||
Price history
+116.8% since first listed11 events — show timeline
- 2026-06-01 Listing Removed — HARMLS
- 2026-06-01 Listed $260,000 HARMLS
- 2026-04-30 Listed $269,000 HARMLS
- 2017-03-30 Sold (Public Records) — Public Records
- 2017-03-30 Sold (Public Records) — Public Records
- 2017-03-29 Sold (MLS) — HARMLS
- 2017-02-15 Pending — HARMLS
- 2017-02-02 Listed $169,800 HARMLS
- 2010-03-12 Sold (MLS) — HARMLS
- 2010-02-08 Listing Removed — HARMLS
- 2009-12-17 Listed $119,900 HARMLS
Property tax history
+33.8%/yrLatest (2025): $4,756 · +5.9% YoY. Source: county tax records.
Cash-flow waterfall
monthlySold comps — $/sqft
last 12 mo · ≤1 miLoading sold comps…