108 S Church St · Kenansville, NC
Flood risk 1/10 · Minimal
- FEMA flood zone
- X (unshaded)
- Chance of flooding over 30 yrs
- 0.0%
- Est. flood insurance / yr
- $507 – $1,088
Fire risk 4/10 · Minor
- Est. fire insurance / yr
- $906 – $1,684
Heat risk 7/10 · Major
- Hot days now (above 107°F)
- 7 days/yr
- Hot days in 30 yrs
- 17 days/yr
Wind risk 8/10 · Major
- Chance of severe wind over 30 yrs
- 80.0%
Air-quality risk 1/10 · Minimal
- Unhealthy air days now
- 0 days/yr
- Unhealthy air days in 30 yrs
- 0 days/yr
Risk factors via First Street. Map © Google.
Why this score? — see what drove the C+ grade
The composite is a weighted blend of 9 inputs, each scored 0–100. Each bar is that input's sub-score; the figure is the points it added to the 100-point composite (weight × sub-score).
- Cash flow +20.3/30.0
- ARV discount +15.0/15.0
- DSCR +6.5/10.0
- Appreciation +5.7/10.0
- 1% rule +5.4/10.0
- Livability +3.5/5.0
- Condition / age +2.8/5.0
- Rent growth +2.5/5.0
- Schools +2.3/10.0
$169,900
🖨 Deal sheet 📄 Offer letter ✓ Due diligence
Listing remarks
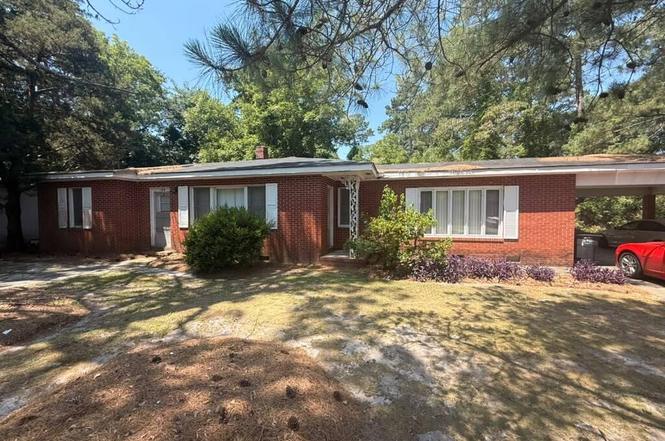
This classic brick ranch is full of potential and ready for its next chapter. Offering a solid foundation and timeless appeal, this home presents an excellent opportunity for buyers looking to add their own style and personal touches. With a functional layout and spacious living areas, a little updating will transform this property into the home of your dreams. Whether you're a first-time buyer eager to build equity or an investor searching for your next project, this home is the perfect canvas to bring your vision to life. Don't miss the chance to make this brick ranch truly your own.
Key facts
- 0.84 acre lot
- 2 parking spots
- Built 1957
Property features AI
Finance
- HOA & community: No association; Not a senior community
Exterior
- Parking: Covered 2-space carport; Driveway parking
- Utilities: Public water; Public sewer
- Home design: Single-story house
- Construction: Brick construction; Built as a house
- Exterior features: Shingle roof; Public maintained paved road access; Lot approximately 0.84 acre
Interior
- Bedrooms: 3 bedrooms (all on the main level)
- Flooring: Carpet
- Bathrooms: 2 full bathrooms
- Heating & cooling: No heating system specified; Central air conditioning
- Interior features: Carpet flooring
Neighborhood map
What this means for you Summary
Snapshot
- This is a 3-bed/2.0-bath single-family listed at $170k. Condition is rated average.
Deal economics
- At list price, monthly cash flow is $218 ($3k/yr) — positive.
- The deal already cash-flows at list — no discount required.
- Meets the 1% rule at list price ($2k rent vs $170k).
Location & tenants
- Location reads 69/100 on livability (#165 in NC) — a middle-class / working-renter tenant base. Strengths: cost of living A+, health & safety A+; Watch: schools C-, crime C-, employment D.
- Duplin County Schools (rural): math 23% / reading 32% proficiency, ranked #153 of 178 in NC (top 86%) — low school quality limits family demand, transient renter base, plan for 1-2y turnover; 74% free/reduced lunch — lower-income household profile, screen leases tightly.
- Market conditions: 17 active listings in the ZIP; 134 units permitted in Duplin County in 2024 (0 in 5+ unit buildings).
Forward outlook
- In year one you build about $3k of equity ($1k loan paydown + $2k appreciation (1.3% local appreciation)).
- Duplin County population projected at -16% by 2050 — secular population decline; favor cash flow + early exit over multi-decade hold.
- At projected returns (1.3% appreciation + 3.0% rent growth), your $48k cash investment doubles in ~7 years — after that, you're playing with house money.
- By year 9, paydown + projected appreciation supports a ~$31k cash-out refi (75% LTV) — recoverable capital for the next deal without selling this one.
Negotiation context
- Only 4 days on market — expect competitive offers; lowballing is unlikely to land.
Risks & watch-outs
- Watch-outs: built in 1957 — expect roof / HVAC / electrical / plumbing capex.
- Climate carrying-cost: severe wind risk, 80% chance of damaging wind over 30y; extreme-heat days projected 7→17/yr by 2055 (HVAC capex compounding) — expect insurance premiums to compound above CPI over the hold.
Questions for the listing agent
- Built in 1957 — when were the roof, HVAC, electrical panel, plumbing, and water heater last replaced?
- Is there a deadline driving the sale (1031 exchange, divorce, estate, relocation)? That informs how much negotiation room exists.
- What's the average days-on-market for RENTAL listings here right now (not sales)? A rising rental-DOM trend means longer vacancies and softer asking-rent achievability than the comps imply.
- What's the recent tenant-quality profile in this submarket — average credit score on applications, eviction rate, late-payment / NSF rate, and stable-employment percentage? A property-management company in the area should have these aggregated.
- How much new for-sale + rental construction is in the pipeline within 1–3 miles? Heavy new supply typically softens prices + rents 12–24 months out; constrained supply supports both.
Investment metrics
- 1% rule
- 1.04% ✓
- Cap rate
- 7.84%
- Cash-on-cash
- 5.51%
- DSCR
- 1.25
- GRM
- 8.0
CMA / ARV
- ARV (on-the-fly)
- $242,328
- Comps found
- 1
Show comp detail 1 sale within ~0.75 mi
| Address | Dist | Beds/Ba | Sqft | Sold | Price | $/sf | Match |
|---|---|---|---|---|---|---|---|
| 531 Seminary St | 0.20mi | 4/3.0 (+1) | 1,700 (-3%) | 14mo | $235,000 | $138 | 65 |
Match score weights: distance 35% · size 25% · config 20% · recency 20%. Top-matched comps best support the ARV.
Projected returns pro-forma
1.34% appreciation · 3.0% rent growth · sell at horizon
- IRR
- 8.1%
- Equity multiple
- 1.42×
- Total profit
- $20,000
- Equity at exit
- $61,066
- IRR
- 11.8%
- Equity multiple
- 2.49×
- Total profit
- $70,946
- Equity at exit
- $83,575
Cash invested: $47,572 (down + closing). Projections, not guarantees.
Landlord ↔ Tenant lean methodology
- Overall (STATE)
- 85 Strongly Landlord-Friendly
- State North Carolina
- 85 Strongly Landlord-Friendly · R+3
- County
- — inherits STATE
- City
- — inherits STATE
ZIP-level market 28349
- Home prices YoY
- 0.6%
- Active inventory
- 17
- Price-to-rent
- 8.0×
Monthly cashflow live
- Estimated rent
- $1,763 medium interval (Pro) →
- Mortgage (P&I)
- −$891
- Tax est. 1.5%
- −$212 /mo · $2,548/yr
- Insurance
- −$71
- HOA
- −$0
- Vacancy / Maint / Mgmt
- −$370
- Net cashflow
- $218
Break-even live
UW: 25.0% down · 7.5% · 30yr · 1.5% tax · 5.0% vac · 8.0% maint · 8.0% mgmt
Financing live
Cash to close
- Down payment
- $42,475
- Closing costs
- $5,097
- Reserves months
- —
- Total cash needed
- —
Loan-product check · same deal, 3 products live
Conventional
25% down · 7.5% · 30yr
- Down + closing
- —
- Monthly P&I
- —
- Monthly cashflow
- —
- DSCR
- —
- Eligible?
- —
Personal DTI + credit; lowest rate.
DSCR
20% down · 8.5% · 30yr
- Down + closing
- —
- Monthly P&I
- —
- Monthly cashflow
- —
- DSCR
- —
- Eligible?
- —
No personal income docs; deal must DSCR.
Hard money
10% down · 12.0% · 12mo
- Down + closing
- —
- Monthly P&I
- —
- Monthly cashflow
- —
- DSCR
- —
- Eligible?
- —
Short-term bridge; refi at stabilization.
Listing history 5 events
-
2026-06-19days on market $169,900 Active 4 DOM
-
2026-06-18days on market $169,900 Active 3 DOM
-
2026-06-17days on market $169,900 Active 2 DOM
-
2026-06-15remarks 592-char remark
-
2026-06-15$169,900 Active 1 DOM
ⓘ Source: listings_history table (triggers on properties + properties_extension) + one-shot
backfill from property_details.listing_events for pre-trigger history.
Climate risk First Street
- Flood 1/10 Low FEMA zone X (unshaded) · 0% chance over 30 yrs
- Wildfire 4/10 Moderate
- Heat 7/10 Severe 7 d/yr ≥107°F today · 17 d/yr by 30 yrs out
- Wind 8/10 Severe 80% chance of damaging wind over 30 yrs
- Air quality 1/10 Low 0 unhealthy d/yr today · 0 by 30 yrs out
Nearby sold comps map
Loading sold comps map…
Walkable amenities ~0.75 mi
Loading nearby amenities…
Taxation est. · year 1
- Rental income
- $21,154
- − Mortgage interest
- −$9,517
- − Property taxes
- −$2,548
- − Insurance
- −$850
- − Repairs & maintenance
- −$1,692
- − Management
- −$1,692
- − Depreciation
- −$4,943
- Taxable loss
- −$88
- Est. tax savings @ 24.0%
- +$21
- After-tax cash flow
- $2,643/yr
For passive investors: Depreciation is non-cash, so a rental often shows a tax loss while cash-flowing — sheltering income. Rental losses are passive: they offset passive income freely, and up to $25,000/yr can offset ordinary (W-2) income if you actively participate and your MAGI is under $100k (phasing out to $0 by $150k); unused losses carry forward. On sale, claimed depreciation is recaptured at up to 25%, and gains may owe capital-gains tax (a 1031 exchange can defer both). Figures are a year-1 estimate at your 24.0% rate — not tax advice; consult a CPA.
Condition & rehab AI · 12 photos
This classic brick ranch requires moderate updates to its interior and exterior to enhance its resale and rental value.
Repairs flagged
- Moderate kitchen cabinets — Worn and dated
- Moderate bathroom fixtures — Dated and worn
- Moderate paint — Worn and outdated
- Moderate flooring — Worn and dated carpet
Value-add opportunities
- Both Painting and updating interior walls — Enhances curb appeal and interior aesthetics
- Both Replacing kitchen cabinets and appliances — Modernizes the kitchen and increases functionality
- Both Upgrading bathroom fixtures and decor — Enhances bathroom functionality and aesthetics
- Both Replacing carpet with hardwood or tile flooring — Improves living area aesthetics and functionality
Renovation cost estimate screening
| Repair item | Severity | Est. cost |
|---|---|---|
| kitchen cabinets · Worn and dated | Moderate | $3,000–15,000 |
| bathroom fixtures · Dated and worn | Moderate | $3,000–15,000 |
| paint · Worn and outdated | Moderate | $3,000–15,000 |
| flooring · Worn and dated carpet | Moderate | $3,000–15,000 |
| Total estimated repair cost · 4 items | $12,000–60,000 |
Value-add ROI direction
- Both Painting and updating interior walls — Enhances curb appeal and interior aesthetics ↑
- Both Replacing kitchen cabinets and appliances — Modernizes the kitchen and increases functionality ↑
- Both Upgrading bathroom fixtures and decor — Enhances bathroom functionality and aesthetics ↑
- Both Replacing carpet with hardwood or tile flooring — Improves living area aesthetics and functionality ↑
ⓘ Cost ranges are severity-bucket heuristics (US national rule-of-thumb). Get contractor quotes + a written scope before underwriting a rehab budget.
Schools (NCES district)
- District
- Duplin County Schools
- NCES district ID
- 3701200
- Math proficiency
- 23% ▼ -5.00%
- Reading proficiency
- 32% ▼ -1.00%
- Median HH income
- $34,900
- Composite
- 22.66/100
- National rank
- #8052
- State rank
- #153 of 178 in NC
Livability — Kenansville
- Score
- 69/100
- State rank
- #165
- US rank
- #8881
Category grades
Schools grade is shown separately in the Schools card above.
Census & demographics
- Census place
- Kenansville, NC
- Population (ZIP)
- 3,852
Population outlook (Duplin County) Hauer SSP2
- Today (2025)
- 57,701 people
- By 2030
- 56,333 · -2.4%
- By 2040
- 52,736 · -8.6%
- By 2050
- 48,426 · -16.1%
- By 2075
- 36,339 · -37.0%
- By 2100
- 23,866 · -58.6%
Race, ethnicity, and origin ACS 2023
- Neighborhood character
- Diverse neighborhood (Simpson 0.57)
- Race & ethnicity
- White 58% Black 28% Hispanic / Latino 9% Asian 3% Two or more races 1%
- Hispanic origin (detail)
- Mexican 6%
- Common ancestry
- Italian 3% Slovak 2% Lithuanian 2%
- Foreign-born
- 5% · Canada, Vietnam
- Languages at home
- 88% English-only · Spanish 7% Arabic 2% Other Indo-European 2%
Political lean MEDSL · Duplin
- 2024 margin
- Strong R (+28.9) · D 35.2% · R 64.2%
- 2008→2024 swing
- -19.5pp toward R · 2008: -9.4pp · 2024: -28.9pp
- All cycles
- 2024: R+28.9 2020: R+22.1 2016: R+19.2 2012: R+11.8 2008: R+9.4
Not yet ingested
- Civics
- —
Market trends
- HPI YoY
- ▲ 1.34%
- Current HPI
- 235.6282
- Rent YoY
- —
- Metro
- —
- State GDP YoY
- ▲ 3.28%
- F500 in state
- 26
Industry mix (Fortune 500 HQ in NC)
| Industry | F500 HQs | Revenue |
|---|---|---|
| Financial Services | 2 | $213B |
|
||
| Retail | 2 | $95B |
|
||
| Industrial Conglomerate | 1 | $38B |
|
||
| Metals / Steel | 1 | $35B |
|
||
| Utilities | 1 | $30B |
|
||
| Industrial Machinery | 1 | $19B |
|
||
Price history
1 event — show timeline
- 2026-06-15 Listed $169,900 TMLS
Cash-flow waterfall
monthlySold comps — $/sqft
last 12 mo · ≤1 miLoading sold comps…