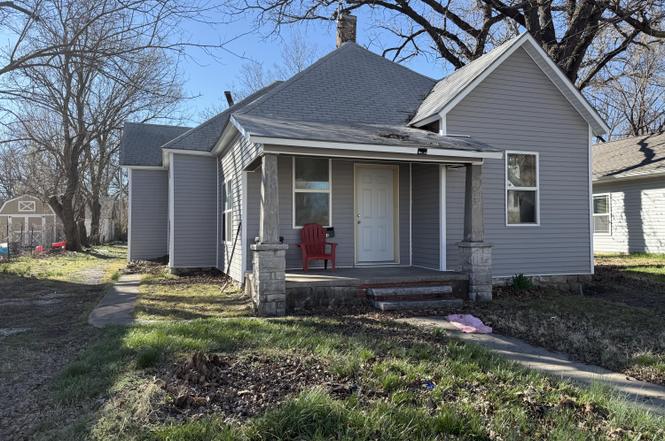
1616 S Wall Ave · Joplin, MO
Flood risk 1/10 · Minimal
- FEMA flood zone
- X (unshaded)
- Chance of flooding over 30 yrs
- 0.0%
- Est. flood insurance / yr
- $507 – $1,088
Fire risk 1/10 · Minimal
- Est. fire insurance / yr
- $1,054 – $1,958
Heat risk 5/10 · Moderate
- Hot days now (above 106°F)
- 7 days/yr
- Hot days in 30 yrs
- 20 days/yr
Wind risk 2/10 · Minimal
- Chance of severe wind over 30 yrs
- 2.0%
Air-quality risk 2/10 · Minimal
- Unhealthy air days now
- 1 days/yr
- Unhealthy air days in 30 yrs
- 1 days/yr
Risk factors via First Street. Map © Google.
Why this score? — see what drove the B- grade
The composite is a weighted blend of 9 inputs, each scored 0–100. Each bar is that input's sub-score; the figure is the points it added to the 100-point composite (weight × sub-score).
- Cash flow +30.0/30.0
- DSCR +10.0/10.0
- 1% rule +8.6/10.0
- ARV discount +7.5/15.0
- Rent growth +5.0/5.0
- Livability +3.2/5.0
- Schools +2.9/10.0
- Condition / age +2.5/5.0
- Appreciation +0.0/10.0
$100,000
🖨 Deal sheet (PDF) 📄 Offer letter ✓ Due diligence
Listing remarks
Unlock incredible value with this 90% renovated gem. The heavy lifting is done and all major systems are brand new leaving just the final finishing touches for you to customize and call your own. Sold ''As-Is, '' this is the perfect opportunity to walk into equity and a ''like-new'' home without the new-construction price tag. Why worry about maintenance when the entire backbone of the home is new? Brand-new HVAC, Plumbing, Electrical, and Windows ensure years of worry-free living. New siding provides instant curb appeal and enhanced durability. Walk into a grand space defined by soaring 10-foot ceilings and stylish, durable new Luxury Vinyl Plank floors throughout. 3 Bedrooms, 1.5 Baths an
Key facts
- Brand new plumbing
- New siding
- 90% renovated
Tags
Property features AI
Exterior
- Parking: Driveway
- Utilities: Public water; Public sewer
- Home design: Single-family residential home; One story
- Construction: Vinyl siding construction
- Exterior features: Covered front porch; Asphalt road frontage on a city street; Publicly maintained road
Interior
- Bathrooms: 1 full bathroom; 1 half bathroom
- Heating & cooling: Central heating; Electric heating; Heat pump; Central air conditioning
- Interior features: High ceilings; Insulated, double-pane windows
Neighborhood map
What this means for you Summary
Snapshot
- This is a 3-bed/1.5-bath other listed at $100k.
Deal economics
- At list price, monthly cash flow is $387 ($5k/yr) — positive.
- The deal already cash-flows at list — no discount required.
- Meets the 1% rule at list price ($1k rent vs $100k).
- Recommended offer: $91k (9.0% below list) — sets the bar for market timing.
- Cap rate 10.9% vs local median 5.1% in Joplin — top-decile yield for the area; either an underpriced asset or a hidden risk that comps aren't pricing in. Stress-test before assuming the spread holds.
Location & tenants
- Location reads 64/100 on livability (#318 in MO) — a middle-class / working-renter tenant base. Strengths: cost of living A+, housing A+; Watch: crime F, amenities F, commute F.
- Joplin Schools (urban): math 30% / reading 39% proficiency, ranked #231 of 324 in MO (top 71%) — families likely to look elsewhere, expect single-tenant / working-renter base with shorter leases.
- Zoned schools: Cecil Floyd Elem. (math 28% / reading 33%, grade F, #806 of 1,115 statewide, top 72%, 497 students, 66% FRL); North Middle (math 26% / reading 35%, grade F, #283 of 391 statewide, top 74%, 517 students, 65% FRL); Joplin High (math 32% / reading 46%, grade F, #287 of 521 statewide, top 55%, 2,233 students, 50% FRL).
- Market conditions: Rents rising fast (+15.7%/yr); 355 active listings in the ZIP; 22 comparable units currently listed for rent nearby; rentals at typical pace (median 23d on market — plan ~3-4 weeks tenant-placement turnaround); 602 units permitted in Jasper County in 2024 (0 in 5+ unit buildings).
Forward outlook
- Local home prices are declining (-3.0%/yr); year-one equity from $691 of loan paydown is wiped out by about $3k of value loss. Plan a longer hold.
- At projected returns (-3.0% appreciation + 8.0% rent growth), your $28k cash investment doubles in ~6 years — after that, you're playing with house money.
Negotiation context
- It's been on market 101 days — a 9% lower offer ($91k) is reasonable based on typical stale-listing flexibility.
Risks & watch-outs
- Watch-outs: built in 1930 — expect roof / HVAC / electrical / plumbing capex.
- Climate carrying-cost: extreme-heat days projected 7→20/yr by 2055 (HVAC capex compounding) — expect insurance premiums to compound above CPI over the hold.
Questions for the listing agent
- It's been on market 101 days. Have you received any prior offers? Is the seller open to a 9% concession, seller financing, or rate buy-down credit?
- Built in 1930 — when were the roof, HVAC, electrical panel, plumbing, and water heater last replaced?
- Why hasn't it sold? Are there any deal-killer items the seller is aware of (foundation, flood, title, zoning, code violations)?
- Is there a deadline driving the sale (1031 exchange, divorce, estate, relocation)? That informs how much negotiation room exists.
- Schools are D-rated, which usually means shorter tenancies and higher turnover. Who's the typical renter profile here, and what's been the actual vacancy rate?
- Crime grade is F in this area — have there been break-ins, vandalism, or insurance claims at this property in the last 3 years? What carrier currently insures it and at what premium?
- What's the average days-on-market for RENTAL listings here right now (not sales)? A rising rental-DOM trend means longer vacancies and softer asking-rent achievability than the comps imply.
- What's the recent tenant-quality profile in this submarket — average credit score on applications, eviction rate, late-payment / NSF rate, and stable-employment percentage? A property-management company in the area should have these aggregated.
- How much new for-sale + rental construction is in the pipeline within 1–3 miles? Heavy new supply typically softens prices + rents 12–24 months out; constrained supply supports both.
Investment metrics
- 1% rule
- 1.36% ✓
- Cap rate
- 10.93%
- Cash-on-cash
- 16.58%
- DSCR
- 1.74
- GRM
- 6.1
CMA / ARV
No comps found within radius.
Projected returns pro-forma
-3.0% appreciation · 8.0% rent growth · sell at horizon
- IRR
- 13.2%
- Equity multiple
- 1.56×
- Total profit
- $15,662
- Equity at exit
- $14,910
- IRR
- 25.7%
- Equity multiple
- 3.80×
- Total profit
- $78,262
- Equity at exit
- $8,646
Cash invested: $28,000 (down + closing). Projections, not guarantees.
Landlord ↔ Tenant lean methodology
- Overall (STATE)
- 81 Strongly Landlord-Friendly
- State Missouri
- 81 Strongly Landlord-Friendly · R+10
- County
- — inherits STATE
- City
- — inherits STATE
ZIP-level market 64804
- Rents YoY
- 15.7%
- Active inventory
- 355
- Price-to-rent
- 6.1×
Monthly cashflow live
- Estimated rent
- $1,364 high interval (Pro) →
- Mortgage (P&I)
- −$524
- Tax est. 1.5%
- −$125 /mo · $1,500/yr
- Insurance
- −$42
- HOA
- −$0
- Vacancy / Maint / Mgmt
- −$287
- Net cashflow
- $387
Break-even live
Sensitivity live
| Price | -10% $456 | -5% $421 | +0% $387 | +5% $352 | +10% $318 |
|---|---|---|---|---|---|
| Rent | -10% $279 | -5% $333 | +0% $387 | +5% $441 | +10% $495 |
| Rate | -1.0pp $437 | -0.5pp $412 | base $387 | +0.5pp $361 | +1.0pp $335 |
UW: 25.0% down · 7.5% · 30yr · 1.5% tax · 5.0% vac · 8.0% maint · 8.0% mgmt
Financing live
Cash to close
- Down payment
- $25,000
- Closing costs
- $3,000
- Reserves months
- —
- Total cash needed
- —
Loan-product check · same deal, 3 products live
Conventional
25% down · 7.5% · 30yr
- Down + closing
- —
- Monthly P&I
- —
- Monthly cashflow
- —
- DSCR
- —
- Eligible?
- —
Personal DTI + credit; lowest rate.
DSCR
20% down · 8.5% · 30yr
- Down + closing
- —
- Monthly P&I
- —
- Monthly cashflow
- —
- DSCR
- —
- Eligible?
- —
No personal income docs; deal must DSCR.
Hard money
10% down · 12.0% · 12mo
- Down + closing
- —
- Monthly P&I
- —
- Monthly cashflow
- —
- DSCR
- —
- Eligible?
- —
Short-term bridge; refi at stabilization.
Rent comps 22 comps
| Address | Beds | Baths | Sqft | Rent | $/sqft | DOM | Units | Dist |
|---|---|---|---|---|---|---|---|---|
| 1806 Pennsylvania Ave Joplin, MO | 3.0 | 1.0 | 1295 | $1,050 | $0.81 | 22d | 1 | 0.27mi |
| 623 W Junge Blvd Joplin, MO | 3.0 | 2.0 | 1217 | $1,500 | $1.23 | 22d | 1 | 0.35mi |
| 2010 S Moffet Ave Joplin, MO | 2.0 | 1.0 | 1000 | $950 | $0.95 | 22d | 1 | 0.40mi |
| 2201 S Pearl Ave Joplin, MO | 3.0 | 2.0 | 1487 | $1,475 | $0.99 | 22d | 1 | 0.49mi |
| 2012 S Connor Ave Joplin, MO | 3.0 | 2.0 | 1379 | $1,595 | $1.16 | 22d | 1 | 0.53mi |
| 2226 S Moffet Ave Joplin, MO | 4.0 | 2.0 | 1818 | $1,600 | $0.88 | 22d | 1 | 0.58mi |
| 1907 S Picher Ave Joplin, MO | 2.0 | 1.0 | 1032 | $900 | $0.87 | 22d | 1 | 0.62mi |
| 1715 Wisconsin Ave #2 Joplin, MO | 2.0 | 2.0 | 1000 | $900 | $0.90 | 22d | 1 | 0.80mi |
| 524 S Moffet Ave Joplin, MO | 3.0 | 1.0 | 900 | $855 | $0.95 | 22d | 1 | 0.85mi |
| 2602 S Moffet Ave Joplin, MO | 3.0 | 2.0 | 1214 | $1,300 | $1.07 | 22d | 1 | 0.86mi |
| 2517 Ohio Ave Joplin, MO | 3.0 | 2.0 | 1503 | $1,695 | $1.13 | 22d | 1 | 0.97mi |
| 2830 S Pearl Ave Joplin, MO | 2.0 | 2.0 | 1000 | $1,200 | $1.20 | 22d | 1 | 1.05mi |
| 120 /122 S Pearl Ave #122 Joplin, MO | 3.0 | 2.0 | 1200 | $1,250 | $1.04 | 22d | 1 | 1.11mi |
| 101 N Main Street Rd Unit 1806 Joplin, MO | 3.0 | 2.0 | 1386 | $1,300 | $0.94 | 22d | 1 | 1.18mi |
| 1119 S Saint Louis Ave Joplin, MO | 2.0 | 1.5 | 904 | $1,100 | $1.22 | 22d | 1 | 1.20mi |
| 211 S Galena Ave Joplin, MO | 3.0 | 2.0 | 1200 | $1,550 | $1.29 | 22d | 1 | 1.26mi |
| 3117 S Wall Ave Joplin, MO | 2.0 | 1.0 | 944 | $1,095 | $1.16 | 22d | 1 | 1.27mi |
| 2002 W 11th St Joplin, MO | 3.0 | 1.0 | 1200 | $1,200 | $1.00 | 22d | 1 | 1.37mi |
| 2521 S Tyler Ave Joplin, MO | 3.0 | 2.0 | 1500 | $1,700 | $1.13 | 22d | 1 | 1.39mi |
| 306 N Connor Ave Joplin, MO | 2.0 | 1.0 | 1072 | $1,000 | $0.93 | 22d | 1 | 1.39mi |
| 1012 Central St Joplin, MO | 3.0 | 2.0 | 1100 | $1,395 | $1.27 | 22d | 1 | 1.40mi |
| 1013 Broadway St Joplin, MO | 3.0 | 1.0 | 917 | $995 | $1.09 | 22d | 1 | 1.47mi |
Listing history 24 events
-
2026-06-21pricedays on market $100,000 Active 101 DOM
-
2026-06-19days on market $112,000 Active 99 DOM
-
2026-06-18days on market $112,000 Active 98 DOM
-
2026-06-17days on market $112,000 Active 97 DOM
-
2026-06-16days on market $112,000 Active 96 DOM
-
2026-06-15days on market $112,000 Active 95 DOM
-
2026-06-14days on market $112,000 Active 93 DOM
-
2026-06-13days on market $112,000 Active 92 DOM
-
2026-06-10days on market $112,000 Active 90 DOM
-
2026-06-09days on market $112,000 Active 89 DOM
-
2026-06-08days on market $112,000 Active 88 DOM
-
2026-06-07days on market $112,000 Active 87 DOM
-
2026-06-05days on market $112,000 Active 84 DOM
-
2026-06-03days on market $112,000 Active 83 DOM
-
2026-06-02days on market $112,000 Active 82 DOM
-
2026-06-01days on market $112,000 Active 81 DOM
-
2026-05-31days on market $112,000 Active 80 DOM
-
2026-05-30days on market $112,000 Active 79 DOM
-
2026-05-13price $112,000
-
2026-03-26price $129,900
-
2026-03-12$145,000 Active
-
2025-08-13soldstatus
-
2016-02-05soldstatus
-
1998-07-02soldstatus
ⓘ Source: listings_history table (triggers on properties + properties_extension) + one-shot
backfill from property_details.listing_events for pre-trigger history.
Climate risk First Street
- Flood 1/10 Low FEMA zone X (unshaded) · 0% chance over 30 yrs
- Wildfire 1/10 Low
- Heat 5/10 Major 7 d/yr ≥106°F today · 20 d/yr by 30 yrs out
- Wind 2/10 Low 2% chance of damaging wind over 30 yrs
- Air quality 2/10 Low 1 unhealthy d/yr today · 1 by 30 yrs out
Nearby sold comps map
Loading sold comps map…
Walkable amenities ~0.75 mi
Loading nearby amenities…
Taxation est. · year 1
- Rental income
- $16,373
- − Mortgage interest
- −$5,602
- − Property taxes
- −$1,500
- − Insurance
- −$500
- − Repairs & maintenance
- −$1,310
- − Management
- −$1,310
- − Depreciation
- −$2,909
- Taxable income
- $3,243
- Est. tax owed @ 24.0%
- −$778
- After-tax cash flow
- $3,863/yr
For passive investors: Depreciation is non-cash, so a rental often shows a tax loss while cash-flowing — sheltering income. Rental losses are passive: they offset passive income freely, and up to $25,000/yr can offset ordinary (W-2) income if you actively participate and your MAGI is under $100k (phasing out to $0 by $150k); unused losses carry forward. On sale, claimed depreciation is recaptured at up to 25%, and gains may owe capital-gains tax (a 1031 exchange can defer both). Figures are a year-1 estimate at your 24.0% rate — not tax advice; consult a CPA.
Schools (NCES district)
- District
- Joplin Schools
- NCES district ID
- 2916350
- Math proficiency
- 30% ▼ -3.00%
- Reading proficiency
- 39% ▼ -3.00%
- Median HH income
- $38,648
- Composite
- 28.82/100
- National rank
- #6657
- State rank
- #231 of 324 in MO
Livability — Joplin
- Score
- 64/100
- State rank
- #318
- US rank
- #14578
Category grades
Schools grade is shown separately in the Schools card above.
Census & demographics
- Census place
- Joplin, MO
- County
- Newton County · 37,016 people
- City population
- 73,303
- Metro
- Joplin, MO
- Population (ZIP)
- 37,016
- Household income
- $62,574
- Rent vs Own
- Severe rent burden
- 1082.0
Population outlook (Jasper County) Hauer SSP2
- Today (2025)
- 120,033 people
- By 2030
- 120,091 · +0.0%
- By 2040
- 119,297 · -0.6%
- By 2050
- 117,705 · -1.9%
- By 2075
- 110,402 · -8.0%
- By 2100
- 99,719 · -16.9%
Race, ethnicity, and origin ACS 2023
- Neighborhood character
- Predominantly White (84%)
- Race & ethnicity
- White 84% Two or more races 9% Hispanic / Latino 6% Black 2% Asian 2%
- Hispanic origin (detail)
- Mexican 3%
- Common ancestry
- Slovak 3% Italian 2% Lithuanian 2%
- Foreign-born
- 3% · Canada, Vietnam
- Languages at home
- 96% English-only · Spanish 1% Other Indo-European 1% Vietnamese 1%
Political lean MEDSL · Jasper
- 2024 margin
- Solid R (+46.8) · D 25.9% · R 72.7% · Other 1.4%
- 2008→2024 swing
- -13.6pp toward R · 2008: -33.2pp · 2024: -46.8pp
- All cycles
- 2024: R+46.8 2020: R+46.2 2016: R+50.8 2012: R+41.0 2008: R+33.2
Not yet ingested
- Civics
- —
Market trends
- HPI YoY
- ▼ -204.80%
- Current HPI
- 279.4471
- Rent YoY
- ▲ 15.66%
- Metro
- Joplin, MO
- State GDP YoY
- ▲ 1.84%
- F500 in state
- 20
Industry mix (Fortune 500 HQ in MO)
| Industry | F500 HQs | Revenue |
|---|---|---|
| Healthcare | 1 | $163B |
|
||
| Insurance | 1 | $21B |
|
||
| Industrial Technology | 1 | $17B |
|
||
| Retail | 1 | $16B |
|
||
| Industrial Distribution | 1 | $10B |
|
||
| Utilities | 1 | $9B |
|
||
Price history
-22.8% since first listed6 events — show timeline
- 2026-05-13 Price Changed $112,000 SOMO
- 2026-03-26 Price Changed $129,900 SOMO
- 2026-03-12 Listed $145,000 SOMO
- 2025-08-13 Sold (Public Records) — Public Records
- 2016-02-05 Sold (Public Records) — Public Records
- 1998-07-02 Sold (Public Records) — Public Records
Property tax history
-3.9%/yrLatest (2025): $138 · +7.8% YoY. Source: county tax records.
Cash-flow waterfall
monthlySold comps — $/sqft
last 12 mo · ≤1 miLoading sold comps…