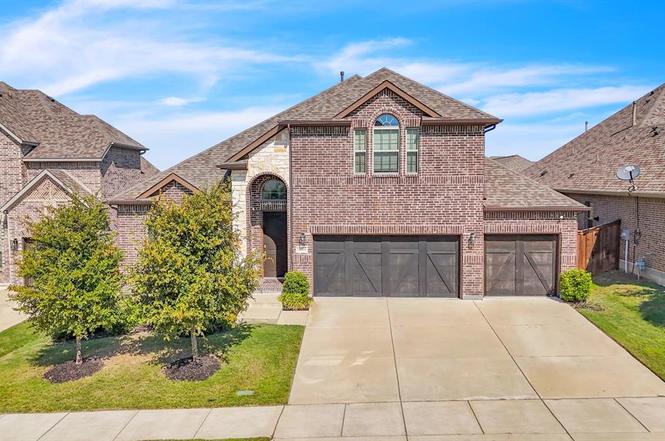
3522 Ridgecross Dr · Rockwall, TX
Flood risk 1/10 · Minimal
- FEMA flood zone
- X (unshaded)
- Chance of flooding over 30 yrs
- 0.0%
- Est. flood insurance / yr
- $507 – $1,088
Fire risk 6/10 · Moderate
- Est. fire insurance / yr
- $1,222 – $2,270
Heat risk 7/10 · Major
- Hot days now (above 109°F)
- 7 days/yr
- Hot days in 30 yrs
- 25 days/yr
Wind risk 6/10 · Moderate
- Chance of severe wind over 30 yrs
- 27.0%
Air-quality risk 3/10 · Minor
- Unhealthy air days now
- 2 days/yr
- Unhealthy air days in 30 yrs
- 3 days/yr
Risk factors via First Street. Map © Google.
Why this score? — see what drove the D grade
The composite is a weighted blend of 9 inputs, each scored 0–100. Each bar is that input's sub-score; the figure is the points it added to the 100-point composite (weight × sub-score).
- ARV discount +11.7/15.0
- Cash flow +8.5/30.0
- Schools +5.0/10.0
- Livability +3.9/5.0
- Rent growth +3.3/5.0
- 1% rule +2.9/10.0
- Condition / age +2.5/5.0
- DSCR +2.3/10.0
- Appreciation +0.0/10.0
$550,000
🖨 Deal sheet 📄 Offer letter ✓ Due diligence
Listing remarks
Spacious Chesmar home in the highly desirable Breezy Hill community. This 2889 sq ft home features a versatile floor plan with two bedrooms and two full baths downstairs, plus two additional bedrooms, a game room, and a media room upstairs. The open-concept layout centers around a spacious kitchen with a large island that flows seamlessly into the dining and living areas, making it ideal for everyday living and entertaining. One of the home’s standout features is its large backyard, offering plenty of room for kids, pets, outdoor entertaining, or even a future pool. The 3-car garage provides abundant space for vehicles, storage, hobbies, or a workshop area, adding flexibility that&rsq
Key facts
- Community pool
- Large backyard
- Covered pavilion
Tags
Property features AI
Finance
- Financial info: Listing accepts Cash, Conventional, FHA and VA financing
- HOA & community: Mandatory HOA (Breezy Hills Mgmt); Annual association fee; Association fee includes management fees; Community pool
Exterior
- Parking: Attached garage with 3 covered spaces; Oversized garage; Garage faces front; Garage door opener; Concrete driveway
- Utilities: City water; City sewer; Electricity available; Cable available; Underground utilities; Sidewalks and curbs
- Home design: Single-family residence; One and one-half story; Residential property in Breezy Hill subdivision; Built in 2020; Brick and siding exterior; Composition roof; Slab foundation
- Construction: Brick and siding construction; Composition roof; Slab foundation; Year built: 2020
- Exterior features: Covered porch; Covered patio; Gutters; Wood fencing; Large backyard with grass; Few trees; Landscaped yard; Sprinkler system; Subdivision location
Interior
- Kitchen: Dishwasher; Disposal; Gas cooktop; Microwave; Natural stone/granite countertops; Built-in cabinets; Breakfast bar; Water line to refrigerator
- Bedrooms: Primary bedroom on main level (15 x 15); Three additional bedrooms — two upstairs (15 x 10 and 11 x 11) and one on main level (13 x 12)
- Flooring: Carpet; Ceramic tile; Laminate
- Bathrooms: Three full bathrooms
- Heating & cooling: Central heating (natural gas); Central air (electric)
- Interior features: Open floorplan; Kitchen island; Double vanity; Walk-in closets; Decorative lighting; Cable TV available; High speed internet available; Window coverings
- Laundry & utility: Full-size washer/dryer area; Electric dryer hookup; Separate utility room with sink (10 x 5)
Neighborhood map
What this means for you Summary
Snapshot
- This is a 4-bed/3.0-bath single-family listed at $550k.
Deal economics
- At list price, monthly cash flow is $-478 ($-6k/yr) — negative.
- To cash-flow at today's rent, offer at most $466k (15.4% below list).
- To meet the 1% rule (rent ≥ 1% of price), the offer needs to be $432k (21.4% below list).
- Recommended offer: $432k (21.4% below list) — sets the bar for 1% rule.
- Cap rate 5.2% vs local median 2.9% in Rockwall — top-decile yield for the area; either an underpriced asset or a hidden risk that comps aren't pricing in. Stress-test before assuming the spread holds.
Location & tenants
- Location reads 77/100 on livability (#86 in TX, #3,043 nationally) — a middle-class / working-renter tenant base. Strengths: employment A+, housing A+, crime A-; Watch: amenities F, commute F.
- Rockwall ISD (suburban): math 54% / reading 54% proficiency, ranked #83 of 826 in TX (top 10%) — acceptable for families but not a draw, mixed tenant base, ~2y average lease.
- Zoned schools: Celia Hays El (math 62% / reading 59%, grade B-, #385 of 4,322 statewide, top 9%, 517 students, 11% FRL).
- Market conditions: Rents rising (+3.2%/yr); 1008 active listings in the ZIP; 11 comparable units currently listed for rent nearby; rentals at typical pace (median 24d on market — plan ~3-4 weeks tenant-placement turnaround); 45% of comp listings sitting > 30 days — soft ceiling on asking rent; high-income renter base; 1,810 units permitted in Rockwall County in 2024 (0 in 5+ unit buildings).
- This rent runs 40% of the median local income ($129k/yr) — at the standard rent-burdened threshold; future hikes will face affordability resistance.
Forward outlook
- Local home prices are declining (-3.0%/yr); year-one equity from $4k of loan paydown is wiped out by about $16k of value loss. Plan a longer hold.
- Rockwall County population projected at +56% by 2050 — long-run rental-demand tailwind backs the buy-and-hold thesis.
Negotiation context
- Only 1 days on market — expect competitive offers; lowballing is unlikely to land.
Risks & watch-outs
- Climate carrying-cost: major wind risk, 27% chance of damaging wind over 30y; major wildfire risk; extreme-heat days projected 7→25/yr by 2055 (HVAC capex compounding) — expect insurance premiums to compound above CPI over the hold.
Questions for the listing agent
- What do current leases actually rent for vs. the listed asking? Can we see a recent rent roll and the last 12 months of T-12 income?
- What does the HOA fee cover, when was the last increase, and are there any pending special assessments or reserve-fund shortfalls?
- Is there a deadline driving the sale (1031 exchange, divorce, estate, relocation)? That informs how much negotiation room exists.
- Schools are B-rated — typically a magnet for longer-tenancy family renters. What's the average tenant stay here, and is there a school-zone premium baked into asking?
- The area grade is low — what's the realistic commute time and amenity access for the typical tenant pool here? Any planned neighborhood developments (good or bad) we should know about?
- What's the average days-on-market for RENTAL listings here right now (not sales)? A rising rental-DOM trend means longer vacancies and softer asking-rent achievability than the comps imply.
- What's the recent tenant-quality profile in this submarket — average credit score on applications, eviction rate, late-payment / NSF rate, and stable-employment percentage? A property-management company in the area should have these aggregated.
- How much new for-sale + rental construction is in the pipeline within 1–3 miles? Heavy new supply typically softens prices + rents 12–24 months out; constrained supply supports both.
Investment metrics
- 1% rule
- 0.79% ✗
- Cap rate
- 5.25%
- Cash-on-cash
- -3.73%
- DSCR
- 0.83
- GRM
- 10.6
CMA / ARV
- ARV (on-the-fly)
- $605,982
- Comps found
- 12
Show comp detail 12 sales within ~0.75 mi
| Address | Dist | Beds/Ba | Sqft | Sold | Price | $/sf | Match |
|---|---|---|---|---|---|---|---|
| 1033 Fawn Trl | 0.27mi | 3/3.0 (-1) | 2,718 (-1%) | 3mo | $489,000 | $180 | 79 |
| 3530 Ridgecross Dr | 0.02mi | 4/3.0 | 2,353 (-14%) | 3mo | $495,000 | $210 | 73 |
| 3441 Ridgecross Dr | 0.10mi | 4/2.5 | 2,498 (-9%) | 7mo | $605,000 | $242 | 72 |
| 1015 Sable Dr | 0.63mi | 4/3.5 | 2,713 (-1%) | 4mo | $600,000 | $221 | 63 |
| 2438 Miranda Ln | 0.55mi | 4/3.0 | 2,929 (+7%) | 0mo | $699,000 | $239 | 63 |
| 914 Roys Dr | 0.50mi | 4/3.5 | 2,992 (+9%) | 1mo | $785,900 | $263 | 58 |
| 2417 Miranda Ln | 0.63mi | 3/2.5 (-1) | 2,710 (-1%) | 5mo | $549,999 | $203 | 58 |
| 1854 Costa Verde Dr | 0.58mi | 3/3.5 (-1) | 2,896 (+6%) | 6mo | $659,900 | $228 | 52 |
| 541 Petrel Dr | 0.74mi | 3/3.5 (-1) | 2,590 (-6%) | 1mo | $590,000 | $228 | 48 |
| 780 Mountcastle Dr | 0.61mi | 3/3.0 (-1) | 2,510 (-8%) | 6mo | $535,000 | $213 | 47 |
| 2316 Miranda Ln | 0.74mi | 4/4.0 | 2,963 (+8%) | 3mo | $599,300 | $202 | 45 |
| 3066 Stoney Hollow Ln | 0.68mi | 3/2.5 (-1) | 2,510 (-8%) | 3mo | $449,000 | $179 | 45 |
Match score weights: distance 35% · size 25% · config 20% · recency 20%. Top-matched comps best support the ARV.
Projected returns pro-forma
-3.0% appreciation · 3.23% rent growth · sell at horizon
- IRR
- -22.3%
- Equity multiple
- 0.23×
- Total profit
- $-118,455
- Equity at exit
- $82,007
- IRR
- -15.7%
- Equity multiple
- 0.11×
- Total profit
- $-137,737
- Equity at exit
- $47,554
Cash invested: $154,000 (down + closing). Projections, not guarantees.
Landlord ↔ Tenant lean methodology
- Overall (STATE)
- 87 Strongly Landlord-Friendly
- State Texas
- 87 Strongly Landlord-Friendly · R+5
- County
- — inherits STATE
- City
- — inherits STATE
ZIP-level market 75087
- Rents YoY
- 3.2%
- Active inventory
- 1008
- Price-to-rent
- 10.6×
Monthly cashflow live
- Estimated rent
- $4,323 high interval (Pro) →
- Mortgage (P&I)
- −$2,884
- Tax from tax record
- −$712 /mo · $8,540/yr
- Insurance
- −$229
- HOA
- −$68
- Vacancy / Maint / Mgmt
- −$908
- Net cashflow
- $-478
Break-even live
UW: 25.0% down · 7.5% · 30yr · 1.5% tax · 5.0% vac · 8.0% maint · 8.0% mgmt
Financing live
Cash to close
- Down payment
- $137,500
- Closing costs
- $16,500
- Reserves months
- —
- Total cash needed
- —
Loan-product check · same deal, 3 products live
Conventional
25% down · 7.5% · 30yr
- Down + closing
- —
- Monthly P&I
- —
- Monthly cashflow
- —
- DSCR
- —
- Eligible?
- —
Personal DTI + credit; lowest rate.
DSCR
20% down · 8.5% · 30yr
- Down + closing
- —
- Monthly P&I
- —
- Monthly cashflow
- —
- DSCR
- —
- Eligible?
- —
No personal income docs; deal must DSCR.
Hard money
10% down · 12.0% · 12mo
- Down + closing
- —
- Monthly P&I
- —
- Monthly cashflow
- —
- DSCR
- —
- Eligible?
- —
Short-term bridge; refi at stabilization.
Rent comps 11 comps
| Address | Beds | Baths | Sqft | Rent | $/sqft | DOM | Units | Dist |
|---|---|---|---|---|---|---|---|---|
| 3526 Ridgecross Dr Rockwall, TX | 5.0 | 4.5 | 3485 | $7,200 | $2.07 | 43d | 1 | 0.04mi |
| 3537 Ridgecross Dr Rockwall, TX | 4.0 | 3.5 | 3542 | $3,825 | $1.08 | 43d | 1 | 0.08mi |
| 586 Mountcastle Dr Rockwall, TX | 4.0 | 3.5 | 3087 | $3,950 | $1.28 | 43d | 1 | 0.64mi |
| 811 Knox Dr Rockwall, TX | 4.0 | 2.0 | 2180 | $2,850 | $1.31 | 4d | 1 | 0.68mi |
| 4602 Lorion Dr Rockwall, TX | 4.0 | 3.0 | 3144 | $4,100 | $1.30 | 24d | 1 | 0.69mi |
| 4602 Lorion Dr Rockwall, TX | 4.0 | 3.0 | 3144 | $4,100 | $1.30 | 43d | 1 | 0.69mi |
| 2750 Fern Valley Ln Rockwall, TX | 4.0 | 2.0 | 1923 | $2,400 | $1.25 | 18d | 1 | 1.14mi |
| 7132 Hunt Ln Unit 1019551P Rockwall, TX | 5.0 | 2.5 | 2906 | $15,524 | $5.34 | 20d | 1 | 1.18mi |
| 7132 Hunt Ln Rockwall, TX | 5.0 | 2.5 | 2910 | $8,750 | $3.01 | 43d | 1 | 1.18mi |
| 1468 Red Wolf Dr Rockwall, TX | 4.0 | 3.0 | 2835 | $2,999 | $1.06 | 5d | 1 | 1.34mi |
| 2223 Clairmount Dr Rockwall, TX | 5.0 | 4.0 | 3574 | $3,900 | $1.09 | 24d | 1 | 1.46mi |
HOA detail
- Monthly dues
- $68 · $816/yr
- Likely covers
- pool
Listing history 2 events
-
2026-06-18remarks 693-char remark
-
2026-06-18$550,000 Active 1 DOM
ⓘ Source: listings_history table (triggers on properties + properties_extension) + one-shot
backfill from property_details.listing_events for pre-trigger history.
Tax reassessment forecast TX · Resets to sale price
- Current annual tax
- $8,540 · $712/mo
- Projected year-2 tax
- $10,065 · $839/mo
- Expected delta
- +$1,525/yr (+$127/mo · 17.9%)
ⓘ Screening estimate from a state-policy table — verify with the county assessor before closing.
Climate risk First Street
- Flood 1/10 Low FEMA zone X (unshaded) · 0% chance over 30 yrs
- Wildfire 6/10 Major
- Heat 7/10 Severe 7 d/yr ≥109°F today · 25 d/yr by 30 yrs out
- Wind 6/10 Major 27% chance of damaging wind over 30 yrs
- Air quality 3/10 Moderate 2 unhealthy d/yr today · 3 by 30 yrs out
Nearby sold comps map
Loading sold comps map…
Walkable amenities ~0.75 mi
Loading nearby amenities…
Taxation est. · year 1
- Rental income
- $51,872
- − Mortgage interest
- −$30,809
- − Property taxes
- −$8,540
- − Insurance
- −$2,750
- − Repairs & maintenance
- −$4,150
- − Management
- −$4,150
- − HOA
- −$816
- − Depreciation
- −$16,000
- Taxable loss
- −$15,342
- Est. tax savings @ 24.0%
- +$3,682
- After-tax cash flow
- $-2,056/yr
For passive investors: Depreciation is non-cash, so a rental often shows a tax loss while cash-flowing — sheltering income. Rental losses are passive: they offset passive income freely, and up to $25,000/yr can offset ordinary (W-2) income if you actively participate and your MAGI is under $100k (phasing out to $0 by $150k); unused losses carry forward. On sale, claimed depreciation is recaptured at up to 25%, and gains may owe capital-gains tax (a 1031 exchange can defer both). Figures are a year-1 estimate at your 24.0% rate — not tax advice; consult a CPA.
Schools (NCES district)
- District
- Rockwall ISD
- NCES district ID
- 4837650
- Math proficiency
- 54% ▼ -13.00%
- Reading proficiency
- 54% ▼ -8.00%
- Median HH income
- $88,800
- Composite
- 49.82/100
- National rank
- #1952
- State rank
- #83 of 826 in TX
Livability — Rockwall
- Score
- 77/100
- State rank
- #86
- US rank
- #3043
Category grades
Schools grade is shown separately in the Schools card above.
Census & demographics
- Census place
- Rockwall, TX
- County
- Rockwall County · 132,930 people
- City population
- 84,191
- Metro
- Dallas-Fort Worth-Arlington, TX
- Population (ZIP)
- 44,326
- Household income
- $129,484
- Rent vs Own
- Severe rent burden
- 646.0
Population outlook (Rockwall County) Hauer SSP2
- Today (2025)
- 118,396 people
- By 2030
- 132,209 · +11.7%
- By 2040
- 159,538 · +34.7%
- By 2050
- 185,299 · +56.5%
- By 2075
- 243,489 · +105.7%
- By 2100
- 277,814 · +134.6%
Race, ethnicity, and origin ACS 2023
- Neighborhood character
- Predominantly White (69%)
- Race & ethnicity
- White 69% Hispanic / Latino 17% Two or more races 12% Black 7% Asian 4%
- Hispanic origin (detail)
- Mexican 12%
- Common ancestry
- Slovak 2% Italian 2% Iranian 2%
- Foreign-born
- 8% · Canada, Vietnam, South Korea
- Languages at home
- 88% English-only · Spanish 8% Other Indo-European 1% Vietnamese 1%
Political lean MEDSL · Rockwall
- 2024 margin
- Solid R (+40.9) · D 29.1% · R 70.0%
- 2008→2024 swing
- +5.3pp toward D · 2008: -46.2pp · 2024: -40.9pp
- All cycles
- 2024: R+40.9 2020: R+37.7 2016: R+47.5 2012: R+53.3 2008: R+46.2
Not yet ingested
- Civics
- —
Market trends
- HPI YoY
- ▼ -188.34%
- Current HPI
- 208.2221
- Rent YoY
- ▲ 3.23%
- Metro
- Dallas-Fort Worth-Arlington, TX
- State GDP YoY
- ▲ 3.95%
- F500 in state
- 110
Industry mix (Fortune 500 HQ in TX)
| Industry | F500 HQs | Revenue |
|---|---|---|
| Energy | 16 | $1,198B |
|
||
| Technology | 5 | $198B |
|
||
| Engineering / Construction | 4 | $72B |
|
||
| Energy Services | 3 | $60B |
|
||
| Utilities | 3 | $41B |
|
||
| Healthcare | 2 | $330B |
|
||
Price history
1 event — show timeline
- 2026-06-18 Listed $550,000 NTREIS
Property tax history
+42.1%/yrLatest (2025): $8,540 · +5.1% YoY. Source: county tax records.
Cash-flow waterfall
monthlySold comps — $/sqft
last 12 mo · ≤1 miLoading sold comps…