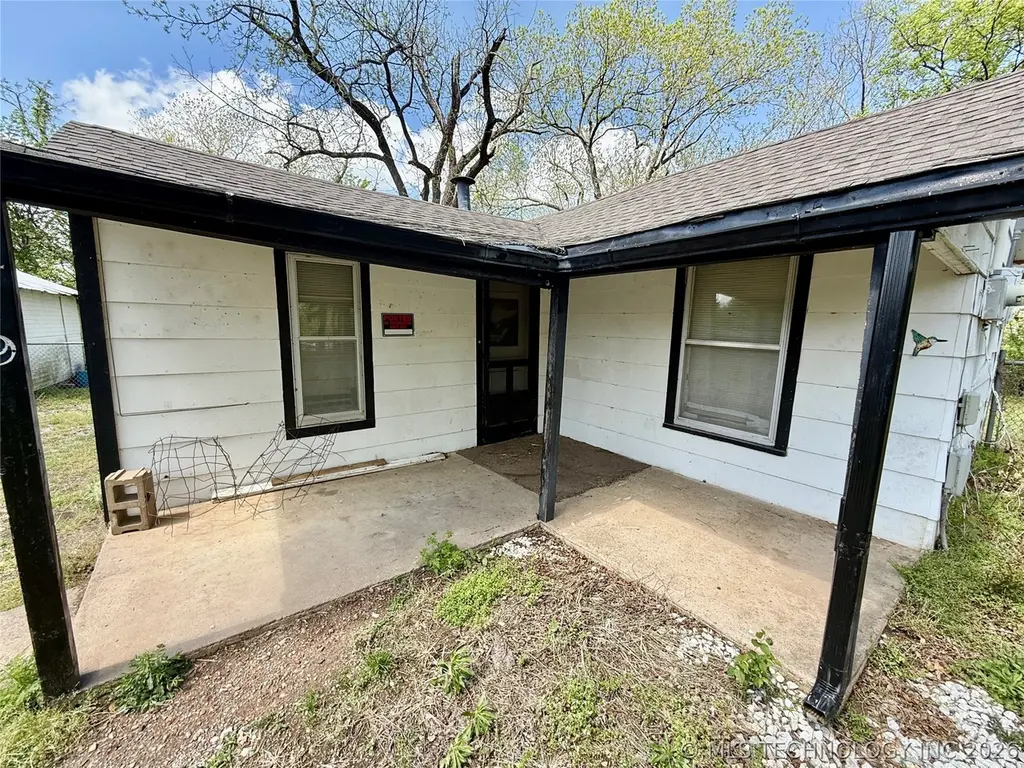
419 S Talihina · Salina, OK
Flood risk 1/10 · Minimal
- FEMA flood zone
- X (unshaded)
- Chance of flooding over 30 yrs
- 0.0%
- Est. flood insurance / yr
- $507 – $1,088
Fire risk 6/10 · Moderate
- Est. fire insurance / yr
- $2,463 – $4,575
Heat risk 6/10 · Moderate
- Hot days now (above 112°F)
- 7 days/yr
- Hot days in 30 yrs
- 20 days/yr
Wind risk 2/10 · Minimal
- Chance of severe wind over 30 yrs
- 4.0%
Air-quality risk 2/10 · Minimal
- Unhealthy air days now
- 1 days/yr
- Unhealthy air days in 30 yrs
- 2 days/yr
Risk factors via First Street. Map © Google.
Why this score? — see what drove the B+ grade
The composite is a weighted blend of 9 inputs, each scored 0–100. Each bar is that input's sub-score; the figure is the points it added to the 100-point composite (weight × sub-score).
- Cash flow +30.0/30.0
- 1% rule +10.0/10.0
- DSCR +10.0/10.0
- Appreciation +7.7/10.0
- ARV discount +7.5/15.0
- Livability +3.1/5.0
- Rent growth +2.5/5.0
- Condition / age +2.5/5.0
- Schools +1.7/10.0
$55,000
🖨 Deal sheet (PDF) 📄 Offer letter ✓ Due diligence
Listing remarks
Lurking inside this small home is a BIG opportunity for the right buyer! Situated on a generous 1-acre lot with winter views of Lake Hudson and 754 square feet (courthouse) of living space, this property is packed with potential. The home needs work to become livable, but your elbow grease, investment and vision could transform it into a relaxing retreat or standout investment property. Whether a buyer looking to create lake getaway or a savvy investor searching for your next project, this property might deliver the potential you’ve been seeking. Abutting GRDA land insures extra privacy and a natural setting to enhance the lake lifestyle. Relax and take in the peaceful surroundings, j
Key facts
- 1 acre lot
- Views of lake hudson
- 1 acre lot
Tags
Property features AI
Finance
- Other: Located less than 1 mile to Hudson Lake
- HOA & community: Association fee due annually
Exterior
- Parking: Detached garage with shelving (1 car)
- Security: No safety shelter
- Utilities: Public water; Septic sewer; Electricity available; Natural gas available; Cable available; Fiber optic available; Phone service available
- Home design: Single-story; Faces east; Crawlspace foundation
- Construction: Masonite and wood-frame construction; Asphalt/fiberglass roof; Built per public records
- Exterior features: Porch; Gravel driveway; Partial chain-link fence
Interior
- Kitchen: Eat-in kitchen; Oven; Range
- Bedrooms: Two first-floor bedrooms (no attached baths)
- Flooring: Carpet; Laminate
- Bathrooms: One full bathroom (hall bath with shower only)
- Heating & cooling: Gas heating; Window cooling unit(s)
- Interior features: Aluminum-framed windows; Laminate counters; Gas range/oven connections
- Laundry & utility: Utility room (inside, first floor); Washer hookup; Gas dryer hookup
Neighborhood map
What this means for you Summary
Snapshot
- This is a 1-bed/1.0-bath single-family listed at $55k.
Deal economics
- At list price, monthly cash flow is $657 ($8k/yr) — positive.
- The deal already cash-flows at list — no discount required.
- Meets the 1% rule at list price ($1k rent vs $55k).
- Recommended offer: $54k (1.5% below list) — sets the bar for market timing.
Location & tenants
- Location reads 61/100 on livability (#279 in OK) — a middle-class / working-renter tenant base. Strengths: cost of living A+, housing A+; Watch: crime C-, schools F, amenities F.
- Salina (rural): math 21% / reading 20% proficiency, ranked #173 of 270 in OK (top 64%) — low school quality limits family demand, transient renter base, plan for 1-2y turnover; 68% free/reduced lunch — lower-income household profile, screen leases tightly.
- Market conditions: 23 active listings in the ZIP; 1 comparable units currently listed for rent nearby; 23 units permitted in Mayes County in 2024 (0 in 5+ unit buildings).
Forward outlook
- In year one you build about $3k of equity ($380 loan paydown + $3k appreciation (5.5% local appreciation)).
- Mayes County population projected at -10% by 2050 — secular population decline; favor cash flow + early exit over multi-decade hold.
- At projected returns (5.5% appreciation + 3.0% rent growth), your $15k cash investment doubles in ~2 years — after that, you're playing with house money.
- By year 9, paydown + projected appreciation supports a ~$30k cash-out refi (75% LTV) — recoverable capital for the next deal without selling this one.
Negotiation context
- It's been on market 28 days — a 2% lower offer ($54k) is reasonable based on typical stale-listing flexibility.
- Current owner paid $30k; list at $55k implies a 83% gain — meaningful room to come down on a strong offer.
Risks & watch-outs
- Watch-outs: built in 1940 — expect roof / HVAC / electrical / plumbing capex.
- Climate carrying-cost: major wildfire risk; extreme-heat days projected 7→20/yr by 2055 (HVAC capex compounding) — expect insurance premiums to compound above CPI over the hold.
Questions for the listing agent
- Built in 1940 — when were the roof, HVAC, electrical panel, plumbing, and water heater last replaced?
- Is there a deadline driving the sale (1031 exchange, divorce, estate, relocation)? That informs how much negotiation room exists.
- Schools are F-rated, which usually means shorter tenancies and higher turnover. Who's the typical renter profile here, and what's been the actual vacancy rate?
- What's the average days-on-market for RENTAL listings here right now (not sales)? A rising rental-DOM trend means longer vacancies and softer asking-rent achievability than the comps imply.
- What's the recent tenant-quality profile in this submarket — average credit score on applications, eviction rate, late-payment / NSF rate, and stable-employment percentage? A property-management company in the area should have these aggregated.
- How much new for-sale + rental construction is in the pipeline within 1–3 miles? Heavy new supply typically softens prices + rents 12–24 months out; constrained supply supports both.
Investment metrics
- 1% rule
- 2.27% ✓
- Cap rate
- 20.63%
- Cash-on-cash
- 51.21%
- DSCR
- 3.28
- GRM
- 3.7
CMA / ARV
- ARV (on-the-fly)
- $248,820
- Comps found
- 2
Show comp detail 2 sales within ~0.75 mi
| Address | Dist | Beds/Ba | Sqft | Sold | Price | $/sf | Match |
|---|---|---|---|---|---|---|---|
| 419 S Talihina | 0.00mi | 2/1.0 (+1) | 754 (0%) | 0mo | $49,000 | $65 | 95 |
| 2 Cove Rd | 0.75mi | 1/1.0 | 672 (-11%) | 22mo | $222,000 | $330 | 28 |
Match score weights: distance 35% · size 25% · config 20% · recency 20%. Top-matched comps best support the ARV.
Projected returns pro-forma
5.49% appreciation · 3.0% rent growth · sell at horizon
- IRR
- 59.3%
- Equity multiple
- 4.64×
- Total profit
- $56,075
- Equity at exit
- $32,817
- IRR
- 56.6%
- Equity multiple
- 9.61×
- Total profit
- $132,630
- Equity at exit
- $58,050
Cash invested: $15,400 (down + closing). Projections, not guarantees.
Landlord ↔ Tenant lean methodology
- Overall (STATE)
- 83 Strongly Landlord-Friendly
- State Oklahoma
- 83 Strongly Landlord-Friendly · R+20
- County
- — inherits STATE
- City
- — inherits STATE
ZIP-level market 74365
- Home prices YoY
- 2.1%
- Active inventory
- 23
- Price-to-rent
- 3.7×
Monthly cashflow live
- Estimated rent
- $1,250 medium interval (Pro) →
- Mortgage (P&I)
- −$288
- Tax from tax record
- −$19 /mo · $227/yr
- Insurance
- −$23
- HOA
- −$0
- Vacancy / Maint / Mgmt
- −$262
- Net cashflow
- $657
Break-even live
Sensitivity live
| Price | -10% $688 | -5% $673 | +0% $657 | +5% $642 | +10% $626 |
|---|---|---|---|---|---|
| Rent | -10% $558 | -5% $608 | +0% $657 | +5% $707 | +10% $756 |
| Rate | -1.0pp $685 | -0.5pp $671 | base $657 | +0.5pp $643 | +1.0pp $628 |
UW: 25.0% down · 7.5% · 30yr · 1.5% tax · 5.0% vac · 8.0% maint · 8.0% mgmt
Financing live
Cash to close
- Down payment
- $13,750
- Closing costs
- $1,650
- Reserves months
- —
- Total cash needed
- —
Loan-product check · same deal, 3 products live
Conventional
25% down · 7.5% · 30yr
- Down + closing
- —
- Monthly P&I
- —
- Monthly cashflow
- —
- DSCR
- —
- Eligible?
- —
Personal DTI + credit; lowest rate.
DSCR
20% down · 8.5% · 30yr
- Down + closing
- —
- Monthly P&I
- —
- Monthly cashflow
- —
- DSCR
- —
- Eligible?
- —
No personal income docs; deal must DSCR.
Hard money
10% down · 12.0% · 12mo
- Down + closing
- —
- Monthly P&I
- —
- Monthly cashflow
- —
- DSCR
- —
- Eligible?
- —
Short-term bridge; refi at stabilization.
Rent comps 1 comps
| Address | Beds | Baths | Sqft | Rent | $/sqft | DOM | Units | Dist |
|---|---|---|---|---|---|---|---|---|
| 211 N Grace St Unit 6 Salina, OK | 2.0 | 1.5 | 900 | $1,250 | $1.39 | 3d | 1 | 0.56mi |
Listing history 3 events
-
2026-05-10status Pending
-
2026-04-11$55,000 Active
-
2025-12-23soldstatus $30,000
ⓘ Source: listings_history table (triggers on properties + properties_extension) + one-shot
backfill from property_details.listing_events for pre-trigger history.
Tax reassessment forecast OK · Resets to sale price
- Current annual tax
- $227 · $19/mo
- Projected year-2 tax
- $495 · $41/mo
- Expected delta
- +$268/yr (+$22/mo · 118.1%)
ⓘ Screening estimate from a state-policy table — verify with the county assessor before closing.
Climate risk First Street
- Flood 1/10 Low FEMA zone X (unshaded) · 0% chance over 30 yrs
- Wildfire 6/10 Major
- Heat 6/10 Major 7 d/yr ≥112°F today · 20 d/yr by 30 yrs out
- Wind 2/10 Low 4% chance of damaging wind over 30 yrs
- Air quality 2/10 Low 1 unhealthy d/yr today · 2 by 30 yrs out
Nearby sold comps map
Loading sold comps map…
Walkable amenities ~0.75 mi
Loading nearby amenities…
Taxation est. · year 1
- Rental income
- $15,000
- − Mortgage interest
- −$3,081
- − Property taxes
- −$227
- − Insurance
- −$275
- − Repairs & maintenance
- −$1,200
- − Management
- −$1,200
- − Depreciation
- −$1,600
- Taxable income
- $7,417
- Est. tax owed @ 24.0%
- −$1,780
- After-tax cash flow
- $6,107/yr
For passive investors: Depreciation is non-cash, so a rental often shows a tax loss while cash-flowing — sheltering income. Rental losses are passive: they offset passive income freely, and up to $25,000/yr can offset ordinary (W-2) income if you actively participate and your MAGI is under $100k (phasing out to $0 by $150k); unused losses carry forward. On sale, claimed depreciation is recaptured at up to 25%, and gains may owe capital-gains tax (a 1031 exchange can defer both). Figures are a year-1 estimate at your 24.0% rate — not tax advice; consult a CPA.
Schools (NCES district)
- District
- Salina
- NCES district ID
- 4026730
- Math proficiency
- 21% ▼ -23.00%
- Reading proficiency
- 20% ▼ -11.00%
- Median HH income
- $37,023
- Composite
- 17.1/100
- National rank
- #9117
- State rank
- #173 of 270 in OK
Livability — Salina
- Score
- 61/100
- State rank
- #279
- US rank
- #17437
Category grades
Schools grade is shown separately in the Schools card above.
Census & demographics
- Census place
- Salina, OK
- Population (ZIP)
- 4,473
Population outlook (Mayes County) Hauer SSP2
- Today (2025)
- 39,941 people
- By 2030
- 39,172 · -1.9%
- By 2040
- 37,540 · -6.0%
- By 2050
- 35,854 · -10.2%
- By 2075
- 32,361 · -19.0%
- By 2100
- 28,054 · -29.8%
Race, ethnicity, and origin ACS 2023
- Neighborhood character
- Highly diverse neighborhood (Simpson 0.79)
- Race & ethnicity
- White 46% Native American 40% Two or more races 13%
- Common ancestry
- Serbian 2% Slovak 2% Iranian 1%
- Foreign-born
- 0%
- Languages at home
- 95% English-only · Spanish 1%
Political lean MEDSL · Mayes
- 2024 margin
- Solid R (+57.5) · D 20.3% · R 77.8% · Other 1.9%
- 2008→2024 swing
- -29.4pp toward R · 2008: -28.1pp · 2024: -57.5pp
- All cycles
- 2024: R+57.5 2020: R+55.1 2016: R+51.7 2012: R+33.3 2008: R+28.1
Not yet ingested
- Civics
- —
Market trends
- HPI YoY
- ▲ 5.49%
- Current HPI
- 264.9172
- Rent YoY
- —
- Metro
- —
- State GDP YoY
- ▲ 1.55%
- F500 in state
- 6
Industry mix (Fortune 500 HQ in OK)
| Industry | F500 HQs | Revenue |
|---|---|---|
| Energy | 3 | $48B |
|
||
Price history
+83.3% since first listed3 events — show timeline
- 2026-05-10 Pending — MLS Technology, Inc.
- 2026-04-11 Listed $55,000 MLS Technology, Inc.
- 2025-12-23 Sold (Public Records) $30,000 Public Records
Property tax history
+4.7%/yrLatest (2025): $227 · +0.9% YoY. Source: county tax records.
Cash-flow waterfall
monthlySold comps — $/sqft
last 12 mo · ≤1 miLoading sold comps…