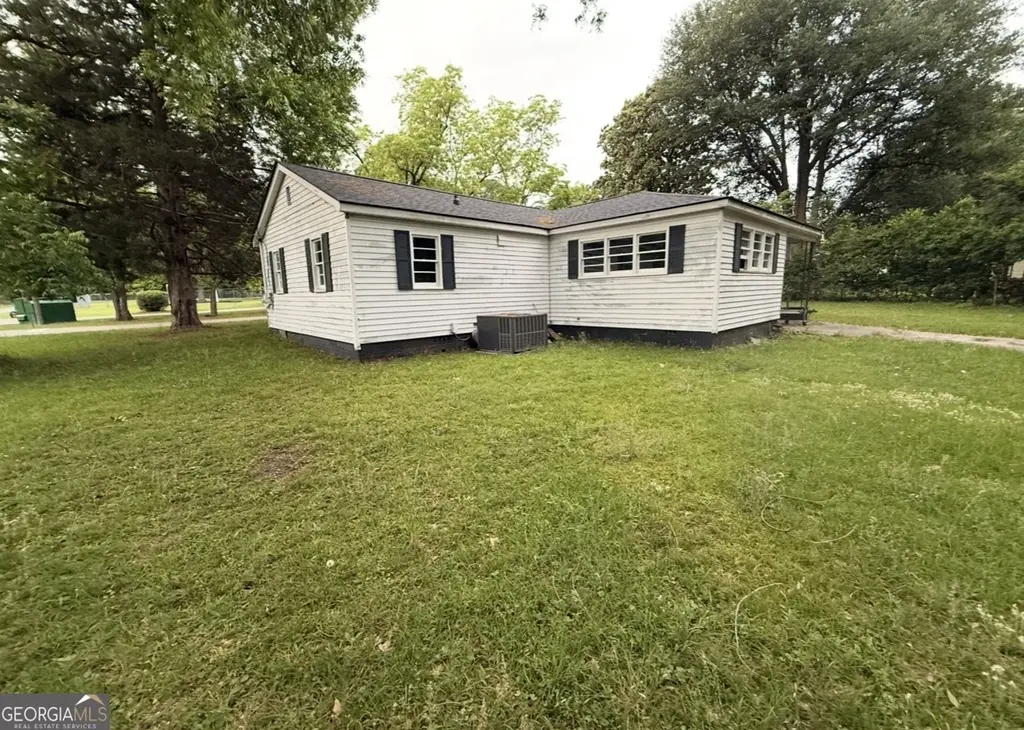
105 Jackson St · Byron, GA
Flood risk 6/10 · Moderate
- FEMA flood zone
- X (unshaded)
- Chance of flooding over 30 yrs
- 0.7%
- Est. flood insurance / yr
- $507 – $1,088
Fire risk 3/10 · Minor
- Est. fire insurance / yr
- $963 – $1,789
Heat risk 7/10 · Major
- Hot days now (above 108°F)
- 7 days/yr
- Hot days in 30 yrs
- 18 days/yr
Wind risk 6/10 · Moderate
- Chance of severe wind over 30 yrs
- 72.0%
Air-quality risk 4/10 · Minor
- Unhealthy air days now
- 4 days/yr
- Unhealthy air days in 30 yrs
- 5 days/yr
Risk factors via First Street. Map © Google.
Why this score? — see what drove the B- grade
The composite is a weighted blend of 9 inputs, each scored 0–100. Each bar is that input's sub-score; the figure is the points it added to the 100-point composite (weight × sub-score).
- Cash flow +30.0/30.0
- DSCR +10.0/10.0
- 1% rule +8.6/10.0
- ARV discount +7.5/15.0
- Livability +3.4/5.0
- Rent growth +2.5/5.0
- Condition / age +2.5/5.0
- Schools +1.8/10.0
- Appreciation +0.0/10.0
$87,000
🖨 Deal sheet 📄 Offer letter ✓ Due diligence
Listing remarks
Calling all investors!!! Stop what you are doing and take a look at this fixer upper that the current owners started to rehab. This home is located in Byron that is on a quiet corner lot that is close to everything that Byron has to offer. This home also features a brand roof and some new floors. Come complete this project for just half the price. A F331-Unsafe Property Disclosure and Hold Harmless Agreement must be signed by potential buyers before entering.
Key facts
- New floors
- Quiet corner lot
- Brand new roof
Tags
Property features AI
Finance
- HOA & community: No homeowners association
Exterior
- Parking: Carport
- Utilities: Public water; Public sewer; Electricity available
- Home design: Single-family residential house; Built in 1940; Fixer condition
- Construction: Wood siding construction; Composition roof; Crawl space foundation; Built in 1940
- Exterior features: Composition roof; Wood siding; City lot; Corner lot; Level lot
Interior
- Kitchen: Other appliances
- Bedrooms: 3 bedrooms on the main level
- Flooring: Other flooring
- Bathrooms: 1 full bathroom (main level)
- Heating & cooling: Central heating; Central air conditioning
- Interior features: Other interior features; One-level home; Crawl space basement
- Laundry & utility: No laundry room listed
Neighborhood map
What this means for you Summary
Snapshot
- This is a 3-bed/1.0-bath single-family listed at $87k.
Deal economics
- At list price, monthly cash flow is $373 ($4k/yr) — positive.
- The deal already cash-flows at list — no discount required.
- Meets the 1% rule at list price ($1k rent vs $87k).
- Cap rate 11.4% vs local median 4.0% in Byron — top-decile yield for the area; either an underpriced asset or a hidden risk that comps aren't pricing in. Stress-test before assuming the spread holds.
Location & tenants
- Location reads 68/100 on livability (#137 in GA) — a middle-class / working-renter tenant base. Strengths: cost of living A+, housing A+, crime A; Watch: employment D, amenities F, commute F.
- Peach County (rural): math 17% / reading 25% proficiency, ranked #141 of 174 in GA (top 81%) — low school quality limits family demand, transient renter base, plan for 1-2y turnover; 65% free/reduced lunch — lower-income household profile, screen leases tightly.
- Zoned schools: Byron Elementary School (math 25% / reading 27%, grade F, #728 of 1,228 statewide, top 60%, 660 students, 82% FRL); Byron Middle School (math 25% / reading 39%, grade F, #229 of 470 statewide, top 49%, 449 students, 82% FRL) — zoned schools average 82% FRL vs 65% district-wide (17 pts higher); higher-poverty schools than district average — tighter screening recommended.
- Market conditions: 205 active listings in the ZIP; 3 comparable units currently listed for rent nearby; rentals at typical pace (median 21d on market — plan ~3-4 weeks tenant-placement turnaround); 149 units permitted in Peach County in 2024 (0 in 5+ unit buildings).
Forward outlook
- Local home prices are declining (-3.0%/yr); year-one equity from $601 of loan paydown is wiped out by about $3k of value loss. Plan a longer hold.
- Peach County population projected at -18% by 2050 — secular population decline; favor cash flow + early exit over multi-decade hold.
- At projected returns (-3.0% appreciation + 3.0% rent growth), your $24k cash investment doubles in ~7 years — after that, you're playing with house money.
Negotiation context
- Only 1 days on market — expect competitive offers; lowballing is unlikely to land.
Risks & watch-outs
- Watch-outs: built in 1940 — expect roof / HVAC / electrical / plumbing capex.
- Climate carrying-cost: major flood risk; major wind risk, 72% chance of damaging wind over 30y; extreme-heat days projected 7→18/yr by 2055 (HVAC capex compounding) — expect insurance premiums to compound above CPI over the hold.
Questions for the listing agent
- Built in 1940 — when were the roof, HVAC, electrical panel, plumbing, and water heater last replaced?
- Is there a deadline driving the sale (1031 exchange, divorce, estate, relocation)? That informs how much negotiation room exists.
- What's the average days-on-market for RENTAL listings here right now (not sales)? A rising rental-DOM trend means longer vacancies and softer asking-rent achievability than the comps imply.
- What's the recent tenant-quality profile in this submarket — average credit score on applications, eviction rate, late-payment / NSF rate, and stable-employment percentage? A property-management company in the area should have these aggregated.
- How much new for-sale + rental construction is in the pipeline within 1–3 miles? Heavy new supply typically softens prices + rents 12–24 months out; constrained supply supports both.
Investment metrics
- 1% rule
- 1.36% ✓
- Cap rate
- 11.44%
- Cash-on-cash
- 18.38%
- DSCR
- 1.82
- GRM
- 6.1
CMA / ARV
- ARV (on-the-fly)
- $180,748
- Comps found
- 5
Show comp detail 5 sales within ~0.75 mi
| Address | Dist | Beds/Ba | Sqft | Sold | Price | $/sf | Match |
|---|---|---|---|---|---|---|---|
| 111 Howard St | 0.34mi | 3/2.0 | 1,259 (+2%) | 10mo | $209,900 | $167 | 69 |
| 506 Howard Street St | 0.62mi | 3/2.0 | 1,200 (-3%) | 6mo | $1,850 | $2 | 57 |
| 105 2nd St | 0.39mi | 3/2.0 | 1,080 (-13%) | 8mo | $185,000 | $171 | 50 |
| 202 Old Macon Rd | 0.42mi | 2/1.0 (-1) | 1,324 (+7%) | 19mo | $75,156 | $57 | 48 |
| 301 42 Hwy | 0.51mi | 3/2.0 | 1,334 (+8%) | 23mo | $195,000 | $146 | 40 |
Match score weights: distance 35% · size 25% · config 20% · recency 20%. Top-matched comps best support the ARV.
Projected returns pro-forma
-3.0% appreciation · 3.0% rent growth · sell at horizon
- IRR
- 10.1%
- Equity multiple
- 1.40×
- Total profit
- $9,665
- Equity at exit
- $12,972
- IRR
- 19.2%
- Equity multiple
- 2.60×
- Total profit
- $39,002
- Equity at exit
- $7,522
Cash invested: $24,360 (down + closing). Projections, not guarantees.
Landlord ↔ Tenant lean methodology
- Overall (STATE)
- 90 Strongly Landlord-Friendly
- State Georgia
- 90 Strongly Landlord-Friendly · R+3
- County
- — inherits STATE
- City
- — inherits STATE
ZIP-level market 31008
- Home prices YoY
- -18.1%
- Active inventory
- 205
- Price-to-rent
- 6.1×
Monthly cashflow live
- Estimated rent
- $1,187 medium interval (Pro) →
- Mortgage (P&I)
- −$456
- Tax from tax record
- −$72 /mo · $865/yr
- Insurance
- −$36
- HOA
- −$0
- Vacancy / Maint / Mgmt
- −$249
- Net cashflow
- $373
Break-even live
UW: 25.0% down · 7.5% · 30yr · 1.5% tax · 5.0% vac · 8.0% maint · 8.0% mgmt
Financing live
Cash to close
- Down payment
- $21,750
- Closing costs
- $2,610
- Reserves months
- —
- Total cash needed
- —
Loan-product check · same deal, 3 products live
Conventional
25% down · 7.5% · 30yr
- Down + closing
- —
- Monthly P&I
- —
- Monthly cashflow
- —
- DSCR
- —
- Eligible?
- —
Personal DTI + credit; lowest rate.
DSCR
20% down · 8.5% · 30yr
- Down + closing
- —
- Monthly P&I
- —
- Monthly cashflow
- —
- DSCR
- —
- Eligible?
- —
No personal income docs; deal must DSCR.
Hard money
10% down · 12.0% · 12mo
- Down + closing
- —
- Monthly P&I
- —
- Monthly cashflow
- —
- DSCR
- —
- Eligible?
- —
Short-term bridge; refi at stabilization.
Rent comps 3 comps
| Address | Beds | Baths | Sqft | Rent | $/sqft | DOM | Units | Dist |
|---|---|---|---|---|---|---|---|---|
| 107 Church St Byron, GA | 2.0 | 1.5–2.0 | 1150 | $1,200 | $1.04 | 13d | 2 | 0.10mi |
| 408 Main St Byron, GA | 2.0 | 1.0 | 912 | $1,000 | $1.10 | 21d | 1 | 0.19mi |
| 101 Vivian Dr Byron, GA | 3.0 | 1.5 | 1352 | $1,595 | $1.18 | 43d | 1 | 0.62mi |
Listing history 3 events
-
2026-06-07status $87,000 Under Contract 1 DOM
-
2026-06-05remarks 463-char remark
-
2026-06-05$87,000 New 1 DOM
ⓘ Source: listings_history table (triggers on properties + properties_extension) + one-shot
backfill from property_details.listing_events for pre-trigger history.
Tax reassessment forecast GA · Resets to sale price
- Current annual tax
- $865 · $72/mo
- Projected year-2 tax
- $865 · $72/mo
- Expected delta
- $0/yr ($0/mo · 0.0%)
ⓘ Screening estimate from a state-policy table — verify with the county assessor before closing.
Climate risk First Street
- Flood 6/10 Major FEMA zone X (unshaded) · 70% chance over 30 yrs
- Wildfire 3/10 Moderate
- Heat 7/10 Severe 7 d/yr ≥108°F today · 18 d/yr by 30 yrs out
- Wind 6/10 Major 72% chance of damaging wind over 30 yrs
- Air quality 4/10 Moderate 4 unhealthy d/yr today · 5 by 30 yrs out
Nearby sold comps map
Loading sold comps map…
Walkable amenities ~0.75 mi
Loading nearby amenities…
Taxation est. · year 1
- Rental income
- $14,245
- − Mortgage interest
- −$4,873
- − Property taxes
- −$865
- − Insurance
- −$435
- − Repairs & maintenance
- −$1,140
- − Management
- −$1,140
- − Depreciation
- −$2,531
- Taxable income
- $3,261
- Est. tax owed @ 24.0%
- −$783
- After-tax cash flow
- $3,695/yr
For passive investors: Depreciation is non-cash, so a rental often shows a tax loss while cash-flowing — sheltering income. Rental losses are passive: they offset passive income freely, and up to $25,000/yr can offset ordinary (W-2) income if you actively participate and your MAGI is under $100k (phasing out to $0 by $150k); unused losses carry forward. On sale, claimed depreciation is recaptured at up to 25%, and gains may owe capital-gains tax (a 1031 exchange can defer both). Figures are a year-1 estimate at your 24.0% rate — not tax advice; consult a CPA.
Schools (NCES district)
- District
- Peach County
- NCES district ID
- 1304050
- Math proficiency
- 17% ▼ -15.00%
- Reading proficiency
- 25% ▼ -5.00%
- Median HH income
- $41,348
- Composite
- 17.89/100
- National rank
- #9000
- State rank
- #141 of 174 in GA
Livability — Byron
- Score
- 68/100
- State rank
- #137
- US rank
- #9318
Category grades
Schools grade is shown separately in the Schools card above.
Census & demographics
- Census place
- Byron, GA
- Population (ZIP)
- 20,882
Population outlook (Peach County) Hauer SSP2
- Today (2025)
- 26,481 people
- By 2030
- 25,723 · -2.9%
- By 2040
- 23,812 · -10.1%
- By 2050
- 21,724 · -18.0%
- By 2075
- 17,513 · -33.9%
- By 2100
- 14,235 · -46.2%
Race, ethnicity, and origin ACS 2023
- Neighborhood character
- Majority White (61%)
- Race & ethnicity
- White 61% Black 27% Two or more races 7% Hispanic / Latino 6%
- Hispanic origin (detail)
- Mexican 3% Puerto Rican 2%
- Common ancestry
- Slovak 2% Serbian 1% Lithuanian 1%
- Foreign-born
- 2% · Canada
- Languages at home
- 95% English-only · Spanish 4%
Political lean MEDSL · Peach
- 2024 margin
- Lean R (+6.0) · D 46.8% · R 52.8%
- 2008→2024 swing
- -12.8pp toward R · 2008: 6.8pp · 2024: -6.0pp
- All cycles
- 2024: R+6.0 2020: R+4.7 2016: R+3.0 2012: D+7.5 2008: D+6.8
Not yet ingested
- Civics
- —
Market trends
- HPI YoY
- ▼ -45.93%
- Current HPI
- 208.0889
- Rent YoY
- —
- Metro
- —
- State GDP YoY
- ▲ 2.66%
- F500 in state
- 28
Industry mix (Fortune 500 HQ in GA)
| Industry | F500 HQs | Revenue |
|---|---|---|
| Paper / Packaging | 2 | $29B |
|
||
| Retail | 1 | $160B |
|
||
| Transportation / Logistics | 1 | $91B |
|
||
| Airlines | 1 | $62B |
|
||
| Consumer Goods | 1 | $47B |
|
||
| Utilities | 1 | $25B |
|
||
Price history
1 event — show timeline
- 2026-06-04 Listed $87,000 GAMLS
Property tax history
-0.2%/yrLatest (2025): $865 · +5.7% YoY. Source: county tax records.
Cash-flow waterfall
monthlySold comps — $/sqft
last 12 mo · ≤1 miLoading sold comps…