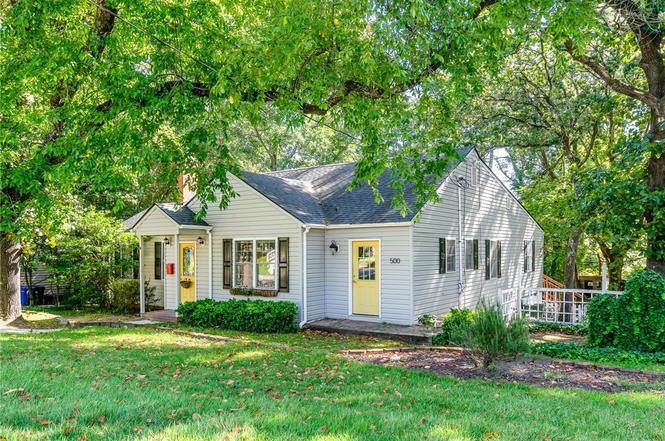
500 Pearl St · Fayetteville, NC
Flood risk 1/10 · Minimal
- FEMA flood zone
- X (unshaded)
- Chance of flooding over 30 yrs
- 0.0%
- Est. flood insurance / yr
- $473 – $860
Fire risk 2/10 · Minimal
- Est. fire insurance / yr
- $906 – $1,684
Heat risk 7/10 · Major
- Hot days now (above 106°F)
- 7 days/yr
- Hot days in 30 yrs
- 16 days/yr
Wind risk 7/10 · Major
- Chance of severe wind over 30 yrs
- 78.0%
Air-quality risk 2/10 · Minimal
- Unhealthy air days now
- 0 days/yr
- Unhealthy air days in 30 yrs
- 1 days/yr
Risk factors via First Street. Map © Google.
Why this score? — see what drove the F grade
The composite is a weighted blend of 9 inputs, each scored 0–100. Each bar is that input's sub-score; the figure is the points it added to the 100-point composite (weight × sub-score).
- Cash flow +7.8/30.0
- Livability +3.8/5.0
- Rent growth +3.3/5.0
- ARV discount +3.1/15.0
- Schools +3.1/10.0
- Condition / age +2.5/5.0
- 1% rule +2.2/10.0
- DSCR +1.9/10.0
- Appreciation +0.0/10.0
$296,000
🖨 Deal sheet (PDF) 📄 Offer letter ✓ Due diligence
Listing remarks MLS
Charming cottage in the heart of Haymount! This spacious 3 Bed / 3 Bath home features hardwood floors throughout. Large living room and den, kitchen-dining combo, and partially-covered deck make this home perfect for entertaining. Great corner lot with mature trees and landscaping.
Key facts
- Skylight windows
- Large backyard
- Updated kitchen
Tags
Property features AI
Finance
- HOA & community: No homeowners association
Exterior
- Parking: Open parking available with 2 spaces; Driveway
- Utilities: Public water; Public sewer; Electricity connected; Sewer connected; Water connected; Natural gas available
- Home design: Single-story house; Site-built construction; Updated/remodeled condition; Facing information not provided
- Construction: Vinyl siding; Architectural shingle roof
- Exterior features: Covered patio/porch; Deck; Partial fencing; City street frontage; Publicly maintained road
Interior
- Kitchen: Refrigerator included
- Bedrooms: Three bedrooms (all on the main level)
- Flooring: Hardwood; Luxury vinyl; Tile
- Bathrooms: Three full bathrooms
- Heating & cooling: Forced air heating; Heat pump; Natural gas available; Central air conditioning
- Interior features: Ceiling fans; Quartz countertops; Blinds on windows
- Laundry & utility: Hall laundry
Neighborhood map
What this means for you Summary
Snapshot
- This is a 3-bed/3.0-bath single-family listed at $296k.
Deal economics
- At list price, monthly cash flow is $-325 ($-4k/yr) — negative.
- To cash-flow at today's rent, offer at most $239k (19.4% below list).
- To meet the 1% rule (rent ≥ 1% of price), the offer needs to be $212k (28.3% below list).
- Recommended offer: $212k (28.3% below list) — sets the bar for 1% rule.
Location & tenants
- Location reads 75/100 on livability (#45 in NC, #4,031 nationally) — a middle-class / working-renter tenant base. Strengths: commute A+, cost of living A+, housing A+; Watch: crime F, employment D-.
- Cumberland County Schools (urban): math 32% / reading 41% proficiency, ranked #126 of 178 in NC (top 71%) — families likely to look elsewhere, expect single-tenant / working-renter base with shorter leases.
- Zoned schools: Vanstory Hills Elementary (math 46% / reading 50%, grade D, #477 of 1,410 statewide, top 35%, 469 students, 99% FRL); R Max Abbott Middle (math 31% / reading 45%, grade F, #251 of 475 statewide, top 54%, 759 students, 99% FRL); Terry Sanford High (math 49% / reading 52%, grade D+, #306 of 535 statewide, top 57%, 1,224 students, 59% FRL) — zoned schools average 86% FRL vs 55% district-wide (31 pts higher); higher-poverty schools than district average — tighter screening recommended.
- Market conditions: Rents rising (+3.0%/yr); 285 active listings in the ZIP; 33 comparable units currently listed for rent nearby; rentals at typical pace (median 23d on market — plan ~3-4 weeks tenant-placement turnaround); 1,125 units permitted in Cumberland County in 2024 (104 in 5+ unit buildings).
- This rent runs 44% of the median local income ($58k/yr) — at the standard rent-burdened threshold; future hikes will face affordability resistance.
Forward outlook
- Local home prices are declining (-3.0%/yr); year-one equity from $2k of loan paydown is wiped out by about $9k of value loss. Plan a longer hold.
Negotiation context
- It's been on market 171 days — a 12% lower offer ($260k) is reasonable based on typical stale-listing flexibility.
- 3 sale attempts since 13y ago; this cycle's ask has dropped $19k (6%) from the opening price — seller is motivated, your offer sets the floor, not the list.
- Current owner paid $170k; list at $296k implies a 74% gain — meaningful room to come down on a strong offer.
Risks & watch-outs
- Watch-outs: built in 1948 — expect roof / HVAC / electrical / plumbing capex.
- Climate carrying-cost: major wind risk, 78% chance of damaging wind over 30y; extreme-heat days projected 7→16/yr by 2055 (HVAC capex compounding) — expect insurance premiums to compound above CPI over the hold.
Questions for the listing agent
- What do current leases actually rent for vs. the listed asking? Can we see a recent rent roll and the last 12 months of T-12 income?
- It's been on market 171 days. Have you received any prior offers? Is the seller open to a 28% concession, seller financing, or rate buy-down credit?
- Built in 1948 — when were the roof, HVAC, electrical panel, plumbing, and water heater last replaced?
- Why hasn't it sold? Are there any deal-killer items the seller is aware of (foundation, flood, title, zoning, code violations)?
- Is there a deadline driving the sale (1031 exchange, divorce, estate, relocation)? That informs how much negotiation room exists.
- Crime grade is F in this area — have there been break-ins, vandalism, or insurance claims at this property in the last 3 years? What carrier currently insures it and at what premium?
- The area grade is low — what's the realistic commute time and amenity access for the typical tenant pool here? Any planned neighborhood developments (good or bad) we should know about?
- What's the average days-on-market for RENTAL listings here right now (not sales)? A rising rental-DOM trend means longer vacancies and softer asking-rent achievability than the comps imply.
- What's the recent tenant-quality profile in this submarket — average credit score on applications, eviction rate, late-payment / NSF rate, and stable-employment percentage? A property-management company in the area should have these aggregated.
- How much new for-sale + rental construction is in the pipeline within 1–3 miles? Heavy new supply typically softens prices + rents 12–24 months out; constrained supply supports both.
Investment metrics
- 1% rule
- 0.72% ✗
- Cap rate
- 4.98%
- Cash-on-cash
- -4.70%
- DSCR
- 0.79
- GRM
- 11.6
CMA / ARV
- ARV (on-the-fly)
- $269,855
- Comps found
- 12
Show comp detail 12 sales within ~0.75 mi
| Address | Dist | Beds/Ba | Sqft | Sold | Price | $/sf | Match |
|---|---|---|---|---|---|---|---|
| 807 Cape Fear Ave | 0.32mi | 3/2.0 | 1,670 (-4%) | 1mo | $190,000 | $114 | 74 |
| 506 Pilot Ave | 0.14mi | 2/2.0 (-1) | 1,619 (-7%) | 1mo | $223,000 | $138 | 72 |
| 105 Westmont Dr | 0.31mi | 3/1.5 | 1,790 (+3%) | 4mo | $305,000 | $170 | 71 |
| 503 Cape Fear Ave | 0.10mi | 3/2.0 | 1,501 (-14%) | 2mo | $299,500 | $200 | 67 |
| 2015 Rock Ave | 0.46mi | 3/2.5 | 1,648 (-5%) | 2mo | $255,000 | $155 | 66 |
| 1418 General Lee Ave | 0.34mi | 3/2.0 | 1,877 (+8%) | 4mo | $392,500 | $209 | 64 |
| 1409 Grace View Pl | 0.70mi | 3/2.5 | 1,792 (+3%) | 0mo | $343,000 | $191 | 60 |
| 833 Anarine St | 0.52mi | 2/2.0 (-1) | 1,680 (-4%) | 5mo | $155,000 | $92 | 57 |
| 901 Edenwood Dr | 0.73mi | 4/2.5 (+1) | 1,612 (-7%) | 2mo | $249,900 | $155 | 44 |
| 1012 W Rowan St | 0.64mi | 4/2.0 (+1) | 1,902 (+9%) | 4mo | $275,000 | $145 | 42 |
| 202 Marshall Rd | 0.64mi | 3/2.0 | 1,509 (-13%) | 3mo | $238,000 | $158 | 42 |
| 1926 N Pearl St | 0.74mi | 4/2.0 (+1) | 1,895 (+9%) | 4mo | $259,999 | $137 | 39 |
Match score weights: distance 35% · size 25% · config 20% · recency 20%. Top-matched comps best support the ARV.
Projected returns pro-forma
-3.0% appreciation · 3.01% rent growth · sell at horizon
- IRR
- -24.3%
- Equity multiple
- 0.17×
- Total profit
- $-68,631
- Equity at exit
- $44,135
- IRR
- -19.6%
- Equity multiple
- -0.04×
- Total profit
- $-86,300
- Equity at exit
- $25,593
Cash invested: $82,880 (down + closing). Projections, not guarantees.
Landlord ↔ Tenant lean methodology
- Overall (STATE)
- 85 Strongly Landlord-Friendly
- State North Carolina
- 85 Strongly Landlord-Friendly · R+3
- County
- — inherits STATE
- City
- — inherits STATE
ZIP-level market 28303
- Home prices YoY
- -25.4%
- Rents YoY
- 3.0%
- Active inventory
- 285
- Price-to-rent
- 11.6×
Monthly cashflow live
- Estimated rent
- $2,122 high interval (Pro) →
- Mortgage (P&I)
- −$1,552
- Tax from tax record
- −$325 /mo · $3,905/yr
- Insurance
- −$123
- HOA
- −$0
- Vacancy / Maint / Mgmt
- −$446
- Net cashflow
- $-325
Break-even live
Sensitivity live
| Price | -10% $-157 | -5% $-241 | +0% $-325 | +5% $-409 | +10% $-492 |
|---|---|---|---|---|---|
| Rent | -10% $-492 | -5% $-409 | +0% $-325 | +5% $-241 | +10% $-157 |
| Rate | -1.0pp $-176 | -0.5pp $-250 | base $-325 | +0.5pp $-402 | +1.0pp $-480 |
UW: 25.0% down · 7.5% · 30yr · 1.5% tax · 5.0% vac · 8.0% maint · 8.0% mgmt
Financing live
Cash to close
- Down payment
- $74,000
- Closing costs
- $8,880
- Reserves months
- —
- Total cash needed
- —
Loan-product check · same deal, 3 products live
Conventional
25% down · 7.5% · 30yr
- Down + closing
- —
- Monthly P&I
- —
- Monthly cashflow
- —
- DSCR
- —
- Eligible?
- —
Personal DTI + credit; lowest rate.
DSCR
20% down · 8.5% · 30yr
- Down + closing
- —
- Monthly P&I
- —
- Monthly cashflow
- —
- DSCR
- —
- Eligible?
- —
No personal income docs; deal must DSCR.
Hard money
10% down · 12.0% · 12mo
- Down + closing
- —
- Monthly P&I
- —
- Monthly cashflow
- —
- DSCR
- —
- Eligible?
- —
Short-term bridge; refi at stabilization.
Rent comps 33 comps
| Address | Beds | Baths | Sqft | Rent | $/sqft | DOM | Units | Dist |
|---|---|---|---|---|---|---|---|---|
| 424 Pearl St Unit 1367380P Fayetteville, NC | 4.0 | 3.0 | 2077 | $4,419 | $2.13 | 15d | 1 | 0.02mi |
| 530 Pearl St Unit 1367379P Fayetteville, NC | 3.0 | 2.0 | 1194 | $3,577 | $3.00 | 15d | 1 | 0.13mi |
| 536 Pearl St Fayetteville, NC | 2.0 | 1.0 | 1101 | $1,349 | $1.23 | 15d | 1 | 0.16mi |
| 1713 Fort Bragg Rd Unit 1367383P Fayetteville, NC | 4.0 | 2.0 | 1894 | $3,565 | $1.88 | 15d | 1 | 0.20mi |
| 600 Glenville Ave Fayetteville, NC | 2.0 | 1.5 | 1105 | $1,295 | $1.17 | 15d | 1 | 0.24mi |
| 104 Brett Ct Fayetteville, NC | 2.0 | 2.5 | 1210 | $1,400 | $1.16 | 23d | 1 | 0.29mi |
| 809 Cape Fear Ave Fayetteville, NC | 2.0 | 1.0 | 1225 | $1,450 | $1.18 | 23d | 1 | 0.35mi |
| 1228 Woodland Dr Unit 1 Fayetteville, NC | 2.0 | 2.0 | 1465 | $1,595 | $1.09 | 15d | 1 | 0.41mi |
| 1507 Westlawn Ave Fayetteville, NC | 2.0 | 2.0 | 1386 | $1,500 | $1.08 | 25d | 1 | 0.43mi |
| 2012 Fig Ct Fayetteville, NC | 3.0 | 2.5 | 1676 | $1,945 | $1.16 | 25d | 1 | 0.53mi |
| 318 Fairwood Ct Fayetteville, NC | 3.0 | 2.0 | 1126 | $1,550 | $1.38 | 25d | 1 | 0.53mi |
| 501 Lambert St Fayetteville, NC | 2.0 | 2.0 | 1200 | $1,230 | $1.02 | 15d | 3 | 0.54mi |
| 211 Ellington St Fayetteville, NC | 2.0 | 1.5 | 1050 | $1,395 | $1.33 | 25d | 1 | 0.62mi |
| 808 Ethelored St Fayetteville, NC | 2.0 | 2.0 | 1701 | $1,395 | $0.82 | 25d | 1 | 0.62mi |
| 2209 Morganton Rd Fayetteville, NC | 2.0 | 2.0 | 1163 | $1,317 | $1.13 | 15d | 7 | 0.66mi |
| 1100 Clarendon St #402 Fayetteville, NC | 2.0 | 2.0 | 1073 | $1,400 | $1.30 | 23d | 1 | 0.72mi |
| 1406 Raeford Rd Fayetteville, NC | 2.0 | 2.0 | 1176 | $1,650 | $1.40 | 15d | 1 | 0.73mi |
| 1513 Raeford Rd Fayetteville, NC | 3.0 | 2.0 | 2201 | $2,400 | $1.09 | 25d | 1 | 0.75mi |
| 2326 Barrington Cir Fayetteville, NC | 2.0 | 1.0 | 1050 | $1,200 | $1.14 | 25d | 1 | 0.79mi |
| 2326 Barrington Cir Fayetteville, NC | 2.0 | 1.0 | 1050 | $1,200 | $1.14 | 15d | 1 | 0.79mi |
| 2328 Barrington Cir Fayetteville, NC | 2.0 | 1.0 | 1050 | $1,000 | $0.95 | 23d | 1 | 0.80mi |
| 1000 Ivy Rd Fayetteville, NC | 3.0 | 1.0 | 1200 | $1,400 | $1.17 | 25d | 1 | 0.82mi |
| 1210 Simpson St Fayetteville, NC | 4.0 | 2.5 | 1917 | $2,200 | $1.15 | 25d | 1 | 0.99mi |
| 322 Valley Rd Fayetteville, NC | 3.0 | 2.0 | 1328 | $1,650 | $1.24 | 15d | 1 | 1.05mi |
| 1628 Murchison Rd Fayetteville, NC | 3.0 | 1.0 | 1700 | $1,295 | $0.76 | 25d | 1 | 1.09mi |
| 1817 McGougan Rd Fayetteville, NC | 3.0 | 2.0 | 1811 | $2,100 | $1.16 | 15d | 1 | 1.16mi |
| 1820 McGougan Rd Fayetteville, NC | 3.0 | 2.5 | 1967 | $1,850 | $0.94 | 25d | 1 | 1.19mi |
| 708 Marketview Ct Fayetteville, NC | 3.0 | 2.0 | 1584 | $1,700 | $1.07 | 25d | 1 | 1.20mi |
| 571 Winding Creek Rd Unit F Fayetteville, NC | 3.0 | 2.5 | 1452 | $1,295 | $0.89 | 15d | 1 | 1.20mi |
| 1704 Newark Ave Fayetteville, NC | 2.0 | 1.0 | 1100 | $850 | $0.77 | 25d | 1 | 1.22mi |
| 807 Branson St #2 Fayetteville, NC | 3.0 | 2.0 | 1304 | $1,350 | $1.04 | 25d | 1 | 1.23mi |
| 421 Cityview Ln Fayetteville, NC | 2.0 | 2.5 | 1050 | $1,700 | $1.62 | 25d | 1 | 1.25mi |
| 452 Cityview Ln Fayetteville, NC | 2.0 | 2.5 | 1088 | $1,200 | $1.10 | 25d | 1 | 1.27mi |
Listing history 14 events
-
2026-05-31days on market $296,000 Active 171 DOM
-
2026-05-30days on market $296,000 Active 170 DOM
-
2026-04-24price $296,000
-
2026-03-30price $297,500
-
2026-03-19price $305,000
-
2026-01-31price $310,000
-
2025-12-11$315,000 Active
-
2021-01-11soldstatus $170,000 282-char remark
Show marketing remark (282 chars)
Charming cottage in the heart of Haymount! This spacious 3 Bed / 3 Bath home features hardwood floors throughout. Large living room and den, kitchen-dining combo, and partially-covered deck make this home perfect for entertaining. Great corner lot with mature trees and landscaping.
-
2021-01-11soldstatus $170,000
Show marketing remark (282 chars)
Charming cottage in the heart of Haymount! This spacious 3 Bed / 3 Bath home features hardwood floors throughout. Large living room and den, kitchen-dining combo, and partially-covered deck make this home perfect for entertaining. Great corner lot with mature trees and landscaping.
-
2020-09-08$185,000 282-char remark
Show marketing remark (282 chars)
Charming cottage in the heart of Haymount! This spacious 3 Bed / 3 Bath home features hardwood floors throughout. Large living room and den, kitchen-dining combo, and partially-covered deck make this home perfect for entertaining. Great corner lot with mature trees and landscaping.
-
2014-06-30historical
-
2013-11-25$194,900
-
1998-12-18soldstatus $105,000
-
1994-09-08soldstatus $85,500
ⓘ Source: listings_history table (triggers on properties + properties_extension) + one-shot
backfill from property_details.listing_events for pre-trigger history.
Tax reassessment forecast NC · Resets to sale price
- Current annual tax
- $3,905 · $325/mo
- Projected year-2 tax
- $3,905 · $325/mo
- Expected delta
- $0/yr ($0/mo · 0.0%)
ⓘ Screening estimate from a state-policy table — verify with the county assessor before closing.
Climate risk First Street
- Flood 1/10 Low FEMA zone X (unshaded) · 0% chance over 30 yrs
- Wildfire 2/10 Low
- Heat 7/10 Severe 7 d/yr ≥106°F today · 16 d/yr by 30 yrs out
- Wind 7/10 Severe 78% chance of damaging wind over 30 yrs
- Air quality 2/10 Low 0 unhealthy d/yr today · 1 by 30 yrs out
Nearby sold comps map
Loading sold comps map…
Walkable amenities ~0.75 mi
Loading nearby amenities…
Taxation est. · year 1
- Rental income
- $25,460
- − Mortgage interest
- −$16,581
- − Property taxes
- −$3,905
- − Insurance
- −$1,480
- − Repairs & maintenance
- −$2,037
- − Management
- −$2,037
- − Depreciation
- −$8,611
- Taxable loss
- −$9,190
- Est. tax savings @ 24.0%
- +$2,206
- After-tax cash flow
- $-1,693/yr
For passive investors: Depreciation is non-cash, so a rental often shows a tax loss while cash-flowing — sheltering income. Rental losses are passive: they offset passive income freely, and up to $25,000/yr can offset ordinary (W-2) income if you actively participate and your MAGI is under $100k (phasing out to $0 by $150k); unused losses carry forward. On sale, claimed depreciation is recaptured at up to 25%, and gains may owe capital-gains tax (a 1031 exchange can defer both). Figures are a year-1 estimate at your 24.0% rate — not tax advice; consult a CPA.
Schools (NCES district)
- District
- Cumberland County Schools
- NCES district ID
- 3700011
- Math proficiency
- 32% ▼ -2.00%
- Reading proficiency
- 41% ▼ -1.00%
- Median HH income
- $44,168
- Composite
- 31.0/100
- National rank
- #6096
- State rank
- #126 of 178 in NC
Livability — Fayetteville
- Score
- 75/100
- State rank
- #45
- US rank
- #4031
Category grades
Schools grade is shown separately in the Schools card above.
Census & demographics
- Census place
- Fayetteville, NC
- County
- Cumberland County · 265,314 people
- City population
- 226,118
- Metro
- Fayetteville, NC
- Population (ZIP)
- 30,965
- Household income
- $58,223
- Rent vs Own
- Severe rent burden
- 1370.0
Population outlook (Cumberland County) Hauer SSP2
- Today (2025)
- 330,855 people
- By 2030
- 333,523 · +0.8%
- By 2040
- 335,583 · +1.4%
- By 2050
- 335,325 · +1.4%
- By 2075
- 342,853 · +3.6%
- By 2100
- 340,698 · +3.0%
Race, ethnicity, and origin ACS 2023
- Neighborhood character
- Diverse neighborhood (Simpson 0.70)
- Race & ethnicity
- White 39% Black 37% Two or more races 11% Hispanic / Latino 10% Asian 4% Pacific Islander 1%
- Hispanic origin (detail)
- Mexican 2% Puerto Rican 3%
- Common ancestry
- Slovak 3% Serbian 1% Lithuanian 1%
- Foreign-born
- 9% · Canada, South Korea, Vietnam
- Languages at home
- 86% English-only · Spanish 7% Other Asian/Pacific 2% Korean 1%
Political lean MEDSL · Cumberland
- 2024 margin
- D (+13.4) · D 56.1% · R 42.7% · Other 1.2%
- 2008→2024 swing
- -4.3pp toward R · 2008: 17.7pp · 2024: 13.4pp
- All cycles
- 2024: D+13.4 2020: D+16.6 2016: D+16.0 2012: D+19.7 2008: D+17.7
Not yet ingested
- Civics
- —
Market trends
- HPI YoY
- ▼ -77.14%
- Current HPI
- 226.5097
- Rent YoY
- ▲ 3.01%
- Metro
- Fayetteville, NC
- State GDP YoY
- ▲ 3.28%
- F500 in state
- 26
Industry mix (Fortune 500 HQ in NC)
| Industry | F500 HQs | Revenue |
|---|---|---|
| Financial Services | 2 | $213B |
|
||
| Retail | 2 | $95B |
|
||
| Industrial Conglomerate | 1 | $38B |
|
||
| Metals / Steel | 1 | $35B |
|
||
| Utilities | 1 | $30B |
|
||
| Industrial Machinery | 1 | $19B |
|
||
Price history
+246.2% since first listed12 events — show timeline
- 2026-04-24 Price Changed $296,000 TMLS
- 2026-03-30 Price Changed $297,500 TMLS
- 2026-03-19 Price Changed $305,000 TMLS
- 2026-01-31 Price Changed $310,000 TMLS
- 2025-12-11 Listed $315,000 TMLS
- 2021-01-11 Sold (Public Records) $170,000 Public Records
- 2021-01-11 Sold (MLS) $170,000 LPRMLS
- 2020-09-08 Listed $185,000 LPRMLS
- 2014-06-30 Listing Removed — TMLS
- 2013-11-25 Listed $194,900 TMLS
- 1998-12-18 Sold (Public Records) $105,000 Public Records
- 1994-09-08 Sold (Public Records) $85,500 Public Records
Property tax history
+4.6%/yrLatest (2025): $3,905 · +33.3% YoY. Source: county tax records.
Cash-flow waterfall
monthlySold comps — $/sqft
last 12 mo · ≤1 miLoading sold comps…