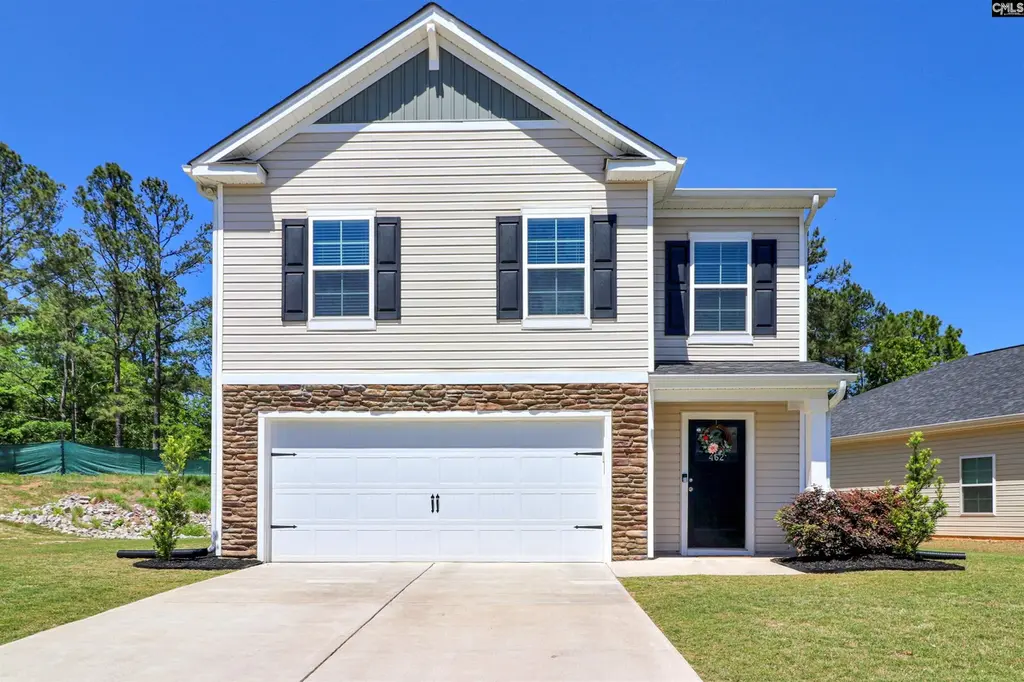
462 N High Duck Trl · Blythewood, SC
Flood risk No data
- FEMA flood zone
- —
- Chance of flooding over 30 yrs
- —
- Est. flood insurance / yr
- —
Fire risk No data
- Est. fire insurance / yr
- —
Heat risk No data
- Hot days now (above threshold)
- —
- Hot days in 30 yrs
- —
Wind risk No data
- Chance of severe wind over 30 yrs
- —
Air-quality risk No data
- Unhealthy air days now
- —
- Unhealthy air days in 30 yrs
- —
Risk factors via First Street. Map © Google.
Why this score? — see what drove the C- grade
The composite is a weighted blend of 9 inputs, each scored 0–100. Each bar is that input's sub-score; the figure is the points it added to the 100-point composite (weight × sub-score).
- Cash flow +21.6/30.0
- ARV discount +7.5/15.0
- DSCR +6.9/10.0
- 1% rule +5.3/10.0
- Condition / age +4.0/5.0
- Schools +3.6/10.0
- Livability +3.5/5.0
- Rent growth +2.5/5.0
- Appreciation +0.0/10.0
$263,500
🖨 Deal sheet 📄 Offer letter ✓ Due diligence
Listing remarks
Welcome to this beautifully maintained, like-new home built in 2023, perfectly positioned at the end of the street for added privacy and peaceful surroundings. Situated next to open green space, this property has a rare combination of space, comfort, and convenience. Step inside to an inviting open-concept layout featuring a spacious kitchen with granite countertops, a large island with bar seating, and seamless flow into the dining and living areas—perfect for entertaining or everyday living. The home has 4 bedrooms, including a uniquely designed upstairs bedroom that is set apart from the others, making it ideal for a private guest suite, home office, or flex space. The owner’
Key facts
- Community amenities
- Spacious kitchen
- Large island
Tags
Property features AI
Finance
- HOA & community: Has association; Association maintains common areas, playground, and pool
Exterior
- Parking: Attached garage with 2 garage spaces (main level entry)
- Utilities: Public water; Public sewer
- Home design: Two-story home
- Construction: Slab foundation
- Exterior features: Vinyl exterior finish; Paved road access; Community pool
Interior
- Kitchen: Smooth surface range
- Bedrooms: Master bedroom on second level; Bedrooms 2–4 on second level
- Bathrooms: Two full bathrooms; One half bathroom; One partial bathroom
- Heating & cooling: Central heating; Central air conditioning
- Interior features: Smooth surface range; Laundry in closet; Central heating and central cooling
- Laundry & utility: Laundry located in a closet
Neighborhood map
What this means for you Summary
Snapshot
- This is a 4-bed/3.0-bath single-family listed at $264k. Condition is rated good.
Deal economics
- At list price, monthly cash flow is $403 ($5k/yr) — positive.
- The deal already cash-flows at list — no discount required.
- Meets the 1% rule at list price ($3k rent vs $264k).
- Recommended offer: $256k (3.0% below list) — sets the bar for market timing.
Location & tenants
- Location reads 70/100 on livability (#58 in SC) — a middle-class / working-renter tenant base. Strengths: crime A+, employment A+, housing A+; Watch: amenities F, commute F, health & safety F.
- Richland 02 (suburban): math 35% / reading 47% proficiency, ranked #29 of 80 in SC (top 36%) — families likely to look elsewhere, expect single-tenant / working-renter base with shorter leases.
- Zoned schools: Blythewood High (math 72% / reading 92%, grade A, #19 of 196 statewide, top 10%, 2,094 students, 39% FRL) — zoned schools at 39% FRL track the district average.
- Zoned-school proficiency averages 82% at this address vs 41% district-wide (+41 pts) — the actual schools serving this property are materially stronger than the Richland 02 average implies; a family-tenant draw the district grade alone would hide.
- Market conditions: 650 active listings in the ZIP; 9 comparable units currently listed for rent nearby; rentals leasing fast (median 11d on market — plan ~1-2 weeks tenant-placement turnaround); solid renter incomes; 3,472 units permitted in Richland County in 2024 (1,096 in 5+ unit buildings).
- This rent runs 34% of the median local income ($95k/yr) — at the standard rent-burdened threshold; future hikes will face affordability resistance.
Forward outlook
- Local home prices are declining (-3.0%/yr); year-one equity from $2k of loan paydown is wiped out by about $8k of value loss. Plan a longer hold.
- Richland County population projected at +30% by 2050 — long-run rental-demand tailwind backs the buy-and-hold thesis.
Negotiation context
- It's been on market 56 days — a 3% lower offer ($256k) is reasonable based on typical stale-listing flexibility.
- 3 sale attempts since 3y ago with the ask held roughly flat each time — persistent listings suggest the price (not the market) is what's stuck; bring a comps-based counter.
Questions for the listing agent
- It's been on market 56 days. Have you received any prior offers? Is the seller open to a 3% concession, seller financing, or rate buy-down credit?
- What does the HOA fee cover, when was the last increase, and are there any pending special assessments or reserve-fund shortfalls?
- Is there a deadline driving the sale (1031 exchange, divorce, estate, relocation)? That informs how much negotiation room exists.
- Schools are B-rated — typically a magnet for longer-tenancy family renters. What's the average tenant stay here, and is there a school-zone premium baked into asking?
- What's the average days-on-market for RENTAL listings here right now (not sales)? A rising rental-DOM trend means longer vacancies and softer asking-rent achievability than the comps imply.
- What's the recent tenant-quality profile in this submarket — average credit score on applications, eviction rate, late-payment / NSF rate, and stable-employment percentage? A property-management company in the area should have these aggregated.
- How much new for-sale + rental construction is in the pipeline within 1–3 miles? Heavy new supply typically softens prices + rents 12–24 months out; constrained supply supports both.
Investment metrics
- 1% rule
- 1.03% ✓
- Cap rate
- 8.13%
- Cash-on-cash
- 6.55%
- DSCR
- 1.29
- GRM
- 8.1
CMA / ARV
No comps found within radius.
Projected returns pro-forma
-3.0% appreciation · 3.0% rent growth · sell at horizon
- IRR
- -6.2%
- Equity multiple
- 0.77×
- Total profit
- $-17,067
- Equity at exit
- $39,289
- IRR
- 3.4%
- Equity multiple
- 1.25×
- Total profit
- $18,107
- Equity at exit
- $22,783
Cash invested: $73,780 (down + closing). Projections, not guarantees.
Landlord ↔ Tenant lean methodology
- Overall (STATE)
- 90 Strongly Landlord-Friendly
- State South Carolina
- 90 Strongly Landlord-Friendly · R+6
- County
- — inherits STATE
- City
- — inherits STATE
ZIP-level market 29016
- Home prices YoY
- -26.3%
- Active inventory
- 650
- Price-to-rent
- 8.1×
Monthly cashflow live
- Estimated rent
- $2,704 high interval (Pro) →
- Mortgage (P&I)
- −$1,382
- Tax from tax record
- −$208 /mo · $2,498/yr
- Insurance
- −$110
- HOA
- −$34
- Vacancy / Maint / Mgmt
- −$568
- Net cashflow
- $403
Break-even live
UW: 25.0% down · 7.5% · 30yr · 1.5% tax · 5.0% vac · 8.0% maint · 8.0% mgmt
Financing live
Cash to close
- Down payment
- $65,875
- Closing costs
- $7,905
- Reserves months
- —
- Total cash needed
- —
Loan-product check · same deal, 3 products live
Conventional
25% down · 7.5% · 30yr
- Down + closing
- —
- Monthly P&I
- —
- Monthly cashflow
- —
- DSCR
- —
- Eligible?
- —
Personal DTI + credit; lowest rate.
DSCR
20% down · 8.5% · 30yr
- Down + closing
- —
- Monthly P&I
- —
- Monthly cashflow
- —
- DSCR
- —
- Eligible?
- —
No personal income docs; deal must DSCR.
Hard money
10% down · 12.0% · 12mo
- Down + closing
- —
- Monthly P&I
- —
- Monthly cashflow
- —
- DSCR
- —
- Eligible?
- —
Short-term bridge; refi at stabilization.
Rent comps 9 comps
| Address | Beds | Baths | Sqft | Rent | $/sqft | DOM | Units | Dist |
|---|---|---|---|---|---|---|---|---|
| 463 N High Duck Trl Blythewood, SC | 3.0 | 2.5 | 1604 | $2,200 | $1.37 | 3d | 1 | 0.03mi |
| 620 Stono DR Blythewood, SC | 5.0 | 3.0 | 2334 | $2,350 | $1.01 | 14d | 1 | 0.17mi |
| 25 Oak Lake Ct Blythewood, SC | 4.0 | 2.0 | 2050 | $2,050 | $1.00 | 23d | 1 | 0.56mi |
| 2 Knot Ct Blythewood, SC | 4.0 | 2.5 | 2004 | $2,250 | $1.12 | 23d | 1 | 0.58mi |
| 254 Boulder Ridge Loop Blythewood, SC | 5.0 | 3.0 | 2245 | $2,539 | $1.13 | 3d | 1 | 0.82mi |
| 232 Boulder Ridge Loop Blythewood, SC | 4.0 | 2.5 | 1902 | $2,299 | $1.21 | 14d | 1 | 0.83mi |
| 18 Iron Horse Ct Blythewood, SC | 5.0 | 3.0 | 2245 | $2,539 | $1.13 | 2d | 1 | 0.92mi |
| 242 Honey Hill Way Blythewood, SC | 4.0 | 2.5 | 1926 | $2,750 | $1.43 | 11d | 1 | 1.07mi |
| 227 Honey Hill Way Blythewood, SC | 3.0 | 2.5 | 1689 | $2,180 | $1.29 | 2d | 1 | 1.11mi |
HOA detail
- Monthly dues
- $34 · $408/yr
Listing history 19 events
-
2026-06-18days on market $263,500 Active 56 DOM
-
2026-06-17days on market $263,500 Active 55 DOM
-
2026-06-16days on market $263,500 Active 54 DOM
-
2026-06-15days on market $263,500 Active 53 DOM
-
2026-06-14days on market $263,500 Active 51 DOM
-
2026-06-13days on market $263,500 Active 50 DOM
-
2026-06-10statusdays on market $263,500 Active 48 DOM
-
2026-06-09days on market $263,500 Active - Contingent 47 DOM
-
2026-06-08days on market $263,500 Active - Contingent 46 DOM
-
2026-06-07days on market $263,500 Active - Contingent 45 DOM
-
2026-06-05statusdays on market $263,500 Active - Contingent 42 DOM
-
2026-06-03days on market $263,500 Active 41 DOM
-
2026-06-03days on market $263,500 Active 40 DOM
-
2026-06-01days on market $263,500 Active 39 DOM
-
2026-05-31days on market $263,500 Active 38 DOM
-
2026-05-20price $263,500
-
2026-04-23$268,500 Active
-
2023-02-01$254,900 Active
-
2023-01-30$254,100 Active
ⓘ Source: listings_history table (triggers on properties + properties_extension) + one-shot
backfill from property_details.listing_events for pre-trigger history.
Tax reassessment forecast SC · Resets to sale price
- Current annual tax
- $2,498 · $208/mo
- Projected year-2 tax
- $2,498 · $208/mo
- Expected delta
- $0/yr ($0/mo · 0.0%)
ⓘ Screening estimate from a state-policy table — verify with the county assessor before closing.
Nearby sold comps map
Loading sold comps map…
Walkable amenities ~0.75 mi
Loading nearby amenities…
Taxation est. · year 1
- Rental income
- $32,452
- − Mortgage interest
- −$14,760
- − Property taxes
- −$2,498
- − Insurance
- −$1,318
- − Repairs & maintenance
- −$2,596
- − Management
- −$2,596
- − HOA
- −$408
- − Depreciation
- −$7,665
- Taxable income
- $610
- Est. tax owed @ 24.0%
- −$147
- After-tax cash flow
- $4,685/yr
For passive investors: Depreciation is non-cash, so a rental often shows a tax loss while cash-flowing — sheltering income. Rental losses are passive: they offset passive income freely, and up to $25,000/yr can offset ordinary (W-2) income if you actively participate and your MAGI is under $100k (phasing out to $0 by $150k); unused losses carry forward. On sale, claimed depreciation is recaptured at up to 25%, and gains may owe capital-gains tax (a 1031 exchange can defer both). Figures are a year-1 estimate at your 24.0% rate — not tax advice; consult a CPA.
Condition & rehab AI · 1 photo
This 2023-built single-family home is in excellent condition with a good condition score of 80. It is move-in ready with minimal cosmetic updates needed to enhance its resale value.
Value-add opportunities
- Resale Paint exterior trim — Enhances curb appeal
- Resale Paint interior trim — Enhances interior appearance
- Resale Replace countertops — Granite countertops are durable but can be replaced for a fresh look
Renovation cost estimate screening
Value-add ROI direction
- Resale Paint exterior trim — Enhances curb appeal ↑
- Resale Paint interior trim — Enhances interior appearance ↑
- Resale Replace countertops — Granite countertops are durable but can be replaced for a fresh look ↑
ⓘ Cost ranges are severity-bucket heuristics (US national rule-of-thumb). Get contractor quotes + a written scope before underwriting a rehab budget.
Schools (NCES district)
- District
- Richland 02
- NCES district ID
- 4503390
- Math proficiency
- 35% ▼ -15.00%
- Reading proficiency
- 47% ▼ -5.00%
- Median HH income
- $59,684
- Composite
- 36.2/100
- National rank
- #4730
- State rank
- #29 of 80 in SC
Livability — Blythewood
- Score
- 70/100
- State rank
- #58
- US rank
- #7406
Category grades
Schools grade is shown separately in the Schools card above.
Census & demographics
- County
- Richland County · 389,530 people
- City population
- 30,454
- Metro
- Columbia, SC
- Population (ZIP)
- 30,454
- Household income
- $95,082
- Rent vs Own
- Severe rent burden
- 559.0
Population outlook (Richland County) Hauer SSP2
- Today (2025)
- 459,667 people
- By 2030
- 487,524 · +6.1%
- By 2040
- 542,035 · +17.9%
- By 2050
- 595,371 · +29.5%
- By 2075
- 732,998 · +59.5%
- By 2100
- 820,415 · +78.5%
Race, ethnicity, and origin ACS 2023
- Neighborhood character
- Diverse neighborhood (Simpson 0.64)
- Race & ethnicity
- Black 43% White 42% Two or more races 7% Hispanic / Latino 7% Asian 3%
- Hispanic origin (detail)
- Mexican 1% Puerto Rican 2%
- Common ancestry
- Lithuanian 2% Romanian 2% Slovak 2%
- Foreign-born
- 5% · Canada, China
- Languages at home
- 90% English-only · Spanish 5% Other Indo-European 1% German/W. Germanic 1%
Political lean MEDSL · Richland
- 2024 margin
- Solid D (+34.6) · D 66.4% · R 31.8% · Other 1.8%
- 2008→2024 swing
- +5.7pp toward D · 2008: 28.9pp · 2024: 34.6pp
- All cycles
- 2024: D+34.6 2020: D+38.3 2016: D+32.9 2012: D+33.3 2008: D+28.9
Not yet ingested
- Civics
- —
Market trends
- HPI YoY
- ▼ -65.48%
- Current HPI
- 183.5933
- Rent YoY
- —
- Metro
- Columbia, SC
- State GDP YoY
- ▲ 4.51%
- F500 in state
- 2
Industry mix (Fortune 500 HQ in SC)
| Industry | F500 HQs | Revenue |
|---|---|---|
| Packaging | 1 | $7B |
|
||
Price history
+3.7% since first listed4 events — show timeline
- 2026-05-20 Price Changed $263,500 Consolidated MLS
- 2026-04-23 Listed $268,500 Consolidated MLS
- 2023-02-01 Listed $254,900 Consolidated MLS
- 2023-01-30 Listed $254,100 Consolidated MLS
Property tax history
+150.2%/yrLatest (2025): $2,498 · +3.6% YoY. Source: county tax records.
Cash-flow waterfall
monthlySold comps — $/sqft
last 12 mo · ≤1 miLoading sold comps…