 Multi-family
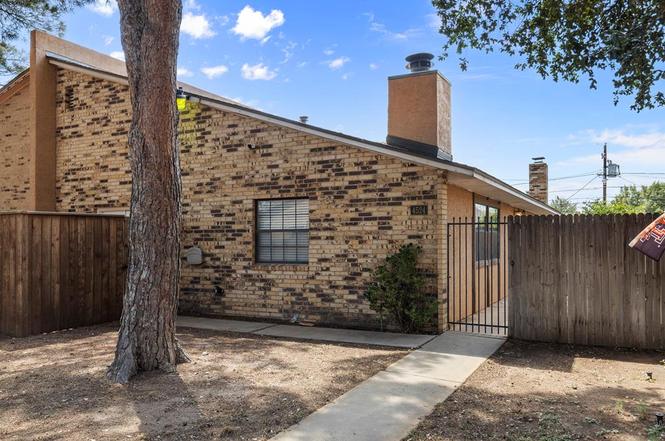
4524 Fairgate Dr · Midland, TX
Flood risk 1/10 · Minimal
- FEMA flood zone
- X
- Chance of flooding over 30 yrs
- 0.0%
- Est. flood insurance / yr
- $507 – $1,088
Fire risk 7/10 · Major
- Est. fire insurance / yr
- $1,222 – $2,270
Heat risk 6/10 · Moderate
- Hot days now (above 101°F)
- 7 days/yr
- Hot days in 30 yrs
- 22 days/yr
Wind risk 2/10 · Minimal
- Chance of severe wind over 30 yrs
- 3.0%
Air-quality risk 1/10 · Minimal
- Unhealthy air days now
- 0 days/yr
- Unhealthy air days in 30 yrs
- 0 days/yr
Risk factors via First Street. Map © Google.
Why this score? — see what drove the B grade
The composite is a weighted blend of 9 inputs, each scored 0–100. Each bar is that input's sub-score; the figure is the points it added to the 100-point composite (weight × sub-score).
- Cash flow +30.0/30.0
- 1% rule +10.0/10.0
- DSCR +10.0/10.0
- ARV discount +7.5/15.0
- Livability +4.0/5.0
- Rent growth +3.6/5.0
- Schools +3.2/10.0
- Condition / age +2.5/5.0
- Appreciation +0.0/10.0
$200,000
🖨 Deal sheet 📄 Offer letter ✓ Due diligence
Multi-family units
County records classify this as Multi-Family (2-4 Unit). Listing-text estimate: 1 unit. estimate disagrees with records
Key facts
- 4,138 sq ft lot
- Garage
- Built 1983
Property features AI
Exterior
- Parking: Detached garage (1 car); Carport (1 car)
- Utilities: Public water; Public sewer
- Home design: Single-family residence; One story
- Construction: Brick veneer construction; Composition roof; Slab foundation; Built as single family (raw subtype: Single Family)
- Exterior features: Wood fencing; Shed(s) on the property; Lot approximately 0.095 acres
Interior
- Flooring: Tile
- Bathrooms: 2 full bathrooms
- Heating & cooling: Central heating (electric); Central air conditioning
- Interior features: Tile flooring; Wood-burning fireplace in the living room
Neighborhood map
What this means for you Summary
Snapshot
- This is a 2-bed/2.0-bath multifamily listed at $200k.
Deal economics
- At list price, monthly cash flow is $1k ($13k/yr) — positive.
- The deal already cash-flows at list — no discount required.
- Meets the 1% rule at list price ($3k rent vs $200k).
- Recommended offer: $197k (1.5% below list) — sets the bar for market timing.
- Cap rate 12.6% vs local median 4.7% in Midland — top-decile yield for the area; either an underpriced asset or a hidden risk that comps aren't pricing in. Stress-test before assuming the spread holds.
Location & tenants
- Location reads 79/100 on livability (#57 in TX, #2,192 nationally) — a middle-class / working-renter tenant base. Strengths: employment A+, housing A+, health & safety A+; Watch: crime C-, commute D+, amenities D.
- Midland ISD (urban): math 34% / reading 36% proficiency, ranked #477 of 826 in TX (top 58%) — families likely to look elsewhere, expect single-tenant / working-renter base with shorter leases.
- Zoned schools: Parker El (math 42% / reading 36%, grade F, #1,651 of 4,322 statewide, top 39%, 567 students, 52% FRL); Abell J H (math 32% / reading 43%, grade F, #736 of 1,662 statewide, top 45%, 1,095 students, 46% FRL); Legacy H S (math 37% / reading 3%, grade F, #1,397 of 1,632 statewide, top 87%, 2,504 students, 41% FRL) — zoned schools at 46% FRL track the district average.
- Market conditions: Rents rising fast (+4.5%/yr); 314 active listings in the ZIP; 40 comparable units currently listed for rent nearby; rentals at typical pace (median 21d on market — plan ~3-4 weeks tenant-placement turnaround); solid renter incomes; 1,504 units permitted in Midland County in 2024 (0 in 5+ unit buildings).
- This rent runs 37% of the median local income ($100k/yr) — at the standard rent-burdened threshold; future hikes will face affordability resistance.
Forward outlook
- Local home prices are declining (-3.0%/yr); year-one equity from $1k of loan paydown is wiped out by about $6k of value loss. Plan a longer hold.
- Midland County population projected at +83% by 2050 — long-run rental-demand tailwind backs the buy-and-hold thesis.
- At projected returns (-3.0% appreciation + 4.5% rent growth), your $56k cash investment doubles in ~6 years — after that, you're playing with house money.
Negotiation context
- It's been on market 20 days — a 2% lower offer ($197k) is reasonable based on typical stale-listing flexibility.
Risks & watch-outs
- Climate carrying-cost: major wildfire risk; extreme-heat days projected 7→22/yr by 2055 (HVAC capex compounding) — expect insurance premiums to compound above CPI over the hold.
Questions for the listing agent
- Is there a deadline driving the sale (1031 exchange, divorce, estate, relocation)? That informs how much negotiation room exists.
- What's the average days-on-market for RENTAL listings here right now (not sales)? A rising rental-DOM trend means longer vacancies and softer asking-rent achievability than the comps imply.
- What's the recent tenant-quality profile in this submarket — average credit score on applications, eviction rate, late-payment / NSF rate, and stable-employment percentage? A property-management company in the area should have these aggregated.
- How much new apartment / multifamily construction is in the pipeline within 1–3 miles? Heavy new supply (>2% of stock underway) typically softens rents 12–24 months out; light construction supports rent growth.
Investment metrics
- 1% rule
- 1.53% ✓
- Cap rate
- 12.57%
- Cash-on-cash
- 22.41%
- DSCR
- 2.00
- GRM
- 5.4
CMA / ARV
No comps found within radius.
Projected returns pro-forma
-3.0% appreciation · 4.45% rent growth · sell at horizon
- IRR
- 16.9%
- Equity multiple
- 1.69×
- Total profit
- $38,789
- Equity at exit
- $29,821
- IRR
- 26.4%
- Equity multiple
- 3.48×
- Total profit
- $138,903
- Equity at exit
- $17,292
Cash invested: $56,000 (down + closing). Projections, not guarantees.
Landlord ↔ Tenant lean methodology
- Overall (STATE)
- 87 Strongly Landlord-Friendly
- State Texas
- 87 Strongly Landlord-Friendly · R+5
- County
- — inherits STATE
- City
- — inherits STATE
ZIP-level market 79707
- Rents YoY
- 4.5%
- Active inventory
- 314
- Price-to-rent
- 10.9×
Monthly cashflow live
- Estimated rent
- $3,065 high interval (Pro) →
- Mortgage (P&I)
- −$1,049
- Tax from tax record
- −$243 /mo · $2,919/yr
- Insurance
- −$83
- HOA
- −$0
- Vacancy / Maint / Mgmt
- −$644
- Net cashflow
- $1,046
Break-even live
2-unit breakdown (identical units grouped — click to expand)
| Units | Beds | Baths | Est. rent |
|---|---|---|---|
| 2× units | 2 | 1 | $3,066 |
| #1 | 2 | 1 | $1,533 |
| #2 | 2 | 1 | $1,533 |
| Total (2 units) | $3,065 | ||
UW: 25.0% down · 7.5% · 30yr · 1.5% tax · 5.0% vac · 8.0% maint · 8.0% mgmt
Financing live
Cash to close
- Down payment
- $50,000
- Closing costs
- $6,000
- Reserves months
- —
- Total cash needed
- —
Loan-product check · same deal, 3 products live
Conventional
25% down · 7.5% · 30yr
- Down + closing
- —
- Monthly P&I
- —
- Monthly cashflow
- —
- DSCR
- —
- Eligible?
- —
Personal DTI + credit; lowest rate.
DSCR
20% down · 8.5% · 30yr
- Down + closing
- —
- Monthly P&I
- —
- Monthly cashflow
- —
- DSCR
- —
- Eligible?
- —
No personal income docs; deal must DSCR.
Hard money
10% down · 12.0% · 12mo
- Down + closing
- —
- Monthly P&I
- —
- Monthly cashflow
- —
- DSCR
- —
- Eligible?
- —
Short-term bridge; refi at stabilization.
Rent comps 40 comps
| Address | Beds | Baths | Sqft | Rent | $/sqft | DOM | Units | Dist |
|---|---|---|---|---|---|---|---|---|
| 4419 Fairgate Dr Midland, TX | 2.0 | 2.0 | 1620 | $1,800 | $1.11 | 20d | 1 | 0.13mi |
| 3417 N Midland Dr Midland, TX | 1.0–3.0 | 1.0–2.0 | 887 | $1,317 | $1.48 | 13d | 13 | 0.16mi |
| 3600 N Midland Dr Midland, TX | 1.0–2.0 | 1.0–2.0 | 900 | $1,425 | $1.58 | 13d | 9 | 0.26mi |
| 3705 Dentcrest Dr Midland, TX | 3.0 | 2.0 | 1402 | $1,800 | $1.28 | 13d | 1 | 0.29mi |
| 3214 Mark Ln Midland, TX | 3.0 | 2.0 | 1836 | $2,550 | $1.39 | 43d | 1 | 0.29mi |
| 3245 Preston Dr Midland, TX | 3.0 | 2.5 | 1608 | $2,000 | $1.24 | 43d | 1 | 0.30mi |
| 3309 Edgemont Dr Midland, TX | 3.0 | 2.0 | 1600 | $2,995 | $1.87 | 20d | 1 | 0.35mi |
| 3306 Oakmont Dr Midland, TX | 3.0 | 2.0 | 1791 | $2,500 | $1.40 | 20d | 1 | 0.38mi |
| 3208 Elma Dr Midland, TX | 3.0 | 2.5 | 1645 | $2,700 | $1.64 | 43d | 1 | 0.38mi |
| 4715 W Wadley Ave Midland, TX | 1.0–2.0 | 1.0–2.5 | 872 | $1,514 | $1.74 | 13d | 10 | 0.44mi |
| 4704 Dentcrest Dr Unit A Midland, TX | 2.0 | 2.0 | 1500 | $1,850 | $1.23 | 43d | 1 | 0.45mi |
| 3226 Whittle Way Midland, TX | 3.0 | 2.0 | 1850 | $4,250 | $2.30 | 20d | 1 | 0.50mi |
| 4800 Dentcrest Dr Midland, TX | 2.0 | 2.0 | 1148 | $1,999 | $1.74 | 43d | 1 | 0.51mi |
| 4713 Dentcrest Dr Unit A Midland, TX | 2.0 | 2.0 | 1400 | $3,250 | $2.32 | 20d | 1 | 0.51mi |
| 4027 Angelina Dr Midland, TX | 3.0 | 2.0 | 2228 | $2,900 | $1.30 | 13d | 1 | 0.56mi |
| 5106 Rio Grande Ave Midland, TX | 3.0 | 2.0 | 1924 | $2,650 | $1.38 | 44d | 1 | 0.61mi |
| 4805 Briarwood Ave Midland, TX | 1.0–3.0 | 1.0–2.0 | 1028 | $1,860 | $1.81 | 13d | 18 | 0.63mi |
| 5001 W Wadley Ave Midland, TX | 1.0–3.0 | 1.0–2.0 | 1098 | $2,158 | $1.96 | 13d | 17 | 0.64mi |
| 5244 West Loop 250 N Midland, TX | 1.0–2.0 | 1.0–2.0 | 791 | $1,749 | $2.21 | 13d | 34 | 0.66mi |
| 3002 Phillip Pl Midland, TX | 3.0 | 2.0 | 1579 | $2,400 | $1.52 | 43d | 1 | 0.66mi |
| 5117 San Antonio Ave Midland, TX | 3.0 | 2.0 | 1600 | $2,495 | $1.56 | 44d | 1 | 0.66mi |
| 5110 San Antonio Ave Midland, TX | 3.0 | 2.0 | 1510 | $2,600 | $1.72 | 20d | 1 | 0.67mi |
| 5114 San Antonio Ave Midland, TX | 3.0 | 2.0 | 1907 | $3,400 | $1.78 | 43d | 1 | 0.68mi |
| 3315 Godfrey St Midland, TX | 1.0–3.0 | 1.5–4.0 | 1764 | $2,125 | $1.20 | 13d | 8 | 0.71mi |
| 5207 San Antonio Ave Midland, TX | 3.0 | 2.0 | 1588 | $2,200 | $1.39 | 13d | 1 | 0.71mi |
| 2913 Sunburst Dr Midland, TX | 3.0 | 2.0 | 1655 | $2,400 | $1.45 | 20d | 1 | 0.85mi |
| 5108 Rainbow Rd Unit A Midland, TX | 3.0 | 2.0 | 1406 | $3,250 | $2.31 | 43d | 1 | 0.89mi |
| 2302 Wydewood Dr Midland, TX | 3.0 | 2.0 | 1748 | $2,500 | $1.43 | 43d | 1 | 0.90mi |
| 2202 Wydewood Dr Midland, TX | 3.0 | 3.0 | 1854 | $2,700 | $1.46 | 13d | 1 | 0.95mi |
| 5200 Briarwood Ave Midland, TX | 1.0–2.0 | 1.0–2.0 | 893 | $2,124 | $2.38 | 13d | 24 | 0.98mi |
| 4534 Sinclair Ave Midland, TX | 2.0 | 1.0–2.5 | 901 | $1,904 | $2.11 | 20d | 9 | 1.03mi |
| 3317 Providence Dr Midland, TX | 3.0 | 2.0 | 1810 | $2,500 | $1.38 | 43d | 1 | 1.10mi |
| 1902 N Midland Dr Midland, TX | 1.0–2.0 | 1.0–2.5 | 887 | $1,619 | $1.82 | 13d | 40 | 1.15mi |
| 1813 McDonald St Midland, TX | 3.0 | 2.0 | 1680 | $2,249 | $1.34 | 43d | 1 | 1.21mi |
| 3619 Boyd Ave Midland, TX | 3.0 | 2.0 | 1700 | $2,100 | $1.24 | 13d | 1 | 1.34mi |
| 3302 Fannin Ave Midland, TX | 3.0 | 2.0 | 1533 | $2,000 | $1.30 | 20d | 1 | 1.34mi |
| 4600 Andrews Hwy Midland, TX | 1.0–3.0 | 1.0–2.0 | 1117 | $2,040 | $1.83 | 43d | 5 | 1.40mi |
| 3209 W Wadley Ave Unit A Midland, TX | 3.0 | 2.0 | 1512 | $2,500 | $1.65 | 43d | 1 | 1.42mi |
| 3134 Tealwood Pl Midland, TX | 3.0 | 2.0 | 1974 | $2,500 | $1.27 | 20d | 1 | 1.43mi |
| 3601 Andrews Hwy Midland, TX | 2.0 | 1.0–2.0 | 800 | $1,615 | $2.02 | 13d | 16 | 1.46mi |
Listing history 17 events
-
2026-06-18status $200,000 Pending 20 DOM
-
2026-06-18days on market $200,000 Active Under Contract 20 DOM
-
2026-06-17days on market $200,000 Active Under Contract 19 DOM
-
2026-06-16days on market $200,000 Active Under Contract 18 DOM
-
2026-06-15days on market $200,000 Active Under Contract 17 DOM
-
2026-06-14days on market $200,000 Active Under Contract 15 DOM
-
2026-06-13days on market $200,000 Active Under Contract 14 DOM
-
2026-06-10days on market $200,000 Active Under Contract 12 DOM
-
2026-06-09days on market $200,000 Active Under Contract 11 DOM
-
2026-06-08days on market $200,000 Active Under Contract 10 DOM
-
2026-06-07days on market $200,000 Active Under Contract 9 DOM
-
2026-06-03days on market $200,000 Active Under Contract 5 DOM
-
2026-06-02days on market $200,000 Active Under Contract 4 DOM
-
2026-06-01days on market $200,000 Active Under Contract 3 DOM
-
2026-06-01status $200,000 Active Under Contract 2 DOM
-
2026-05-31days on market $200,000 Active 2 DOM
-
2026-05-30$200,000 Active 1 DOM
ⓘ Source: listings_history table (triggers on properties + properties_extension) + one-shot
backfill from property_details.listing_events for pre-trigger history.
Tax reassessment forecast TX · Resets to sale price
- Current annual tax
- $2,919 · $243/mo
- Projected year-2 tax
- $3,660 · $305/mo
- Expected delta
- +$741/yr (+$62/mo · 25.4%)
ⓘ Screening estimate from a state-policy table — verify with the county assessor before closing.
Climate risk First Street
- Flood 1/10 Low FEMA zone X · 0% chance over 30 yrs
- Wildfire 7/10 Severe
- Heat 6/10 Major 7 d/yr ≥101°F today · 22 d/yr by 30 yrs out
- Wind 2/10 Low 3% chance of damaging wind over 30 yrs
- Air quality 1/10 Low 0 unhealthy d/yr today · 0 by 30 yrs out
Nearby sold comps map
Loading sold comps map…
Walkable amenities ~0.75 mi
Loading nearby amenities…
Taxation est. · year 1
- Rental income
- $36,780
- − Mortgage interest
- −$11,203
- − Property taxes
- −$2,919
- − Insurance
- −$1,000
- − Repairs & maintenance
- −$2,942
- − Management
- −$2,942
- − Depreciation
- −$5,818
- Taxable income
- $9,955
- Est. tax owed @ 24.0%
- −$2,389
- After-tax cash flow
- $10,163/yr
For passive investors: Depreciation is non-cash, so a rental often shows a tax loss while cash-flowing — sheltering income. Rental losses are passive: they offset passive income freely, and up to $25,000/yr can offset ordinary (W-2) income if you actively participate and your MAGI is under $100k (phasing out to $0 by $150k); unused losses carry forward. On sale, claimed depreciation is recaptured at up to 25%, and gains may owe capital-gains tax (a 1031 exchange can defer both). Figures are a year-1 estimate at your 24.0% rate — not tax advice; consult a CPA.
Schools (NCES district)
- District
- Midland ISD
- NCES district ID
- 4830570
- Math proficiency
- 34% ▼ -7.00%
- Reading proficiency
- 36% ▬ 0.00%
- Median HH income
- $63,457
- Composite
- 31.63/100
- National rank
- #5938
- State rank
- #477 of 826 in TX
Livability — Midland
- Score
- 79/100
- State rank
- #57
- US rank
- #2192
Category grades
Schools grade is shown separately in the Schools card above.
Census & demographics
- Census place
- Midland, TX
- County
- Midland County · 168,494 people
- City population
- 168,494
- Metro
- Midland, TX
- Population (ZIP)
- 40,010
- Household income
- $99,886
- Rent vs Own
- Severe rent burden
- 1919.0
Population outlook (Midland County) Hauer SSP2
- Today (2025)
- 220,895 people
- By 2030
- 253,667 · +14.8%
- By 2040
- 325,498 · +47.4%
- By 2050
- 404,168 · +83.0%
- By 2075
- 609,802 · +176.1%
- By 2100
- 760,172 · +244.1%
Race, ethnicity, and origin ACS 2023
- Neighborhood character
- Diverse neighborhood (Simpson 0.58)
- Race & ethnicity
- White 56% Hispanic / Latino 31% Two or more races 11% Asian 5% Black 4%
- Hispanic origin (detail)
- Mexican 26% Cuban 1%
- Common ancestry
- Slovak 3% Lithuanian 2% Italian 1%
- Foreign-born
- 11% · Canada, China, Philippines
- Languages at home
- 79% English-only · Spanish 14% Other Asian/Pacific 2% Other Indo-European 1%
Political lean MEDSL · Midland
- 2024 margin
- Solid R (+60.5) · D 19.3% · R 79.8%
- 2008→2024 swing
- -3.3pp toward R · 2008: -57.3pp · 2024: -60.5pp
- All cycles
- 2024: R+60.5 2020: R+56.6 2016: R+55.2 2012: R+61.5 2008: R+57.3
Not yet ingested
- Civics
- —
Market trends
- HPI YoY
- ▼ -208.65%
- Current HPI
- 198.7489
- Rent YoY
- ▲ 4.45%
- Metro
- Midland, TX
- State GDP YoY
- ▲ 3.95%
- F500 in state
- 110
Industry mix (Fortune 500 HQ in TX)
| Industry | F500 HQs | Revenue |
|---|---|---|
| Energy | 16 | $1,198B |
|
||
| Technology | 5 | $198B |
|
||
| Engineering / Construction | 4 | $72B |
|
||
| Energy Services | 3 | $60B |
|
||
| Utilities | 3 | $41B |
|
||
| Healthcare | 2 | $330B |
|
||
Price history
3 events — show timeline
- 2026-05-29 Listed $200,000 PBBOR
- 2021-01-21 Sold (Public Records) — Public Records
- 2018-11-29 Sold (Public Records) — Public Records
Property tax history
+4.3%/yrLatest (2025): $2,919 · -6.5% YoY. Source: county tax records.
Cash-flow waterfall
monthlySold comps — $/sqft
last 12 mo · ≤1 miLoading sold comps…