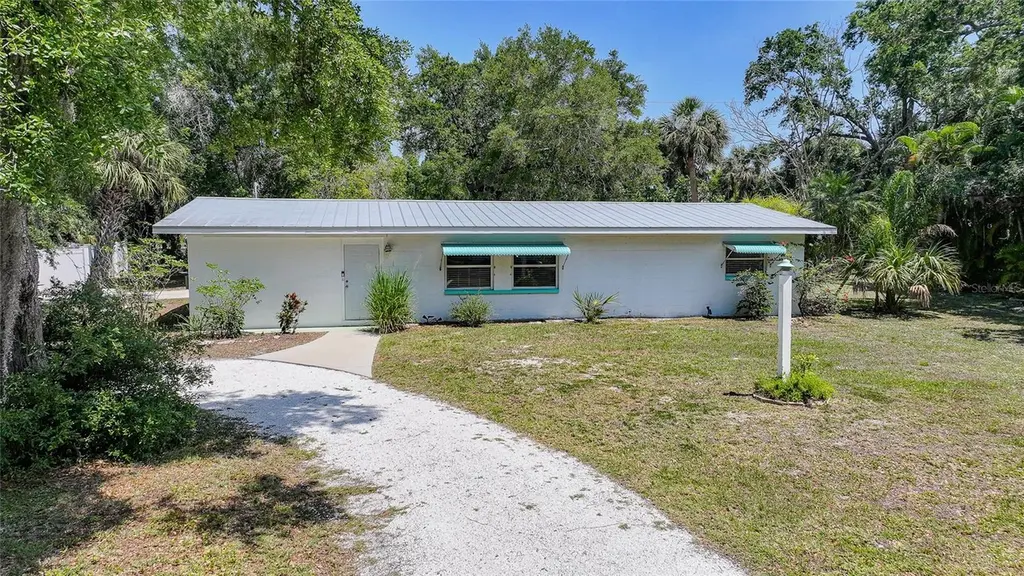
23040 Central Ave · Charlotte Harbor, FL
Flood risk 10/10 · Severe
- FEMA flood zone
- AE
- Chance of flooding over 30 yrs
- 0.99%
- Est. flood insurance / yr
- $1,737 – $8,500
Fire risk 1/10 · Minimal
- Est. fire insurance / yr
- $947 – $1,759
Heat risk 10/10 · Severe
- Hot days now (above 107°F)
- 6 days/yr
- Hot days in 30 yrs
- 22 days/yr
Wind risk 10/10 · Severe
- Chance of severe wind over 30 yrs
- 99.0%
Air-quality risk 3/10 · Minor
- Unhealthy air days now
- 2 days/yr
- Unhealthy air days in 30 yrs
- 2 days/yr
Risk factors via First Street. Map © Google.
Why this score? — see what drove the B- grade
The composite is a weighted blend of 9 inputs, each scored 0–100. Each bar is that input's sub-score; the figure is the points it added to the 100-point composite (weight × sub-score).
- Cash flow +30.0/30.0
- DSCR +10.0/10.0
- 1% rule +8.4/10.0
- ARV discount +7.5/15.0
- Schools +4.6/10.0
- Livability +3.4/5.0
- Condition / age +2.5/5.0
- Rent growth +1.5/5.0
- Appreciation +0.0/10.0
$199,900
🖨 Deal sheet (PDF) 📄 Offer letter ✓ Due diligence
Listing remarks MLS
Bank owned property being sold As Is. Freddie Mac First Policy- must be listed for 3 days prior to submitting any offers. Must be on the market for 20 days before any investor offers will be accepted. (FMFL expires 3/17/2014
Key facts
- Oversized corner lot
- Hurricane rated shed
- Waterfront location
Tags
Property features AI
Finance
- Other: Property type: Residential, single family; Zoning: CR3.5; Number of rooms: 7; Building area total approximately 2006 sq ft (living area 1616 sq ft); Furnished: Negotiable; Direction faces: Southwest; Listing contact phone available
- HOA & community: Pets allowed; No secondary association indicated
Exterior
- Parking: Boat parking; Circular driveway; Off-street parking; Parking pad
- Utilities: Public water; Public sewer; Electricity connected; Water connected; Sewer connected
- Home design: Single family residence; One story; Southwest facing; Completed condition
- Construction: Block construction; Metal roof; Block foundation; Built on a 0.32-acre oversized corner lot with paved, public-maintained concrete road access; Oak trees on property
- Exterior features: Covered screened rear porch; Private mailbox; Vinyl fencing; Shed(s); Workshop
Interior
- Kitchen: Dishwasher; Range; Microwave; Refrigerator; Exhaust fan; Electric water heater
- Bedrooms: 3 bedrooms
- Flooring: Concrete; Epoxy
- Bathrooms: 2 full bathrooms
- Heating & cooling: Central heating (electric); Central air conditioning
- Interior features: Ceiling fans; Eat-in kitchen; Open floorplan; Split bedroom layout; Inside utility room
- Laundry & utility: Washer hookup; Dryer hookup (electric); Inside laundry room
Neighborhood map
What this means for you Summary
Snapshot
- This is a 3-bed/2.0-bath single-family listed at $200k.
Deal economics
- At list price, monthly cash flow is $334 ($4k/yr) — positive.
- The deal already cash-flows at list — no discount required.
- Meets the 1% rule at list price ($3k rent vs $200k).
- Recommended offer: $188k (6.0% below list) — sets the bar for market timing.
Location & tenants
- Location reads 68/100 on livability (#536 in FL) — a middle-class / working-renter tenant base. Strengths: cost of living A+, housing A+, crime A-; Watch: employment D+, amenities F, commute F.
- Charlotte (suburban): math 54% / reading 54% proficiency, ranked #22 of 73 in FL (top 30%) — acceptable for families but not a draw, mixed tenant base, ~2y average lease.
- Zoned schools: Peace River Elementary School (math 56% / reading 54%, grade C, #872 of 2,144 statewide, top 42%, 581 students, 64% FRL); Port Charlotte Middle School (math 59% / reading 50%, grade B-, #183 of 571 statewide, top 34%, 877 students, 55% FRL); Charlotte High School (math 44% / reading 46%, grade D-, #228 of 667 statewide, top 35%, 1,994 students, 41% FRL) — zoned schools at 53% FRL track the district average.
- Market conditions: Rents falling (-4.0%/yr); 603 active listings in the ZIP; 21 comparable units currently listed for rent nearby; rentals at typical pace (median 23d on market — plan ~3-4 weeks tenant-placement turnaround); 4,585 units permitted in Charlotte County in 2024 (703 in 5+ unit buildings).
- At $2,687/mo this rent would consume 51% of the median local household income ($64k/yr) (locally 612% of renters already pay >50% of income on rent) — very limited rent-growth headroom before tenants either downsize or default.
Forward outlook
- Local home prices are declining (-3.0%/yr); year-one equity from $1k of loan paydown is wiped out by about $6k of value loss. Plan a longer hold.
- Charlotte County population projected at +24% by 2050 — long-run rental-demand tailwind backs the buy-and-hold thesis.
Negotiation context
- It's been on market 62 days — a 6% lower offer ($188k) is reasonable based on typical stale-listing flexibility.
- 8 sale attempts since 21y ago; this cycle's ask has dropped $30k (13%) from the opening price — seller is motivated, your offer sets the floor, not the list.
- Current owner paid $75k; list at $200k implies a 167% gain — meaningful room to come down on a strong offer.
Risks & watch-outs
- Watch-outs: flood insurance adds $427/mo; built in 1958 — expect roof / HVAC / electrical / plumbing capex.
- Climate carrying-cost: in FEMA flood zone AE (mandatory federal flood insurance); severe wind risk, 99% chance of damaging wind over 30y; extreme-heat days projected 6→22/yr by 2055 (HVAC capex compounding) — expect insurance premiums to compound above CPI over the hold.
Questions for the listing agent
- It's been on market 62 days. Have you received any prior offers? Is the seller open to a 6% concession, seller financing, or rate buy-down credit?
- Built in 1958 — when were the roof, HVAC, electrical panel, plumbing, and water heater last replaced?
- What's the actual annual flood-insurance premium (NFIP or private), and is the property in a SFHA with mandatory coverage?
- Why hasn't it sold? Are there any deal-killer items the seller is aware of (foundation, flood, title, zoning, code violations)?
- Is there a deadline driving the sale (1031 exchange, divorce, estate, relocation)? That informs how much negotiation room exists.
- Schools are F-rated, which usually means shorter tenancies and higher turnover. Who's the typical renter profile here, and what's been the actual vacancy rate?
- What's the average days-on-market for RENTAL listings here right now (not sales)? A rising rental-DOM trend means longer vacancies and softer asking-rent achievability than the comps imply.
- What's the recent tenant-quality profile in this submarket — average credit score on applications, eviction rate, late-payment / NSF rate, and stable-employment percentage? A property-management company in the area should have these aggregated.
- How much new for-sale + rental construction is in the pipeline within 1–3 miles? Heavy new supply typically softens prices + rents 12–24 months out; constrained supply supports both.
Investment metrics
- 1% rule
- 1.34% ✓
- Cap rate
- 10.86%
- Cash-on-cash
- 16.31%
- DSCR
- 1.73
- GRM
- 6.2
CMA / ARV
No comps found within radius.
Projected returns pro-forma
-3.0% appreciation · 0.0% rent growth · sell at horizon
- IRR
- -9.5%
- Equity multiple
- 0.67×
- Total profit
- $-18,698
- Equity at exit
- $29,806
- IRR
- -6.0%
- Equity multiple
- 0.68×
- Total profit
- $-18,132
- Equity at exit
- $17,284
Cash invested: $55,972 (down + closing). Projections, not guarantees.
Landlord ↔ Tenant lean methodology
- Overall (STATE)
- 87 Strongly Landlord-Friendly
- State Florida
- 87 Strongly Landlord-Friendly · R+3
- County
- — inherits STATE
- City
- — inherits STATE
ZIP-level market 33980
- Home prices YoY
- -5.0%
- Rents YoY
- -4.0%
- Active inventory
- 603
- Price-to-rent
- 6.2×
Monthly cashflow live
- Estimated rent
- $2,687 high interval (Pro) →
- Mortgage (P&I)
- −$1,048
- Tax from tax record
- −$230 /mo · $2,764/yr
- Insurance
- −$83
- Flood insurance flood zone
- −$427 /mo · $5,118/yr
- HOA
- −$0
- Vacancy / Maint / Mgmt
- −$564
- Net cashflow
- $334
Break-even live
Sensitivity live
| Price | -10% $447 | -5% $391 | +0% $334 | +5% $277 | +10% $221 |
|---|---|---|---|---|---|
| Rent | -10% $122 | -5% $228 | +0% $334 | +5% $440 | +10% $546 |
| Rate | -1.0pp $435 | -0.5pp $385 | base $334 | +0.5pp $282 | +1.0pp $230 |
UW: 25.0% down · 7.5% · 30yr · 1.5% tax · 5.0% vac · 8.0% maint · 8.0% mgmt
Financing live
Cash to close
- Down payment
- $49,975
- Closing costs
- $5,997
- Reserves months
- —
- Total cash needed
- —
Loan-product check · same deal, 3 products live
Conventional
25% down · 7.5% · 30yr
- Down + closing
- —
- Monthly P&I
- —
- Monthly cashflow
- —
- DSCR
- —
- Eligible?
- —
Personal DTI + credit; lowest rate.
DSCR
20% down · 8.5% · 30yr
- Down + closing
- —
- Monthly P&I
- —
- Monthly cashflow
- —
- DSCR
- —
- Eligible?
- —
No personal income docs; deal must DSCR.
Hard money
10% down · 12.0% · 12mo
- Down + closing
- —
- Monthly P&I
- —
- Monthly cashflow
- —
- DSCR
- —
- Eligible?
- —
Short-term bridge; refi at stabilization.
Rent comps 21 comps
| Address | Beds | Baths | Sqft | Rent | $/sqft | DOM | Units | Dist |
|---|---|---|---|---|---|---|---|---|
| 5119 Melbourne St Unit C201 Punta Gorda, FL | 3.0 | 2.5 | 1831 | $4,500 | $2.46 | 22d | 1 | 0.58mi |
| 5119 Melbourne St Unit Reservation spot 1 Port Charlotte, FL | 3.0 | 2.0 | 1831 | $4,500 | $2.46 | 22d | 1 | 0.58mi |
| 5125 Melbourne St Unit E201 Punta Gorda, FL | 3.0 | 2.5 | 1831 | $1,750 | $0.96 | 15d | 1 | 0.60mi |
| 5125 Melbourne St Unit E201 Punta Gorda, FL | 3.0 | 2.5 | 1831 | $1,750 | $0.96 | 22d | 1 | 0.60mi |
| 5125 Melbourne St Unit E-305 Port Charlotte, FL | 3.0 | 2.5 | 1956 | $2,800 | $1.43 | 22d | 1 | 0.61mi |
| 5117 Melbourne St Unit B4302 Port Charlotte, FL | 3.0 | 2.5 | 1759 | $2,500 | $1.42 | 22d | 1 | 0.61mi |
| 5116 Melbourne St Unit B204 Punta Gorda, FL | 3.0 | 2.5 | 1759 | $2,500 | $1.42 | 15d | 1 | 0.71mi |
| 5116 Melbourne St Unit B303 Punta Gorda, FL | 3.0 | 2.5 | 1759 | $5,000 | $2.84 | 15d | 1 | 0.71mi |
| 23491 Harper Ave Punta Gorda, FL | 3.0 | 2.0 | 1382 | $1,450 | $1.05 | 22d | 1 | 0.86mi |
| 23465 Harborview Rd Port Charlotte, FL | 2.0 | 2.0 | 1480 | $1,975 | $1.33 | 22d | 2 | 0.90mi |
| 22497 Glen Ave Punta Gorda, FL | 3.0 | 2.0 | 1628 | $1,875 | $1.15 | 22d | 1 | 0.93mi |
| 189 Small St SE Port Charlotte, FL | 3.0 | 2.0 | 1454 | $2,300 | $1.58 | 22d | 1 | 0.98mi |
| 22328 Yonkers Ave Port Charlotte, FL | 2.0 | 2.0 | 1342 | $1,575 | $1.17 | 22d | 1 | 1.05mi |
| 181 Beeney Rd SE Port Charlotte, FL | 4.0 | 2.5 | 1846 | $4,900 | $2.65 | 22d | 1 | 1.15mi |
| 23067 Elmira Blvd Punta Gorda, FL | 2.0 | 2.0 | 1052 | $1,750 | $1.66 | 22d | 1 | 1.22mi |
| 510 Sharon Cir Port Charlotte, FL | 2.0 | 2.0 | 1204 | $1,500 | $1.25 | 22d | 1 | 1.26mi |
| 480 Sharon Cir Port Charlotte, FL | 3.0 | 1.0 | 1240 | $1,695 | $1.37 | 22d | 1 | 1.30mi |
| 835 Conreid Dr NE Port Charlotte, FL | 3.0 | 2.0 | 1962 | $2,200 | $1.12 | 22d | 1 | 1.39mi |
| 240 Dalton Blvd Port Charlotte, FL | 3.0 | 2.0 | 1513 | $1,600 | $1.06 | 22d | 1 | 1.45mi |
| 511 Palmetto Dr NE Port Charlotte, FL | 3.0 | 2.0 | 1216 | $2,100 | $1.73 | 22d | 1 | 1.47mi |
| 21484 Edgewater Dr Port Charlotte, FL | 3.0 | 2.0 | 1731 | $2,500 | $1.44 | 22d | 1 | 1.47mi |
Listing history 37 events
-
2026-06-22pricedays on market $199,900 Active 62 DOM
-
2026-06-18days on market $214,900 Active 59 DOM
-
2026-06-17days on market $214,900 Active 58 DOM
-
2026-06-16days on market $214,900 Active 57 DOM
-
2026-06-15days on market $214,900 Active 56 DOM
-
2026-06-14days on market $214,900 Active 54 DOM
-
2026-06-13pricedays on market $214,900 Active 53 DOM
-
2026-06-10days on market $219,900 Active 51 DOM
-
2026-06-09days on market $219,900 Active 50 DOM
-
2026-06-08days on market $219,900 Active 49 DOM
-
2026-06-07pricedays on market $219,900 Active 48 DOM
-
2026-06-05days on market $224,900 Active 45 DOM
-
2026-06-03days on market $224,900 Active 44 DOM
-
2026-06-02days on market $224,900 Active 43 DOM
-
2026-06-01days on market $224,900 Active 42 DOM
-
2026-05-31days on market $224,900 Active 41 DOM
-
2026-05-30days on market $224,900 Active 40 DOM
-
2026-05-19price $224,900
-
2026-05-11price $219,900
-
2026-05-06price $226,900
-
2026-04-24status Active
-
2026-04-20status Pending
-
2026-04-16$229,900 Active
-
2024-12-16historical
-
2024-11-25status Active
-
2024-11-19status Pending
-
2024-11-14price $199,900
-
2024-11-02$249,900 Active
-
2014-05-05historical 224-char remark
Show marketing remark (224 chars)
Bank owned property being sold As Is. Freddie Mac First Policy- must be listed for 3 days prior to submitting any offers. Must be on the market for 20 days before any investor offers will be accepted. (FMFL expires 3/17/2014
-
2014-04-01soldstatus $75,000 Sold 224-char remark
Show marketing remark (224 chars)
Bank owned property being sold As Is. Freddie Mac First Policy- must be listed for 3 days prior to submitting any offers. Must be on the market for 20 days before any investor offers will be accepted. (FMFL expires 3/17/2014
-
2014-02-25$89,900 224-char remark
Show marketing remark (224 chars)
Bank owned property being sold As Is. Freddie Mac First Policy- must be listed for 3 days prior to submitting any offers. Must be on the market for 20 days before any investor offers will be accepted. (FMFL expires 3/17/2014
-
2010-04-08historical
-
2009-12-07$155,000
-
2006-06-27$290,000
-
2005-09-13$290,000
-
2004-03-29soldstatus $149,900
-
1989-04-01soldstatus $58,000
ⓘ Source: listings_history table (triggers on properties + properties_extension) + one-shot
backfill from property_details.listing_events for pre-trigger history.
Tax reassessment forecast FL · Resets to sale price
- Current annual tax
- $2,764 · $230/mo
- Projected year-2 tax
- $2,764 · $230/mo
- Expected delta
- $0/yr ($0/mo · 0.0%)
ⓘ Screening estimate from a state-policy table — verify with the county assessor before closing.
Climate risk First Street
- Flood 10/10 Extreme FEMA zone AE · 99% chance over 30 yrs
- Wildfire 1/10 Low
- Heat 10/10 Extreme 6 d/yr ≥107°F today · 22 d/yr by 30 yrs out
- Wind 10/10 Extreme 99% chance of damaging wind over 30 yrs
- Air quality 3/10 Moderate 2 unhealthy d/yr today · 2 by 30 yrs out
Nearby sold comps map
Loading sold comps map…
Walkable amenities ~0.75 mi
Loading nearby amenities…
Taxation est. · year 1
- Rental income
- $32,241
- − Mortgage interest
- −$11,198
- − Property taxes
- −$2,764
- − Insurance
- −$6,118
- − Repairs & maintenance
- −$2,579
- − Management
- −$2,579
- − Depreciation
- −$5,815
- Taxable income
- $1,188
- Est. tax owed @ 24.0%
- −$285
- After-tax cash flow
- $3,724/yr
For passive investors: Depreciation is non-cash, so a rental often shows a tax loss while cash-flowing — sheltering income. Rental losses are passive: they offset passive income freely, and up to $25,000/yr can offset ordinary (W-2) income if you actively participate and your MAGI is under $100k (phasing out to $0 by $150k); unused losses carry forward. On sale, claimed depreciation is recaptured at up to 25%, and gains may owe capital-gains tax (a 1031 exchange can defer both). Figures are a year-1 estimate at your 24.0% rate — not tax advice; consult a CPA.
Schools (NCES district)
- District
- Charlotte
- NCES district ID
- 1200240
- Math proficiency
- 54% ▼ -6.00%
- Reading proficiency
- 54% ▼ -1.00%
- Median HH income
- $44,864
- Composite
- 45.62/100
- National rank
- #2586
- State rank
- #22 of 73 in FL
Livability — Charlotte Harbor
- Score
- 68/100
- State rank
- #536
- US rank
- #10043
Category grades
Schools grade is shown separately in the Schools card above.
Census & demographics
- Census place
- Charlotte Harbor, FL
- County
- Charlotte County · 196,994 people
- Metro
- Punta Gorda, FL
- Population (ZIP)
- 13,120
- Household income
- $63,591
- Rent vs Own
- Severe rent burden
- 612.0
Population outlook (Charlotte County) Hauer SSP2
- Today (2025)
- 198,646 people
- By 2030
- 210,507 · +6.0%
- By 2040
- 230,857 · +16.2%
- By 2050
- 247,148 · +24.4%
- By 2075
- 281,777 · +41.8%
- By 2100
- 293,609 · +47.8%
Race, ethnicity, and origin ACS 2023
- Neighborhood character
- Predominantly White (75%)
- Race & ethnicity
- White 75% Hispanic / Latino 10% Two or more races 10% Black 9%
- Hispanic origin (detail)
- Puerto Rican 3% Cuban 2% Dominican 2%
- Common ancestry
- Romanian 5% Hispanic 4% Slovak 3%
- Foreign-born
- 16% · Canada, Jamaica
- Languages at home
- 85% English-only · Spanish 8% French/Haitian/Cajun 5% German/W. Germanic 1%
Political lean MEDSL · Charlotte
- 2024 margin
- Solid R (+34.0) · D 32.7% · R 66.7%
- 2008→2024 swing
- -26.7pp toward R · 2008: -7.2pp · 2024: -34.0pp
- All cycles
- 2024: R+34.0 2020: R+26.6 2016: R+27.8 2012: R+14.3 2008: R+7.2
Not yet ingested
- Civics
- —
Market trends
- HPI YoY
- ▼ -16.02%
- Current HPI
- 306.3331
- Rent YoY
- ▼ -4.04%
- Metro
- Punta Gorda, FL
- State GDP YoY
- ▲ 3.28%
- F500 in state
- 36
Industry mix (Fortune 500 HQ in FL)
| Industry | F500 HQs | Revenue |
|---|---|---|
| Industrial Technology | 2 | $29B |
|
||
| Insurance | 2 | $17B |
|
||
| Retail | 1 | $60B |
|
||
| Technology Distribution | 1 | $58B |
|
||
| Homebuilding | 1 | $35B |
|
||
| Technology Manufacturing | 1 | $35B |
|
||
Price history
+287.8% since first listed20 events — show timeline
- 2026-05-19 Price Changed $224,900 Stellar MLS as Distributed by MLS Grid
- 2026-05-11 Price Changed $219,900 Stellar MLS as Distributed by MLS Grid
- 2026-05-06 Price Changed $226,900 Stellar MLS as Distributed by MLS Grid
- 2026-04-24 Relisted — Stellar MLS as Distributed by MLS Grid
- 2026-04-20 Pending — Stellar MLS as Distributed by MLS Grid
- 2026-04-16 Listed $229,900 Stellar MLS as Distributed by MLS Grid
- 2024-12-16 Listing Removed — Stellar MLS as Distributed by MLS Grid
- 2024-11-25 Relisted — Stellar MLS as Distributed by MLS Grid
- 2024-11-19 Pending — Stellar MLS as Distributed by MLS Grid
- 2024-11-14 Price Changed $199,900 Stellar MLS as Distributed by MLS Grid
- 2024-11-02 Listed $249,900 Stellar MLS as Distributed by MLS Grid
- 2014-05-05 Listing Removed — Stellar MLS as Distributed by MLS Grid
- 2014-04-01 Sold (MLS) $75,000 Stellar MLS as Distributed by MLS Grid
- 2014-02-25 Listed $89,900 Stellar MLS as Distributed by MLS Grid
- 2010-04-08 Listing Removed — Stellar MLS as Distributed by MLS Grid
- 2009-12-07 Listed $155,000 Stellar MLS as Distributed by MLS Grid
- 2006-06-27 Listed $290,000 Stellar MLS as Distributed by MLS Grid
- 2005-09-13 Listed $290,000 Stellar MLS as Distributed by MLS Grid
- 2004-03-29 Sold (Public Records) $149,900 Public Records
- 1989-04-01 Sold (Public Records) $58,000 Public Records
Property tax history
+9.0%/yrLatest (2025): $2,764 · -3.9% YoY. Source: county tax records.
Cash-flow waterfall
monthlySold comps — $/sqft
last 12 mo · ≤1 miLoading sold comps…