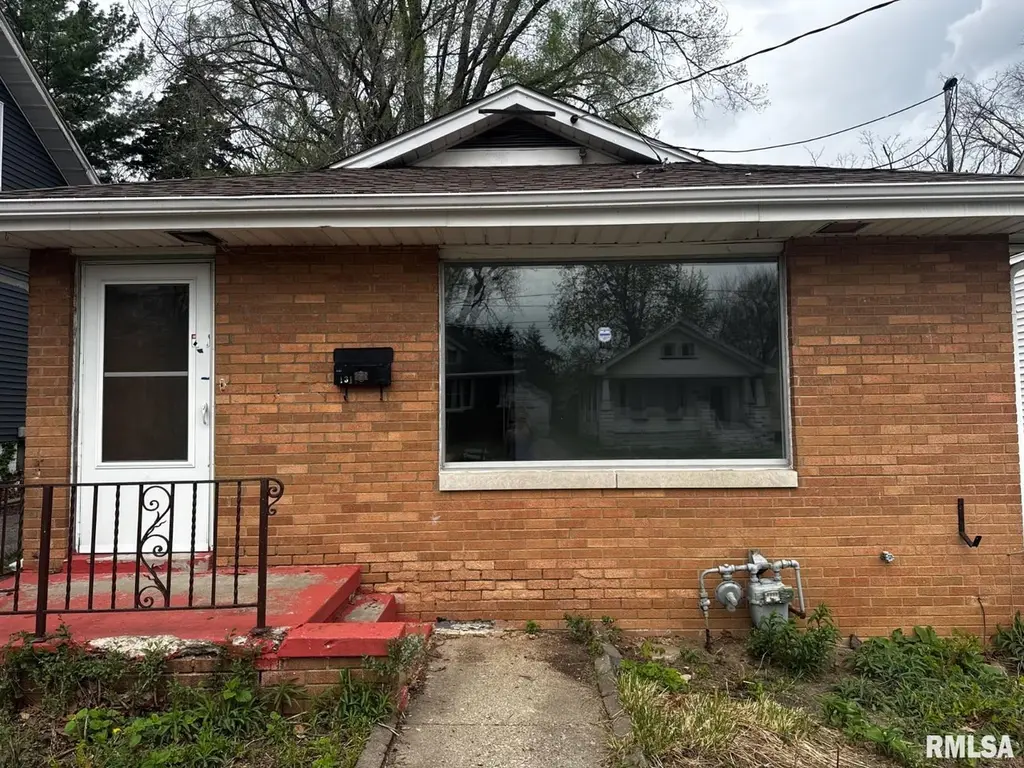
1131 W Nowland Ave · Peoria, IL
Flood risk 1/10 · Minimal
- FEMA flood zone
- X
- Chance of flooding over 30 yrs
- 0.0%
- Est. flood insurance / yr
- $473 – $860
Fire risk 1/10 · Minimal
- Est. fire insurance / yr
- $804 – $1,492
Heat risk 3/10 · Minor
- Hot days now (above 105°F)
- 7 days/yr
- Hot days in 30 yrs
- 18 days/yr
Wind risk 2/10 · Minimal
- Chance of severe wind over 30 yrs
- 1.0%
Air-quality risk 3/10 · Minor
- Unhealthy air days now
- 1 days/yr
- Unhealthy air days in 30 yrs
- 3 days/yr
Risk factors via First Street. Map © Google.
Why this score? — see what drove the C+ grade
The composite is a weighted blend of 9 inputs, each scored 0–100. Each bar is that input's sub-score; the figure is the points it added to the 100-point composite (weight × sub-score).
- Cash flow +27.1/30.0
- DSCR +9.4/10.0
- 1% rule +8.2/10.0
- ARV discount +7.5/15.0
- Livability +3.7/5.0
- Rent growth +3.1/5.0
- Condition / age +2.5/5.0
- Schools +1.1/10.0
- Appreciation +0.0/10.0
$64,900
🖨 Deal sheet 📄 Offer letter ✓ Due diligence
Listing remarks MLS
Charming all brick ranch home with fenced yard. Bedroom has double closets and ceiling fan. Spacious room sizes, new flooring and fresh paint. Full, unfinished basement. Don't miss out on this great home!
Key facts
- 4,860 sq ft lot
- Garage
- Built 1956
Neighborhood map
What this means for you Summary
Snapshot
- This is a 1-bed/2.0-bath single-family listed at $65k.
Deal economics
- At list price, monthly cash flow is $183 ($2k/yr) — positive.
- The deal already cash-flows at list — no discount required.
- Meets the 1% rule at list price ($855 rent vs $65k).
- Recommended offer: $63k (3.0% below list) — sets the bar for market timing.
- Cap rate 9.7% vs local median 5.6% in Peoria — top-decile yield for the area; either an underpriced asset or a hidden risk that comps aren't pricing in. Stress-test before assuming the spread holds.
Location & tenants
- Location reads 73/100 on livability (#270 in IL) — a middle-class / working-renter tenant base. Strengths: commute A+, cost of living A+, housing A+; Watch: employment D+, schools F, crime F.
- Peoria SD 150 (urban): math 11% / reading 14% proficiency, ranked #554 of 620 in IL (top 89%) — low school quality limits family demand, transient renter base, plan for 1-2y turnover; 70% free/reduced lunch — lower-income household profile, screen leases tightly.
- Market conditions: Rents rising (+2.3%/yr); 180 active listings in the ZIP; 20 comparable units currently listed for rent nearby; rentals lingering (median 44d on market — plan ~5-8 weeks vacancy on turnover, expect pricing pressure); 50% of comp listings sitting > 30 days — soft ceiling on asking rent; 73 units permitted in Peoria County in 2024 (0 in 5+ unit buildings).
Forward outlook
- Local home prices are declining (-3.0%/yr); year-one equity from $449 of loan paydown is wiped out by about $2k of value loss. Plan a longer hold.
- Peoria County population projected at -11% by 2050 — secular population decline; favor cash flow + early exit over multi-decade hold.
Negotiation context
- It's been on market 48 days — a 3% lower offer ($63k) is reasonable based on typical stale-listing flexibility.
- 2 sale attempts since 25y ago; this cycle's ask has dropped $10k (13%) from the opening price — seller is motivated, your offer sets the floor, not the list.
Risks & watch-outs
- Watch-outs: built in 1956 — expect roof / HVAC / electrical / plumbing capex.
Questions for the listing agent
- It's been on market 48 days. Have you received any prior offers? Is the seller open to a 3% concession, seller financing, or rate buy-down credit?
- Built in 1956 — when were the roof, HVAC, electrical panel, plumbing, and water heater last replaced?
- Is there a deadline driving the sale (1031 exchange, divorce, estate, relocation)? That informs how much negotiation room exists.
- Schools are F-rated, which usually means shorter tenancies and higher turnover. Who's the typical renter profile here, and what's been the actual vacancy rate?
- Crime grade is F in this area — have there been break-ins, vandalism, or insurance claims at this property in the last 3 years? What carrier currently insures it and at what premium?
- What's the average days-on-market for RENTAL listings here right now (not sales)? A rising rental-DOM trend means longer vacancies and softer asking-rent achievability than the comps imply.
- What's the recent tenant-quality profile in this submarket — average credit score on applications, eviction rate, late-payment / NSF rate, and stable-employment percentage? A property-management company in the area should have these aggregated.
- How much new for-sale + rental construction is in the pipeline within 1–3 miles? Heavy new supply typically softens prices + rents 12–24 months out; constrained supply supports both.
Investment metrics
- 1% rule
- 1.32% ✓
- Cap rate
- 9.68%
- Cash-on-cash
- 12.09%
- DSCR
- 1.54
- GRM
- 6.3
CMA / ARV
- ARV (median comp)
- $42,065
- List price
- $64,900
- Delta
- 54.29%
- Verdict
- OVERPRICED
- Comps
- 20 within 1.0 mi
Show comp detail 12 sales within ~0.75 mi
| Address | Dist | Beds/Ba | Sqft | Sold | Price | $/sf | Match |
|---|---|---|---|---|---|---|---|
| 1131 W Nowland Ave | 0.00mi | 1/1.0 | 880 (0%) | 0mo | $53,500 | $61 | 96 |
| 1214 W Brons Ave | 0.15mi | 2/1.0 (+1) | 864 (-2%) | 2mo | $34,900 | $40 | 80 |
| 1126 Thrush Ave | 0.09mi | 2/1.0 (+1) | 952 (+8%) | 1mo | $62,500 | $66 | 72 |
| 1126 W Gilbert Ave | 0.42mi | 2/1.0 (+1) | 878 (-0%) | 2mo | $89,900 | $102 | 69 |
| 1417 W Mcclure Ave | 0.27mi | 2/1.0 (+1) | 947 (+8%) | 3mo | $119,075 | $126 | 63 |
| 2332 N Ellis St | 0.48mi | 2/1.0 (+1) | 840 (-4%) | 2mo | $24,000 | $29 | 60 |
| 2318 N Ellis St | 0.47mi | 2/1.0 (+1) | 842 (-4%) | 3mo | $31,000 | $37 | 60 |
| 2314 N Ellis St | 0.47mi | 2/1.0 (+1) | 928 (+6%) | 3mo | $18,500 | $20 | 57 |
| 1017 W Gilbert Ave | 0.46mi | 2/1.0 (+1) | 816 (-7%) | 2mo | $20,000 | $25 | 56 |
| 1419 W Margaret Ave | 0.58mi | 2/1.0 (+1) | 936 (+6%) | 1mo | $113,000 | $121 | 53 |
| 910 W Virginia Ave | 0.25mi | 2/1.0 (+1) | 748 (-15%) | 3mo | $60,000 | $80 | 52 |
| 2318 N Flora Ave | 0.53mi | 2/1.0 (+1) | 768 (-13%) | 2mo | $90,000 | $117 | 43 |
Match score weights: distance 35% · size 25% · config 20% · recency 20%. Top-matched comps best support the ARV.
Projected returns pro-forma
-3.0% appreciation · 2.3% rent growth · sell at horizon
- IRR
- 0.9%
- Equity multiple
- 1.03×
- Total profit
- $585
- Equity at exit
- $9,677
- IRR
- 9.8%
- Equity multiple
- 1.73×
- Total profit
- $13,266
- Equity at exit
- $5,611
Cash invested: $18,172 (down + closing). Projections, not guarantees.
Landlord ↔ Tenant lean methodology
- Overall (STATE)
- 43 Moderately Tenant-Leaning
- State Illinois
- 43 Moderately Tenant-Leaning · D+7
- County
- — inherits STATE
- City
- — inherits STATE
ZIP-level market 61604
- Home prices YoY
- -24.6%
- Rents YoY
- 2.3%
- Active inventory
- 180
- Price-to-rent
- 6.3×
Monthly cashflow live
- Estimated rent
- $855 high interval (Pro) →
- Mortgage (P&I)
- −$340
- Tax from tax record
- −$125 /mo · $1,503/yr
- Insurance
- −$27
- HOA
- −$0
- Vacancy / Maint / Mgmt
- −$180
- Net cashflow
- $183
Break-even live
UW: 25.0% down · 7.5% · 30yr · 1.5% tax · 5.0% vac · 8.0% maint · 8.0% mgmt
Financing live
Cash to close
- Down payment
- $16,225
- Closing costs
- $1,947
- Reserves months
- —
- Total cash needed
- —
Loan-product check · same deal, 3 products live
Conventional
25% down · 7.5% · 30yr
- Down + closing
- —
- Monthly P&I
- —
- Monthly cashflow
- —
- DSCR
- —
- Eligible?
- —
Personal DTI + credit; lowest rate.
DSCR
20% down · 8.5% · 30yr
- Down + closing
- —
- Monthly P&I
- —
- Monthly cashflow
- —
- DSCR
- —
- Eligible?
- —
No personal income docs; deal must DSCR.
Hard money
10% down · 12.0% · 12mo
- Down + closing
- —
- Monthly P&I
- —
- Monthly cashflow
- —
- DSCR
- —
- Eligible?
- —
Short-term bridge; refi at stabilization.
Rent comps 20 comps
| Address | Beds | Baths | Sqft | Rent | $/sqft | DOM | Units | Dist |
|---|---|---|---|---|---|---|---|---|
| 2214 N Linsley St Peoria, IL | 2.0 | 1.0 | 575 | $550 | $0.96 | 43d | 1 | 0.10mi |
| 905 W Thrush Ave Peoria, IL | 2.0 | 1.0 | 750 | $950 | $1.27 | 21d | 1 | 0.22mi |
| 812 W Macqueen Ave Peoria, IL | 2.0 | 1.0 | 822 | $795 | $0.97 | 43d | 1 | 0.28mi |
| 2207 N Ellis St Peoria, IL | 2.0 | 1.0 | 864 | $999 | $1.16 | 13d | 1 | 0.46mi |
| 1703 N Valley Ave Peoria, IL | 2.0 | 1.0 | 676 | $1,200 | $1.78 | 13d | 1 | 0.54mi |
| 2610 N Renwood Ave Peoria, IL | 2.0 | 1.0 | 904 | $1,300 | $1.44 | 13d | 1 | 1.06mi |
| 511 W Elizabeth St Unit A Peoria, IL | 1.0 | 1.0 | 850 | $800 | $0.94 | 43d | 1 | 1.07mi |
| 1505 N Peoria Ave Peoria, IL | 1.0 | 1.0 | 525 | $1,006 | $1.92 | 13d | 4 | 1.22mi |
| 2920 N Rockwood Dr Apt B Peoria, IL | 2.0 | 1.0 | 800 | $895 | $1.12 | 13d | 1 | 1.25mi |
| 2511 W Wardcliffe Dr Unit H Peoria, IL | 2.0 | 1.0 | 800 | $875 | $1.09 | 43d | 1 | 1.26mi |
| 911 N Sheridan Rd Unit a1 Peoria, IL | 2.0 | 1.0 | 825 | $850 | $1.03 | 13d | 1 | 1.27mi |
| 911 N Sheridan Rd Unit A4 Peoria, IL | 2.0 | 1.0 | 825 | $850 | $1.03 | 43d | 1 | 1.27mi |
| 905 N Sheridan Rd Unit F Peoria, IL | 1.0 | 1.0 | 650 | $900 | $1.38 | 43d | 1 | 1.28mi |
| 416 W Main St Unit A Peoria, IL | 2.0 | 1.0 | 1050 | $950 | $0.90 | 43d | 1 | 1.28mi |
| W Crestwood Dr Peoria, IL | 1.0–2.0 | 1.0 | 800 | $850 | $1.06 | 13d | 4 | 1.38mi |
| 3629 N Leroy Ave Unit A Peoria, IL | 2.0 | 1.0 | 1000 | $1,150 | $1.15 | 43d | 1 | 1.40mi |
| 737 E Gift Ave Unit 737 Peoria, IL | 2.0 | 1.0 | 800 | $1,125 | $1.41 | 43d | 1 | 1.42mi |
| 2700 W Forrest Hill Ave Peoria, IL | 2.0 | 1.0 | 850 | $850 | $1.00 | 43d | 1 | 1.42mi |
| 4020 N Bryer Pl Peoria, IL | 2.0 | 1.0 | 720 | $1,250 | $1.74 | 21d | 1 | 1.45mi |
| 4010 N Brandywine Dr Peoria, IL | 1.0–2.0 | 1.0–2.0 | 797 | $876 | $1.10 | 13d | 17 | 1.47mi |
Listing history 11 events
-
2026-06-03status $64,900 Pending 48 DOM
-
2026-06-02days on market $64,900 Active 48 DOM
-
2026-06-01days on market $64,900 Active 47 DOM
-
2026-05-31days on market $64,900 Active 46 DOM
-
2026-05-30days on market $64,900 Active 45 DOM
-
2026-05-05price $64,900 208-char remark
Show marketing remark (208 chars)
Charming all brick ranch home with fenced yard. Bedroom has double closets and ceiling fan. Spacious room sizes, new flooring and fresh paint. Full, unfinished basement. Don't miss out on this great home!
-
2026-04-27price $69,900 208-char remark
Show marketing remark (208 chars)
Charming all brick ranch home with fenced yard. Bedroom has double closets and ceiling fan. Spacious room sizes, new flooring and fresh paint. Full, unfinished basement. Don't miss out on this great home!
-
2026-04-15$74,900 Active 208-char remark
Show marketing remark (208 chars)
Charming all brick ranch home with fenced yard. Bedroom has double closets and ceiling fan. Spacious room sizes, new flooring and fresh paint. Full, unfinished basement. Don't miss out on this great home!
-
2004-06-28soldstatus $57,500
-
2001-04-30soldstatus $49,500 211-char remark
Show marketing remark (211 chars)
Very sharp all brick ranch*Baement is partially finished and currently used as another "bedroom"*Rooms are spacious and open*Must see!! All ceiling fans and the storage shed do not stay with the house*
-
2001-02-15$49,800 211-char remark
Show marketing remark (211 chars)
Very sharp all brick ranch*Baement is partially finished and currently used as another "bedroom"*Rooms are spacious and open*Must see!! All ceiling fans and the storage shed do not stay with the house*
ⓘ Source: listings_history table (triggers on properties + properties_extension) + one-shot
backfill from property_details.listing_events for pre-trigger history.
Tax reassessment forecast IL · Partial reset (capped growth)
- Current annual tax
- $1,503 · $125/mo
- Projected year-2 tax
- $1,503 · $125/mo
- Expected delta
- $0/yr ($0/mo · 0.0%)
ⓘ Screening estimate from a state-policy table — verify with the county assessor before closing.
Climate risk First Street
- Flood 1/10 Low FEMA zone X · 0% chance over 30 yrs
- Wildfire 1/10 Low
- Heat 3/10 Moderate 7 d/yr ≥105°F today · 18 d/yr by 30 yrs out
- Wind 2/10 Low 100% chance of damaging wind over 30 yrs
- Air quality 3/10 Moderate 1 unhealthy d/yr today · 3 by 30 yrs out
Nearby sold comps map
Loading sold comps map…
Walkable amenities ~0.75 mi
Loading nearby amenities…
Taxation est. · year 1
- Rental income
- $10,264
- − Mortgage interest
- −$3,635
- − Property taxes
- −$1,503
- − Insurance
- −$324
- − Repairs & maintenance
- −$821
- − Management
- −$821
- − Depreciation
- −$1,888
- Taxable income
- $1,271
- Est. tax owed @ 24.0%
- −$305
- After-tax cash flow
- $1,892/yr
For passive investors: Depreciation is non-cash, so a rental often shows a tax loss while cash-flowing — sheltering income. Rental losses are passive: they offset passive income freely, and up to $25,000/yr can offset ordinary (W-2) income if you actively participate and your MAGI is under $100k (phasing out to $0 by $150k); unused losses carry forward. On sale, claimed depreciation is recaptured at up to 25%, and gains may owe capital-gains tax (a 1031 exchange can defer both). Figures are a year-1 estimate at your 24.0% rate — not tax advice; consult a CPA.
Schools (NCES district)
- District
- Peoria SD 150
- NCES district ID
- 1731230
- Math proficiency
- 11% ▼ -5.00%
- Reading proficiency
- 14% ▼ -4.00%
- Median HH income
- $41,951
- Composite
- 10.92/100
- National rank
- #9751
- State rank
- #554 of 620 in IL
Livability — Peoria
- Score
- 73/100
- State rank
- #270
- US rank
- #5096
Category grades
Schools grade is shown separately in the Schools card above.
Census & demographics
- Census place
- Peoria, IL
- County
- Peoria County · 120,495 people
- City population
- 114,670
- Metro
- Peoria, IL
- Population (ZIP)
- 28,313
- Household income
- $52,414
- Rent vs Own
- Severe rent burden
- 815.0
Population outlook (Peoria County) Hauer SSP2
- Today (2025)
- 183,007 people
- By 2030
- 179,643 · -1.8%
- By 2040
- 171,782 · -6.1%
- By 2050
- 163,508 · -10.7%
- By 2075
- 140,178 · -23.4%
- By 2100
- 114,493 · -37.4%
Race, ethnicity, and origin ACS 2023
- Neighborhood character
- Diverse neighborhood (Simpson 0.61)
- Race & ethnicity
- White 55% Black 29% Two or more races 10% Hispanic / Latino 7% Asian 2%
- Hispanic origin (detail)
- Mexican 5%
- Common ancestry
- Italian 2% Slovak 1% Iranian 1%
- Foreign-born
- 6% · Canada, China
- Languages at home
- 92% English-only · Spanish 4% Chinese 1% French/Haitian/Cajun 1%
Political lean MEDSL · Peoria
- 2024 margin
- Toss-up / Even · D 51.5% · R 46.9% · Other 1.6%
- 2008→2024 swing
- -9.2pp toward R · 2008: 13.9pp · 2024: 4.7pp
- All cycles
- 2024: D+4.7 2020: D+6.3 2016: D+2.8 2012: D+4.4 2008: D+13.9
Not yet ingested
- Civics
- —
Market trends
- HPI YoY
- ▼ -54.15%
- Current HPI
- 165.8838
- Rent YoY
- ▲ 2.30%
- Metro
- Peoria, IL
- State GDP YoY
- ▲ 1.59%
- F500 in state
- 60
Industry mix (Fortune 500 HQ in IL)
| Industry | F500 HQs | Revenue |
|---|---|---|
| Insurance | 4 | $201B |
|
||
| Consumer Goods | 4 | $87B |
|
||
| Industrial Machinery | 3 | $64B |
|
||
| Healthcare | 2 | $55B |
|
||
| Retail / Pharmacy | 1 | $148B |
|
||
| Agriculture / Food | 1 | $86B |
|
||
Price history
+30.3% since first listed6 events — show timeline
- 2026-05-05 Price Changed $64,900 RMLSA as Distributed by MLS Grid
- 2026-04-27 Price Changed $69,900 RMLSA as Distributed by MLS Grid
- 2026-04-15 Listed $74,900 RMLSA as Distributed by MLS Grid
- 2004-06-28 Sold (Public Records) $57,500 Public Records
- 2001-04-30 Sold (MLS) $49,500 RMLSA as Distributed by MLS Grid
- 2001-02-15 Listed $49,800 RMLSA as Distributed by MLS Grid
Property tax history
+4.4%/yrLatest (2024): $1,503 · +72.7% YoY. Source: county tax records.
Cash-flow waterfall
monthlySold comps — $/sqft
last 12 mo · ≤1 miLoading sold comps…