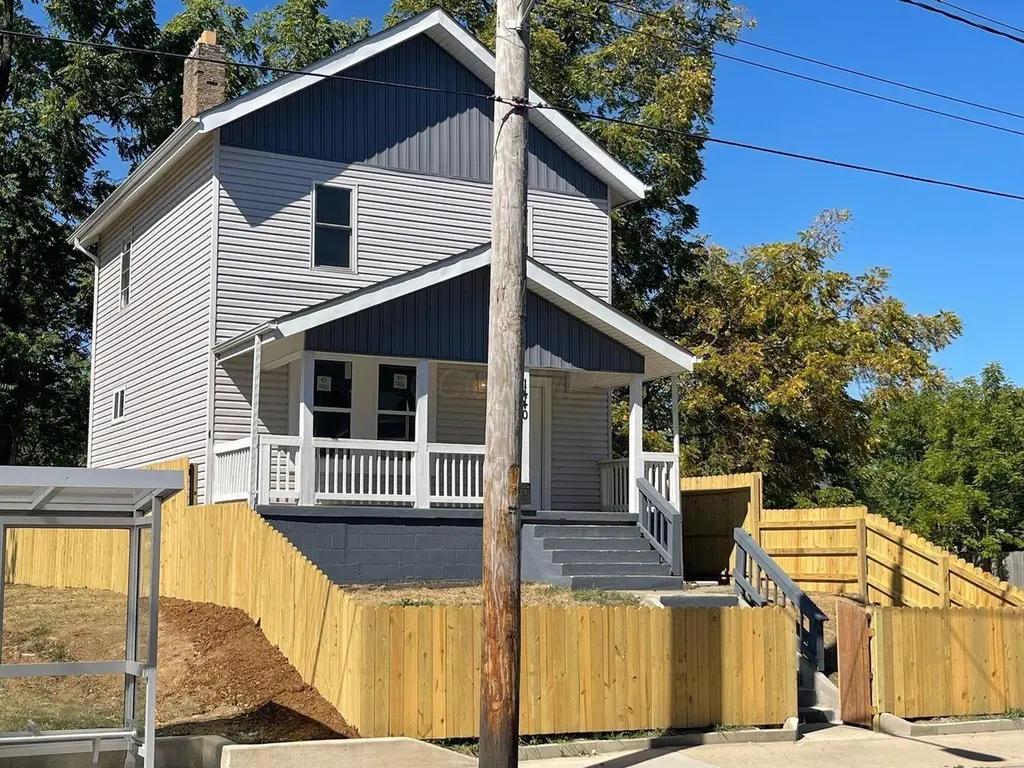
1440 Mount Vernon Ave · Columbus, OH
Flood risk 1/10 · Minimal
- FEMA flood zone
- X (unshaded)
- Chance of flooding over 30 yrs
- 0.0%
- Est. flood insurance / yr
- $473 – $860
Fire risk 1/10 · Minimal
- Est. fire insurance / yr
- $713 – $1,323
Heat risk 4/10 · Minor
- Hot days now (above 100°F)
- 7 days/yr
- Hot days in 30 yrs
- 18 days/yr
Wind risk 2/10 · Minimal
- Chance of severe wind over 30 yrs
- 1.0%
Air-quality risk 3/10 · Minor
- Unhealthy air days now
- 2 days/yr
- Unhealthy air days in 30 yrs
- 4 days/yr
Risk factors via First Street. Map © Google.
Why this score? — see what drove the D grade
The composite is a weighted blend of 9 inputs, each scored 0–100. Each bar is that input's sub-score; the figure is the points it added to the 100-point composite (weight × sub-score).
- ARV discount +14.2/15.0
- Cash flow +10.3/30.0
- Livability +4.0/5.0
- Rent growth +3.8/5.0
- DSCR +3.0/10.0
- 1% rule +2.8/10.0
- Condition / age +2.5/5.0
- Schools +1.7/10.0
- Appreciation +0.0/10.0
$200,000
🖨 Deal sheet (PDF) 📄 Offer letter ✓ Due diligence
Listing remarks
Welcome to 1440 Mount Vernon Avenue, Columbus, OH 43203 — a beautifully renovated 2-bedroom, 2-bathroom home offering over 1,200 square feet of contemporary comfort and style. Step inside to find an open, airy layout featuring brand-new flooring, fresh paint, and updated fixtures throughout. The modern kitchen is equipped with new appliances, perfect for everyday living or entertaining. Both bathrooms have been completely redesigned, blending elegance and functionality. Major updates include a new HVAC system, a new roof, and a full interior transformation, ensuring peace of mind for years to come. Outside, enjoy a well-maintained yard and ample parking, adding even more convenience.
Key facts
- Renovated home
- Redesigned bathrooms
- New appliances
Tags
Property features AI
Finance
- Other: Standard listing conditions
- Financial info: 2024 taxes reported
Exterior
- Parking: On-street parking
- Utilities: Public water; Public sewer
- Home design: Single family residence; Three levels; Built in 1900; No common walls
- Construction: Block foundation; Originally built in 1900
- Exterior features: Block foundation; Lot approximately 0.09 acres
Interior
- Bathrooms: 1 full bathroom; 1 half bathroom (total 1.5 bathrooms)
- Interior features: Has basement; Living area of 1206
Neighborhood map
What this means for you Summary
Snapshot
- This is a 3-bed/1.0-bath single-family listed at $200k.
Deal economics
- At list price, monthly cash flow is $-109 ($-1k/yr) — negative.
- To cash-flow at today's rent, offer at most $181k (9.6% below list).
- To meet the 1% rule (rent ≥ 1% of price), the offer needs to be $157k (21.6% below list).
- Recommended offer: $157k (21.6% below list) — sets the bar for 1% rule.
- Cap rate 5.6% vs local median 3.8% in Columbus — top-decile yield for the area; either an underpriced asset or a hidden risk that comps aren't pricing in. Stress-test before assuming the spread holds.
Location & tenants
- Location reads 81/100 on livability (#97 in OH, #1,491 nationally) — a professional / high-income tenant draw. Strengths: commute A+, cost of living A+, housing A+; Watch: employment C-, crime F.
- Columbus City School District (urban): math 15% / reading 26% proficiency, ranked #626 of 656 in OH (top 95%) — low school quality limits family demand, transient renter base, plan for 1-2y turnover; 72% free/reduced lunch — lower-income household profile, screen leases tightly.
- Zoned schools: Indianola Informal K-8 School (math 43% / reading 58%, grade D+, #896 of 1,584 statewide, top 57%, 684 students, 0% FRL); Arts Impact Middle School (Aims) (math 17% / reading 25%, grade F, #608 of 654 statewide, top 93%, 532 students, 0% FRL); Columbus Alternative High School (math 27% / reading 74%, grade D+, #380 of 781 statewide, top 49%, 758 students, 0% FRL) — zoned schools average 0% FRL vs 72% district-wide (72 pts lower); this property's tenant base skews higher-income than the district average.
- Zoned-school proficiency averages 41% at this address vs 20% district-wide (+20 pts) — the actual schools serving this property are materially stronger than the Columbus City School District average implies; a family-tenant draw the district grade alone would hide.
- Market conditions: Rents rising fast (+5.0%/yr); 95 active listings in the ZIP; 40 comparable units currently listed for rent nearby; rentals at typical pace (median 24d on market — plan ~3-4 weeks tenant-placement turnaround); 8,139 units permitted in Franklin County in 2024 (5,940 in 5+ unit buildings).
- This rent runs 40% of the median local income ($48k/yr) — at the standard rent-burdened threshold; future hikes will face affordability resistance.
Forward outlook
- Local home prices are declining (-3.0%/yr); year-one equity from $1k of loan paydown is wiped out by about $6k of value loss. Plan a longer hold.
- Franklin County population projected at +34% by 2050 — long-run rental-demand tailwind backs the buy-and-hold thesis.
Negotiation context
- It's been on market 46 days — a 3% lower offer ($194k) is reasonable based on typical stale-listing flexibility.
- 6 sale attempts since 27y ago; this cycle's ask is 9900% above the opening price — seller raised mid-cycle; expect resistance to lowballs.
- Current owner paid $57k; list at $200k implies a 251% gain — meaningful room to come down on a strong offer.
Risks & watch-outs
- Watch-outs: built in 1900 — expect roof / HVAC / electrical / plumbing capex.
Questions for the listing agent
- What do current leases actually rent for vs. the listed asking? Can we see a recent rent roll and the last 12 months of T-12 income?
- It's been on market 46 days. Have you received any prior offers? Is the seller open to a 22% concession, seller financing, or rate buy-down credit?
- Built in 1900 — when were the roof, HVAC, electrical panel, plumbing, and water heater last replaced?
- Is there a deadline driving the sale (1031 exchange, divorce, estate, relocation)? That informs how much negotiation room exists.
- Crime grade is F in this area — have there been break-ins, vandalism, or insurance claims at this property in the last 3 years? What carrier currently insures it and at what premium?
- The area grade is low — what's the realistic commute time and amenity access for the typical tenant pool here? Any planned neighborhood developments (good or bad) we should know about?
- What's the average days-on-market for RENTAL listings here right now (not sales)? A rising rental-DOM trend means longer vacancies and softer asking-rent achievability than the comps imply.
- What's the recent tenant-quality profile in this submarket — average credit score on applications, eviction rate, late-payment / NSF rate, and stable-employment percentage? A property-management company in the area should have these aggregated.
- How much new for-sale + rental construction is in the pipeline within 1–3 miles? Heavy new supply typically softens prices + rents 12–24 months out; constrained supply supports both.
Investment metrics
- 1% rule
- 0.78% ✗
- Cap rate
- 5.64%
- Cash-on-cash
- -2.34%
- DSCR
- 0.90
- GRM
- 10.6
CMA / ARV
- ARV (median comp)
- $235,262
- List price
- $200,000
- Delta
- -14.99%
- Verdict
- UNDERPRICED
- Comps
- 20 within 1.0 mi
Show comp detail 12 sales within ~0.75 mi
| Address | Dist | Beds/Ba | Sqft | Sold | Price | $/sf | Match |
|---|---|---|---|---|---|---|---|
| 463 Fairfield Ave | 0.23mi | 3/1.5 | 1,184 (-2%) | 4mo | $236,175 | $199 | 81 |
| 1250 Hildreth Ave | 0.27mi | 3/1.0 | 1,248 (+4%) | 1mo | $105,000 | $84 | 81 |
| 528 Bassett Ave | 0.25mi | 3/1.0 | 1,158 (-4%) | 10mo | $160,000 | $138 | 73 |
| 1495 Atcheson St | 0.18mi | 3/1.0 | 1,071 (-11%) | 11mo | $110,000 | $103 | 64 |
| 156 Winner Ave | 0.31mi | 3/1.5 | 1,083 (-10%) | 4mo | $245,000 | $226 | 63 |
| 288 Johnson St | 0.12mi | 2/2.5 (-1) | 1,297 (+8%) | 10mo | $215,000 | $166 | 63 |
| 1905 Clifton Ave | 0.74mi | 3/1.0 | 1,195 (-1%) | 2mo | $265,000 | $222 | 62 |
| 1389 Hildreth Ave | 0.07mi | 3/1.5 | 1,368 (+13%) | 13mo | $250,000 | $183 | 62 |
| 1221 Atcheson St | 0.31mi | 3/1.0 | 1,080 (-10%) | 10mo | $136,000 | $126 | 60 |
| 479 Parkwood Ave | 0.30mi | 3/1.0 | 1,054 (-13%) | 8mo | $118,000 | $112 | 59 |
| 468 Sawyer Blvd | 0.66mi | 3/1.5 | 1,314 (+9%) | 10mo | $268,000 | $204 | 44 |
| 1832 Arborfield Pl | 0.59mi | 3/2.0 | 1,368 (+13%) | 8mo | $270,000 | $197 | 39 |
Match score weights: distance 35% · size 25% · config 20% · recency 20%. Top-matched comps best support the ARV.
Projected returns pro-forma
-3.0% appreciation · 5.03% rent growth · sell at horizon
- IRR
- -18.0%
- Equity multiple
- 0.36×
- Total profit
- $-36,094
- Equity at exit
- $29,821
- IRR
- -6.8%
- Equity multiple
- 0.53×
- Total profit
- $-26,402
- Equity at exit
- $17,292
Cash invested: $56,000 (down + closing). Projections, not guarantees.
Landlord ↔ Tenant lean methodology
- Overall (STATE)
- 73 Landlord-Friendly
- State Ohio
- 73 Landlord-Friendly · R+6
- County
- — inherits STATE
- City
- — inherits STATE
ZIP-level market 43203
- Home prices YoY
- -31.9%
- Rents YoY
- 5.0%
- Active inventory
- 95
- Price-to-rent
- 10.6×
Monthly cashflow live
- Estimated rent
- $1,568 high interval (Pro) →
- Mortgage (P&I)
- −$1,049
- Tax from tax record
- −$215 /mo · $2,585/yr
- Insurance
- −$83
- HOA
- −$0
- Vacancy / Maint / Mgmt
- −$329
- Net cashflow
- $-109
Break-even live
Sensitivity live
| Price | -10% $4 | -5% $-53 | +0% $-109 | +5% $-166 | +10% $-222 |
|---|---|---|---|---|---|
| Rent | -10% $-233 | -5% $-171 | +0% $-109 | +5% $-47 | +10% $15 |
| Rate | -1.0pp $-8 | -0.5pp $-58 | base $-109 | +0.5pp $-161 | +1.0pp $-214 |
UW: 25.0% down · 7.5% · 30yr · 1.5% tax · 5.0% vac · 8.0% maint · 8.0% mgmt
Financing live
Cash to close
- Down payment
- $50,000
- Closing costs
- $6,000
- Reserves months
- —
- Total cash needed
- —
Loan-product check · same deal, 3 products live
Conventional
25% down · 7.5% · 30yr
- Down + closing
- —
- Monthly P&I
- —
- Monthly cashflow
- —
- DSCR
- —
- Eligible?
- —
Personal DTI + credit; lowest rate.
DSCR
20% down · 8.5% · 30yr
- Down + closing
- —
- Monthly P&I
- —
- Monthly cashflow
- —
- DSCR
- —
- Eligible?
- —
No personal income docs; deal must DSCR.
Hard money
10% down · 12.0% · 12mo
- Down + closing
- —
- Monthly P&I
- —
- Monthly cashflow
- —
- DSCR
- —
- Eligible?
- —
Short-term bridge; refi at stabilization.
Rent comps 40 comps
| Address | Beds | Baths | Sqft | Rent | $/sqft | DOM | Units | Dist |
|---|---|---|---|---|---|---|---|---|
| 1308-1310 Mount Vernon Ave Unit 1308 Columbus, OH | 3.0 | 2.0 | 1400 | $1,695 | $1.21 | 46d | 1 | 0.18mi |
| 1608 Greenway Ave Columbus, OH | 2.0 | 2.0 | 900 | $1,299 | $1.44 | 18d | 1 | 0.24mi |
| 1608 Greenway Ave Columbus, OH | 2.0 | 2.0 | 900 | $1,899 | $2.11 | 19d | 1 | 0.24mi |
| 476 Taylor Ave Columbus, OH | 1.0–2.0 | 1.0–2.0 | 699 | $1,695 | $2.42 | 5d | 8 | 0.29mi |
| 1216 Atcheson St Columbus, OH | 3.0 | 2.0 | 1092 | $1,550 | $1.42 | 5d | 1 | 0.33mi |
| 1216 Atcheson St Columbus, OH | 3.0 | 2.0 | 1092 | $1,550 | $1.42 | 0d | 1 | 0.33mi |
| 439 Eldridge Ave Unit 439 Columbus, OH | 3.0 | 1.0 | 946 | $1,200 | $1.27 | 25d | 1 | 0.34mi |
| 1614 Clifton Ave Unit 1620 Columbus, OH | 2.0 | 1.0 | 875 | $1,349 | $1.54 | 25d | 1 | 0.34mi |
| 60-66 Winner Ave Columbus, OH | 2.0 | 1.0 | 1500 | $1,250 | $0.83 | 19d | 1 | 0.45mi |
| 250 N 21st St Columbus, OH | 3.0 | 2.5 | 1452 | $2,600 | $1.79 | 46d | 1 | 0.48mi |
| 1544 E Broad St Unit 303 Columbus, OH | 2.0 | 1.0 | 875 | $1,122 | $1.28 | 46d | 1 | 0.52mi |
| 1544 E Broad St Unit 1544-303 Columbus, OH | 2.0 | 1.0 | 875 | $1,122 | $1.28 | 9d | 1 | 0.52mi |
| 1550 E Broad St Columbus, OH | 2.0 | 1.0 | 875 | $1,175 | $1.34 | 46d | 1 | 0.52mi |
| 1620 E Broad St Columbus, OH | 2.0 | 2.0 | 1214 | $2,025 | $1.67 | 5d | 2 | 0.55mi |
| 1620 E Broad St #408 Columbus, OH | 2.0 | 2.0 | 1247 | $2,150 | $1.72 | 25d | 1 | 0.55mi |
| 1445 E Broad St Columbus, OH | 1.0–5.0 | 1.0–5.0 | 2164 | $2,170 | $1.00 | 0d | 4 | 0.58mi |
| 1444 Madison Ave Unit B Columbus, OH | 2.0 | 1.0 | 800 | $1,165 | $1.46 | 23d | 1 | 0.63mi |
| 1444 Madison Ave Unit B Columbus, OH | 2.0 | 1.0 | 800 | $1,165 | $1.46 | 0d | 1 | 0.63mi |
| 1001 Atcheson St Columbus, OH | 1.0–2.0 | 1.0 | 821 | $1,295 | $1.58 | 4d | 16 | 0.64mi |
| 1740 E Broad St Columbus, OH | 2.0 | 1.0 | 1200 | $1,500 | $1.25 | 25d | 1 | 0.64mi |
| 61 N 21st St Unit J Columbus, OH | 2.0 | 1.0 | 738 | $995 | $1.35 | 46d | 1 | 0.68mi |
| 64 N 20th St Columbus, OH | 2.0 | 1.0 | 1400 | $1,495 | $1.07 | 9d | 1 | 0.71mi |
| 58-64 N 20th St Columbus, OH | 2.0 | 1.0 | 1100 | $1,495 | $1.36 | 9d | 1 | 0.71mi |
| 62 N 20th St Columbus, OH | 3.0 | 1.0 | 1100 | $1,595 | $1.45 | 46d | 1 | 0.71mi |
| 1309 Fair Ave Columbus, OH | 2.0 | 1.0 | 850 | $1,050 | $1.24 | 9d | 1 | 0.73mi |
| 143 Sherman Ave Columbus, OH | 2.0 | 1.0 | 919 | $1,588 | $1.73 | 25d | 2 | 0.79mi |
| 151 Sherman Ave Unit 101 Columbus, OH | 2.0 | 1.0 | 981 | $1,675 | $1.71 | 25d | 1 | 0.80mi |
| 151 Sherman Ave #102 Columbus, OH | 2.0 | 1.0 | 970 | $1,675 | $1.73 | 25d | 1 | 0.80mi |
| 151 Sherman Ave Unit 101 Columbus, OH | 2.0 | 1.0 | 981 | $1,675 | $1.71 | 23d | 1 | 0.80mi |
| 196 Miller Ave Columbus, OH | 2.0 | 2.0 | 1000 | $1,250 | $1.25 | 46d | 1 | 0.81mi |
| 973 E Broad St #3 Columbus, OH | 2.0 | 1.0 | 780 | $1,500 | $1.92 | 19d | 1 | 0.85mi |
| 1096 Oak St Columbus, OH | 2.0 | 2.5 | 1487 | $2,099 | $1.41 | 0d | 1 | 0.85mi |
| 1096 Oak St Columbus, OH | 2.0 | 2.5 | 1487 | $2,099 | $1.41 | 5d | 1 | 0.85mi |
| 243 Miller Ave Unit 243 Columbus, OH | 2.0 | 1.0 | 980 | $1,375 | $1.40 | 46d | 1 | 0.88mi |
| 1599 Oak St Columbus, OH | 2.0 | 1.0–2.0 | 793 | $1,785 | $2.25 | 0d | 9 | 0.89mi |
| 1621-1631 Oak St Columbus, OH | 2.0 | 1.0 | 1253 | $1,340 | $1.07 | 5d | 1 | 0.91mi |
| 1117-1119 Franklin Ave Columbus, OH | 3.0 | 1.0 | 1288 | $1,525 | $1.18 | 46d | 1 | 0.92mi |
| 1109 Franklin Ave Unit 1109 Columbus, OH | 2.0 | 1.0 | 1200 | $1,350 | $1.12 | 46d | 1 | 0.92mi |
| 820 E Long St Columbus, OH | 2.0 | 1.0–2.0 | 888 | $1,810 | $2.04 | 0d | 20 | 0.95mi |
| 1766 Oak St Unit 1768 Columbus, OH | 2.0 | 1.0 | 1428 | $1,295 | $0.91 | 46d | 1 | 1.00mi |
Listing history 37 events
-
2026-06-21days on market $200,000 Active 46 DOM
-
2026-06-18days on market $200,000 Active 43 DOM
-
2026-06-17days on market $200,000 Active 42 DOM
-
2026-06-16days on market $200,000 Active 41 DOM
-
2026-06-15days on market $200,000 Active 40 DOM
-
2026-06-13days on market $200,000 Active 38 DOM
-
2026-06-13days on market $200,000 Active 37 DOM
-
2026-06-09days on market $200,000 Active 34 DOM
-
2026-06-08days on market $200,000 Active 33 DOM
-
2026-06-07days on market $200,000 Active 32 DOM
-
2026-06-05days on market $200,000 Active 29 DOM
-
2026-06-03days on market $200,000 Active 28 DOM
-
2026-06-02days on market $200,000 Active 27 DOM
-
2026-06-01days on market $200,000 Active 26 DOM
-
2026-05-31days on market $200,000 Active 25 DOM
-
2026-05-06$200,000 Active 864-char remark
-
2026-05-06historical
-
2026-03-02price $205,000
-
2025-10-13$210,000 Active
-
2025-10-05historical
-
2025-08-28price $225,000
-
2025-08-12price $245,000
-
2024-09-26price $249,000
-
2024-09-16price $250,000
-
2024-09-12price $273,000
-
2024-09-03$275,000 Active
-
2003-12-20historical
-
2003-06-19$49,600
-
1999-09-27soldstatus $57,000
-
1999-08-23soldstatus $14,500
-
1999-06-22historical
-
1999-04-13$16,900
-
1997-09-17soldstatus $40,200
-
1997-09-17soldstatus $40,200
-
1997-06-06soldstatus $28,000
-
1996-09-26soldstatus $13,700
-
1991-08-12soldstatus $10,000
ⓘ Source: listings_history table (triggers on properties + properties_extension) + one-shot
backfill from property_details.listing_events for pre-trigger history.
Tax reassessment forecast OH · Partial reset (capped growth)
- Current annual tax
- $2,585 · $215/mo
- Projected year-2 tax
- $2,852 · $238/mo
- Expected delta
- +$268/yr (+$22/mo · 10.4%)
ⓘ Screening estimate from a state-policy table — verify with the county assessor before closing.
Climate risk First Street
- Flood 1/10 Low FEMA zone X (unshaded) · 0% chance over 30 yrs
- Wildfire 1/10 Low
- Heat 4/10 Moderate 7 d/yr ≥100°F today · 18 d/yr by 30 yrs out
- Wind 2/10 Low 100% chance of damaging wind over 30 yrs
- Air quality 3/10 Moderate 2 unhealthy d/yr today · 4 by 30 yrs out
Nearby sold comps map
Loading sold comps map…
Walkable amenities ~0.75 mi
Loading nearby amenities…
Taxation est. · year 1
- Rental income
- $18,811
- − Mortgage interest
- −$11,203
- − Property taxes
- −$2,585
- − Insurance
- −$1,000
- − Repairs & maintenance
- −$1,505
- − Management
- −$1,505
- − Depreciation
- −$5,818
- Taxable loss
- −$4,805
- Est. tax savings @ 24.0%
- +$1,153
- After-tax cash flow
- $-157/yr
For passive investors: Depreciation is non-cash, so a rental often shows a tax loss while cash-flowing — sheltering income. Rental losses are passive: they offset passive income freely, and up to $25,000/yr can offset ordinary (W-2) income if you actively participate and your MAGI is under $100k (phasing out to $0 by $150k); unused losses carry forward. On sale, claimed depreciation is recaptured at up to 25%, and gains may owe capital-gains tax (a 1031 exchange can defer both). Figures are a year-1 estimate at your 24.0% rate — not tax advice; consult a CPA.
Schools (NCES district)
- District
- Columbus City School District
- NCES district ID
- 3904380
- Math proficiency
- 15% ▼ -17.00%
- Reading proficiency
- 26% ▼ -12.00%
- Median HH income
- $38,483
- Composite
- 17.19/100
- National rank
- #9105
- State rank
- #626 of 656 in OH
Livability — Columbus
- Score
- 81/100
- State rank
- #97
- US rank
- #1491
Category grades
Schools grade is shown separately in the Schools card above.
Census & demographics
- Census place
- Columbus, OH
- County
- Franklin County · 1,351,780 people
- City population
- 612,189
- Metro
- Columbus, OH
- Population (ZIP)
- 8,618
- Household income
- $47,572
- Rent vs Own
- Severe rent burden
- 859.0
Population outlook (Franklin County) Hauer SSP2
- Today (2025)
- 1,456,139 people
- By 2030
- 1,556,890 · +6.9%
- By 2040
- 1,757,349 · +20.7%
- By 2050
- 1,950,539 · +34.0%
- By 2075
- 2,376,171 · +63.2%
- By 2100
- 2,636,796 · +81.1%
Race, ethnicity, and origin ACS 2023
- Neighborhood character
- Diverse neighborhood (Simpson 0.56)
- Race & ethnicity
- Black 59% White 29% Two or more races 8% Hispanic / Latino 2% Asian 2%
- Common ancestry
- Lithuanian 1% Romanian 1% Swiss 1%
- Foreign-born
- 12% · Canada
- Languages at home
- 86% English-only · Other Indo-European 1% Spanish 1% French/Haitian/Cajun 1%
Political lean MEDSL · Franklin
- 2024 margin
- Strong D (+28.4) · D 63.7% · R 35.3% · Other 1.0%
- 2008→2024 swing
- +7.7pp toward D · 2008: 20.7pp · 2024: 28.4pp
- All cycles
- 2024: D+28.4 2020: D+31.4 2016: D+25.9 2012: D+21.7 2008: D+20.7
Not yet ingested
- Civics
- —
Market trends
- HPI YoY
- ▼ -102.09%
- Current HPI
- 217.3929
- Rent YoY
- ▲ 5.03%
- Metro
- Columbus, OH
- State GDP YoY
- ▲ 1.98%
- F500 in state
- 48
Industry mix (Fortune 500 HQ in OH)
| Industry | F500 HQs | Revenue |
|---|---|---|
| Insurance | 3 | $145B |
|
||
| Industrial Machinery | 3 | $49B |
|
||
| Financial Services | 3 | $24B |
|
||
| Consumer Goods | 2 | $93B |
|
||
| Aerospace / Defense | 2 | $47B |
|
||
| Utilities | 2 | $33B |
|
||
Price history
-80.0% since first listed24 events — show timeline
- 2026-05-28 Rental Removed $2,000 TURBOTENANT
- 2026-05-26 Listed for Rent $2,000 TURBOTENANT
- 2026-05-06 Listing Removed — CBRMLS
- 2026-05-06 Listed $200,000 CBRMLS
- 2026-03-02 Price Changed $205,000 CBRMLS
- 2025-10-13 Listed $210,000 CBRMLS
- 2025-10-05 Listing Removed — CBRMLS
- 2025-08-28 Price Changed $225,000 CBRMLS
- 2025-08-12 Price Changed $245,000 CBRMLS
- 2024-09-26 Price Changed $249,000 CBRMLS
- 2024-09-16 Price Changed $250,000 CBRMLS
- 2024-09-12 Price Changed $273,000 CBRMLS
- 2024-09-03 Listed $275,000 CBRMLS
- 2003-12-20 Listing Removed — CBRMLS
- 2003-06-19 Listed $49,600 CBRMLS
- 1999-09-27 Sold (Public Records) $57,000 Public Records
- 1999-08-23 Sold (MLS) $14,500 CBRMLS
- 1999-06-22 Listing Removed — CBRMLS
- 1999-04-13 Listed $16,900 CBRMLS
- 1997-09-17 Sold (Public Records) $40,200 Public Records
- 1997-09-17 Sold (Public Records) $40,200 Public Records
- 1997-06-06 Sold (Public Records) $28,000 Public Records
- 1996-09-26 Sold (Public Records) $13,700 Public Records
- 1991-08-12 Sold (Public Records) $10,000 Public Records
Property tax history
+19.3%/yrLatest (2024): $2,585 · -18.5% YoY. Source: county tax records.
Cash-flow waterfall
monthlySold comps — $/sqft
last 12 mo · ≤1 miLoading sold comps…