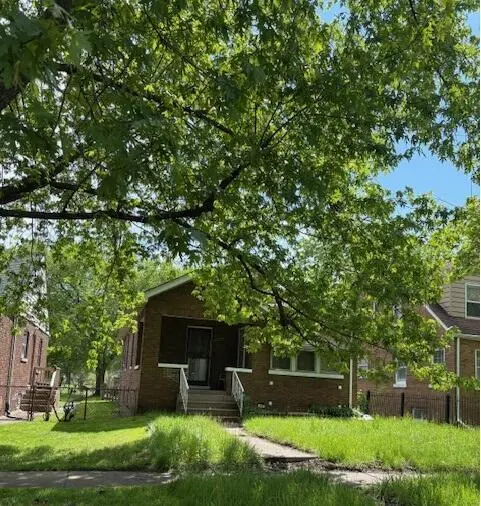
1417 Delaware St · Gary, IN
Flood risk 1/10 · Minimal
- FEMA flood zone
- X (unshaded)
- Chance of flooding over 30 yrs
- 0.0%
- Est. flood insurance / yr
- $473 – $860
Fire risk 3/10 · Minor
- Est. fire insurance / yr
- $717 – $1,331
Heat risk 3/10 · Minor
- Hot days now (above 102°F)
- 7 days/yr
- Hot days in 30 yrs
- 15 days/yr
Wind risk 2/10 · Minimal
- Chance of severe wind over 30 yrs
- 1.0%
Air-quality risk 4/10 · Minor
- Unhealthy air days now
- 6 days/yr
- Unhealthy air days in 30 yrs
- 7 days/yr
Risk factors via First Street. Map © Google.
Why this score? — see what drove the D+ grade
The composite is a weighted blend of 9 inputs, each scored 0–100. Each bar is that input's sub-score; the figure is the points it added to the 100-point composite (weight × sub-score).
- Cash flow +15.0/30.0
- ARV discount +7.5/15.0
- Appreciation +5.5/10.0
- 1% rule +5.0/10.0
- DSCR +5.0/10.0
- Livability +3.7/5.0
- Rent growth +2.5/5.0
- Condition / age +2.5/5.0
- Schools +0.5/10.0
$1
🖨 Deal sheet 📄 Offer letter ✓ Due diligence
Listing remarks MLS
Come view this updated ALL BRICK RANCH home! The home welcomes you with a covered porch beautiful hardwood floors and a featured arch in the main area. 3 bedrooms, living room, dining room and kitchen complete the main floor. There is a full basement and large attic space that can be finished as well. Schedule your showing today!
Key facts
- 3,877 sq ft lot
- Built 1928
- Listed 14 days
Property features AI
Finance
- Other: Owner-occupied at time of listing
- Financial info: Property is listed for auction (reserve) on 2026-05-15 at 7:00 AM
Exterior
- Parking: On-street parking
- Utilities: Electricity connected; Public water; Public sewer; Natural gas connected
- Home design: One-story home; Built in 1928; 906 above-grade finished living area
- Construction: Brick and vinyl siding; Unfinished basement
- Exterior features: Front porch; Neighborhood view; No other exterior features listed
Interior
- Kitchen: No appliances listed
- Bedrooms: Primary bedroom; Bedroom 2; Bedroom 3
- Flooring: Other flooring
- Bathrooms: 1 full bathroom
- Heating & cooling: Forced air heating (natural gas); No cooling
- Interior features: Other interior features
- Laundry & utility: No laundry appliances listed
Neighborhood map
What this means for you Summary
Snapshot
- This is a 2-bed/1.0-bath single-family listed at $1.
Deal economics
- At list price, monthly cash flow is $873 ($10k/yr) — positive.
- The deal already cash-flows at list — no discount required.
- Meets the 1% rule at list price ($1k rent vs $1).
- Cap rate 1047765.5% vs local median 9.1% in Gary — top-decile yield for the area; either an underpriced asset or a hidden risk that comps aren't pricing in. Stress-test before assuming the spread holds.
Location & tenants
- Location reads 73/100 on livability (#105 in IN) — a middle-class / working-renter tenant base. Strengths: commute A+, cost of living A+, housing A+; Watch: schools F, crime F, employment F.
- Gary Community School Corporation (urban): math 3% / reading 11% proficiency, ranked #299 of 301 in IN (top 99%) — low school quality limits family demand, transient renter base, plan for 1-2y turnover; 80% free/reduced lunch — lower-income household profile, screen leases tightly.
- Market conditions: 121 active listings in the ZIP; 23 comparable units currently listed for rent nearby; rentals leasing fast (median 2d on market — plan ~1-2 weeks tenant-placement turnaround); lower-income renter base — watch delinquency; 1,642 units permitted in Lake County in 2024 (14 in 5+ unit buildings).
- At $1,105/mo this rent would consume 46% of the median local household income ($29k/yr) (locally 392% of renters already pay >50% of income on rent) — very limited rent-growth headroom before tenants either downsize or default.
Forward outlook
- Lake County population projected to shrink 7% by 2050 — rents likely to lag national; underwrite the cash flow, not the appreciation.
- At projected returns (1.0% appreciation + 3.0% rent growth), your $0 cash investment doubles in ~1 year — after that, you're playing with house money.
Negotiation context
- Only 14 days on market — expect competitive offers; lowballing is unlikely to land.
- 3 sale attempts since 13y ago with the ask held roughly flat each time — persistent listings suggest the price (not the market) is what's stuck; bring a comps-based counter.
Risks & watch-outs
- Watch-outs: built in 1928 — expect roof / HVAC / electrical / plumbing capex.
Questions for the listing agent
- Built in 1928 — when were the roof, HVAC, electrical panel, plumbing, and water heater last replaced?
- Is there a deadline driving the sale (1031 exchange, divorce, estate, relocation)? That informs how much negotiation room exists.
- Schools are F-rated, which usually means shorter tenancies and higher turnover. Who's the typical renter profile here, and what's been the actual vacancy rate?
- Crime grade is F in this area — have there been break-ins, vandalism, or insurance claims at this property in the last 3 years? What carrier currently insures it and at what premium?
- The area grade is low — what's the realistic commute time and amenity access for the typical tenant pool here? Any planned neighborhood developments (good or bad) we should know about?
- What's the average days-on-market for RENTAL listings here right now (not sales)? A rising rental-DOM trend means longer vacancies and softer asking-rent achievability than the comps imply.
- What's the recent tenant-quality profile in this submarket — average credit score on applications, eviction rate, late-payment / NSF rate, and stable-employment percentage? A property-management company in the area should have these aggregated.
- How much new for-sale + rental construction is in the pipeline within 1–3 miles? Heavy new supply typically softens prices + rents 12–24 months out; constrained supply supports both.
Investment metrics
- 1% rule
- 110524.00% ✓
- Cap rate
- 1047765.52%
- Cash-on-cash
- 3741997.24%
- DSCR
- 166498.82
- GRM
- 0.0
CMA / ARV
- ARV (median comp)
- $39,749
- List price
- $1
- Delta
- -100.00%
- Verdict
- UNDERPRICED
- Comps
- 20 within 1.0 mi
Show comp detail 8 sales within ~0.75 mi
| Address | Dist | Beds/Ba | Sqft | Sold | Price | $/sf | Match |
|---|---|---|---|---|---|---|---|
| 825 E 14th Ave | 0.27mi | 3/1.0 (+1) | 900 (-1%) | 19mo | $43,000 | $48 | 66 |
| 1953 Carolina St | 0.44mi | 3/1.0 (+1) | 936 (+3%) | 13mo | $125,000 | $134 | 58 |
| 1027 Central Ave | 0.40mi | 3/1.0 (+1) | 1,008 (+11%) | 1mo | $69,000 | $68 | 57 |
| 1177 Harrison St | 0.74mi | 2/1.0 | 946 (+4%) | 2mo | $8,500 | $9 | 56 |
| 1980 Massachusetts St | 0.47mi | 3/1.0 (+1) | 802 (-12%) | 0mo | $20,000 | $25 | 54 |
| 2025 Pennsylvania St | 0.49mi | 2/1.0 | 810 (-11%) | 15mo | $18,500 | $23 | 47 |
| 764 Rhode Island St | 0.65mi | 2/1.0 | 804 (-11%) | 12mo | $45,000 | $56 | 41 |
| 2180 Nichols Pl | 0.71mi | 2/1.0 | 771 (-15%) | 4mo | $15,000 | $19 | 39 |
Match score weights: distance 35% · size 25% · config 20% · recency 20%. Top-matched comps best support the ARV.
Projected returns pro-forma
0.98% appreciation · 3.0% rent growth · sell at horizon
- IRR
- —
- Equity multiple
- 198668.78×
- Total profit
- $55,627
- Equity at exit
- $0
- IRR
- —
- Equity multiple
- 428979.77×
- Total profit
- $120,114
- Equity at exit
- $0
Cash invested: $0 (down + closing). Projections, not guarantees.
Landlord ↔ Tenant lean methodology
- Overall (STATE)
- 90 Strongly Landlord-Friendly
- State Indiana
- 90 Strongly Landlord-Friendly · R+11
- County
- — inherits STATE
- City
- — inherits STATE
ZIP-level market 46407
- Home prices YoY
- 0.4%
- Active inventory
- 121
Monthly cashflow live
- Estimated rent
- $1,105 high interval (Pro) →
- Mortgage (P&I)
- −$0
- Tax est. 1.5%
- −$0 /mo · $0/yr
- Insurance
- −$0
- HOA
- −$0
- Vacancy / Maint / Mgmt
- −$232
- Net cashflow
- $873
Break-even live
UW: 25.0% down · 7.5% · 30yr · 1.5% tax · 5.0% vac · 8.0% maint · 8.0% mgmt
Financing live
Cash to close
- Down payment
- $0
- Closing costs
- $0
- Reserves months
- —
- Total cash needed
- —
Loan-product check · same deal, 3 products live
Conventional
25% down · 7.5% · 30yr
- Down + closing
- —
- Monthly P&I
- —
- Monthly cashflow
- —
- DSCR
- —
- Eligible?
- —
Personal DTI + credit; lowest rate.
DSCR
20% down · 8.5% · 30yr
- Down + closing
- —
- Monthly P&I
- —
- Monthly cashflow
- —
- DSCR
- —
- Eligible?
- —
No personal income docs; deal must DSCR.
Hard money
10% down · 12.0% · 12mo
- Down + closing
- —
- Monthly P&I
- —
- Monthly cashflow
- —
- DSCR
- —
- Eligible?
- —
Short-term bridge; refi at stabilization.
Rent comps 23 comps
| Address | Beds | Baths | Sqft | Rent | $/sqft | DOM | Units | Dist |
|---|---|---|---|---|---|---|---|---|
| 1329 Delaware St Gary, IN | 2.0 | 1.0 | 1100 | $1,100 | $1.00 | 44d | 1 | 0.02mi |
| 1316 Delaware St Unit 2 Gary, IN | 2.0 | 1.0 | 700 | $950 | $1.36 | 21d | 1 | 0.04mi |
| 2022 Massachusetts St Gary, IN | 2.0 | 1.0 | 965 | $1,000 | $1.04 | 1d | 1 | 0.54mi |
| 2061 Maryland St Gary, IN | 2.0 | 1.0 | 975 | $950 | $0.97 | 44d | 1 | 0.56mi |
| 844 Tennessee St Gary, IN | 3.0 | 1.5 | 1000 | $1,500 | $1.50 | 44d | 1 | 0.68mi |
| 2300 Maryland St Gary, IN | 2.0 | 1.0 | 900 | $1,000 | $1.11 | 19d | 1 | 0.85mi |
| 2315 Industrial Blvd Unit B Gary, IN | 3.0 | 1.0 | 989 | $1,150 | $1.16 | 1d | 1 | 0.87mi |
| 2315 Industrial Blvd Gary, IN | 2.0 | 1.0 | 989 | $950 | $0.96 | 4d | 1 | 0.87mi |
| 2315 Industrial Blvd Gary, IN | 2.0 | 1.0 | 989 | $950 | $0.96 | 1d | 1 | 0.87mi |
| 1843 Illinois St Gary, IN | 2.0 | 1.0 | 725 | $1,200 | $1.66 | 17d | 1 | 0.87mi |
| 840 W 19th Ave Gary, IN | 2.0 | 1.0 | 1035 | $1,150 | $1.11 | 19d | 1 | 0.88mi |
| 2336 Delaware St Gary, IN | 3.0 | 1.0 | 816 | $1,100 | $1.35 | 1d | 1 | 0.89mi |
| 762 Harrison St Unit SRO Gary, IN | 1.0 | 1.0 | 1075 | $700 | $0.65 | 1d | 1 | 0.98mi |
| 2355 Rhode Island St Gary, IN | 2.0 | 1.0 | 701 | $1,095 | $1.56 | 44d | 1 | 0.99mi |
| 1521 Pierce St Unit 1 Gary, IN | 2.0 | 1.0 | 800 | $850 | $1.06 | 1d | 1 | 1.01mi |
| 501 Madison St Gary, IN | 1.0–4.0 | 1.0 | 883 | $1,144 | $1.29 | 1d | 11 | 1.02mi |
| 2425 Prospect St Gary, IN | 3.0 | 1.0 | 1051 | $1,400 | $1.33 | 1d | 1 | 1.02mi |
| 2453 Prospect St Gary, IN | 2.0 | 1.0 | 704 | $1,095 | $1.56 | 1d | 1 | 1.06mi |
| 2025 Central Dr Gary, IN | 3.0 | 1.0 | 875 | $1,550 | $1.77 | 44d | 1 | 1.13mi |
| 2378 Jackson St Gary, IN | 2.0 | 1.0 | 672 | $1,050 | $1.56 | 1d | 1 | 1.13mi |
| 2361 Pierce St Unit 2 Gary, IN | 3.0 | 1.0 | 860 | $900 | $1.05 | 1d | 1 | 1.35mi |
| 2572-76 Van Buren Pl Gary, IN | 2.0 | 1.0 | 700 | $1,025 | $1.46 | 1d | 1 | 1.35mi |
| 411 Pierce St Gary, IN | 3.0 | 1.0 | 874 | $1,395 | $1.60 | 22d | 1 | 1.43mi |
Listing history 8 events
-
2026-05-05$1 Active 404-char remark
-
2022-01-18soldstatus $82,000 Closed 331-char remark
Show marketing remark (331 chars)
Come view this updated ALL BRICK RANCH home! The home welcomes you with a covered porch beautiful hardwood floors and a featured arch in the main area. 3 bedrooms, living room, dining room and kitchen complete the main floor. There is a full basement and large attic space that can be finished as well. Schedule your showing today!
-
2021-12-07price $85,000 331-char remark
Show marketing remark (331 chars)
Come view this updated ALL BRICK RANCH home! The home welcomes you with a covered porch beautiful hardwood floors and a featured arch in the main area. 3 bedrooms, living room, dining room and kitchen complete the main floor. There is a full basement and large attic space that can be finished as well. Schedule your showing today!
-
2021-12-04historical Active Under Contract 331-char remark
Show marketing remark (331 chars)
Come view this updated ALL BRICK RANCH home! The home welcomes you with a covered porch beautiful hardwood floors and a featured arch in the main area. 3 bedrooms, living room, dining room and kitchen complete the main floor. There is a full basement and large attic space that can be finished as well. Schedule your showing today!
-
2021-11-23status Pending 331-char remark
Show marketing remark (331 chars)
Come view this updated ALL BRICK RANCH home! The home welcomes you with a covered porch beautiful hardwood floors and a featured arch in the main area. 3 bedrooms, living room, dining room and kitchen complete the main floor. There is a full basement and large attic space that can be finished as well. Schedule your showing today!
-
2021-11-09$79,900 Active 331-char remark
Show marketing remark (331 chars)
Come view this updated ALL BRICK RANCH home! The home welcomes you with a covered porch beautiful hardwood floors and a featured arch in the main area. 3 bedrooms, living room, dining room and kitchen complete the main floor. There is a full basement and large attic space that can be finished as well. Schedule your showing today!
-
2013-11-27soldstatus $16,000
Show marketing remark (208 chars)
Great buy for the price, this three bedroom brick is on a well maintained street, quiet neighborhood. This home includes a full basement and a large fenced-in yard. Take a look at this home and fall in love!!
-
2013-09-20$20,000
Show marketing remark (208 chars)
Great buy for the price, this three bedroom brick is on a well maintained street, quiet neighborhood. This home includes a full basement and a large fenced-in yard. Take a look at this home and fall in love!!
ⓘ Source: listings_history table (triggers on properties + properties_extension) + one-shot
backfill from property_details.listing_events for pre-trigger history.
Climate risk First Street
- Flood 1/10 Low FEMA zone X (unshaded) · 0% chance over 30 yrs
- Wildfire 3/10 Moderate
- Heat 3/10 Moderate 7 d/yr ≥102°F today · 15 d/yr by 30 yrs out
- Wind 2/10 Low 100% chance of damaging wind over 30 yrs
- Air quality 4/10 Moderate 6 unhealthy d/yr today · 7 by 30 yrs out
Nearby sold comps map
Loading sold comps map…
Walkable amenities ~0.75 mi
Loading nearby amenities…
Taxation est. · year 1
- Rental income
- $13,263
- − Mortgage interest
- −$0
- − Property taxes
- −$0
- − Insurance
- −$0
- − Repairs & maintenance
- −$1,061
- − Management
- −$1,061
- − Depreciation
- −$0
- Taxable income
- $11,141
- Est. tax owed @ 24.0%
- −$2,674
- After-tax cash flow
- $7,804/yr
For passive investors: Depreciation is non-cash, so a rental often shows a tax loss while cash-flowing — sheltering income. Rental losses are passive: they offset passive income freely, and up to $25,000/yr can offset ordinary (W-2) income if you actively participate and your MAGI is under $100k (phasing out to $0 by $150k); unused losses carry forward. On sale, claimed depreciation is recaptured at up to 25%, and gains may owe capital-gains tax (a 1031 exchange can defer both). Figures are a year-1 estimate at your 24.0% rate — not tax advice; consult a CPA.
Schools (NCES district)
- District
- Gary Community School Corporation
- NCES district ID
- 1803870
- Math proficiency
- 3% ▼ -10.00%
- Reading proficiency
- 11% ▼ -6.00%
- Median HH income
- $27,739
- Composite
- 4.98/100
- National rank
- #10039
- State rank
- #299 of 301 in IN
Livability — Gary
- Score
- 73/100
- State rank
- #105
- US rank
- #5592
Category grades
Schools grade is shown separately in the Schools card above.
Census & demographics
- Census place
- Gary, IN
- County
- Lake County · 422,878 people
- City population
- 63,701
- Metro
- Chicago-Naperville-Elgin, IL-IN-WI
- Population (ZIP)
- 8,577
- Household income
- $28,526
- Rent vs Own
- Severe rent burden
- 392.0
Population outlook (Lake County) Hauer SSP2
- Today (2025)
- 484,026 people
- By 2030
- 478,091 · -1.2%
- By 2040
- 462,974 · -4.3%
- By 2050
- 449,894 · -7.1%
- By 2075
- 436,169 · -9.9%
- By 2100
- 426,607 · -11.9%
Race, ethnicity, and origin ACS 2023
- Neighborhood character
- Predominantly Black (91%)
- Race & ethnicity
- Black 91% Hispanic / Latino 3% White 2% Two or more races 1%
- Common ancestry
- Romanian 1%
- Foreign-born
- 1% · Canada
- Languages at home
- 97% English-only · Spanish 1% Russian/Polish/Slavic 1% French/Haitian/Cajun 1%
Political lean MEDSL · Lake
- 2024 margin
- Lean D (+5.6) · D 52.1% · R 46.5% · Other 1.5%
- 2008→2024 swing
- -28.6pp toward R · 2008: 34.3pp · 2024: 5.6pp
- All cycles
- 2024: D+5.6 2020: D+15.1 2016: D+20.6 2012: D+31.0 2008: D+34.3
Not yet ingested
- Civics
- —
Market trends
- HPI YoY
- ▲ 0.98%
- Current HPI
- 253.2856
- Rent YoY
- —
- Metro
- Chicago-Naperville-Elgin, IL-IN-WI
- State GDP YoY
- ▲ 2.90%
- F500 in state
- 18
Industry mix (Fortune 500 HQ in IN)
| Industry | F500 HQs | Revenue |
|---|---|---|
| Industrial Machinery | 2 | $37B |
|
||
| Healthcare | 1 | $177B |
|
||
| Pharmaceuticals | 1 | $45B |
|
||
| Metals / Steel | 1 | $18B |
|
||
| Agriculture | 1 | $17B |
|
||
| Packaging | 1 | $12B |
|
||
Price history
+310.0% since first listed9 events — show timeline
- 2026-05-19 Pending — NIRA MLS as Distributed by MLS Grid
- 2026-05-05 Listed $1 NIRA MLS as Distributed by MLS Grid
- 2022-01-18 Sold (MLS) $82,000 NIRA MLS as Distributed by MLS Grid
- 2021-12-07 Price Changed $85,000 NIRA MLS as Distributed by MLS Grid
- 2021-12-04 Contingent — NIRA MLS as Distributed by MLS Grid
- 2021-11-23 Pending — NIRA MLS as Distributed by MLS Grid
- 2021-11-09 Listed $79,900 NIRA MLS as Distributed by MLS Grid
- 2013-11-27 Sold (MLS) $16,000 NIRA MLS as Distributed by MLS Grid
- 2013-09-20 Listed $20,000 NIRA MLS as Distributed by MLS Grid
Property tax history
-11.7%/yrLatest (2024): $953 · -52.5% YoY. Source: county tax records.
Cash-flow waterfall
monthlySold comps — $/sqft
last 12 mo · ≤1 miLoading sold comps…