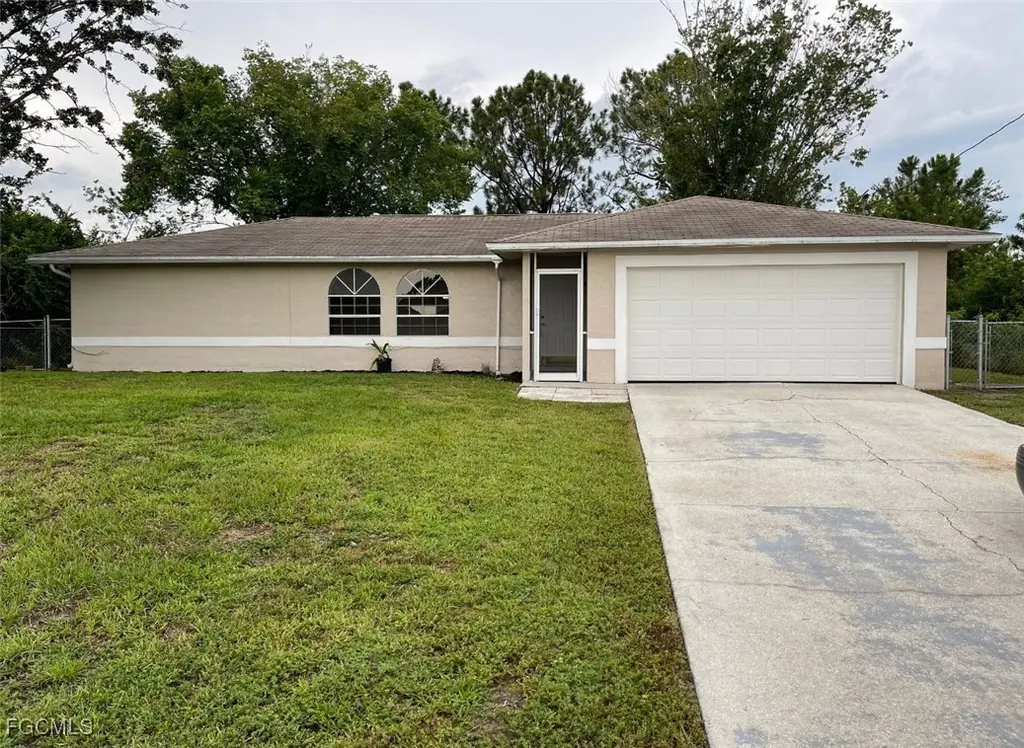
2609 13th St SW · Lehigh Acres, FL
Flood risk 1/10 · Minimal
- FEMA flood zone
- X (unshaded)
- Chance of flooding over 30 yrs
- 0.0%
- Est. flood insurance / yr
- $507 – $1,088
Fire risk 3/10 · Minor
- Est. fire insurance / yr
- $947 – $1,759
Heat risk 10/10 · Severe
- Hot days now (above 107°F)
- 7 days/yr
- Hot days in 30 yrs
- 27 days/yr
Wind risk 10/10 · Severe
- Chance of severe wind over 30 yrs
- 99.0%
Air-quality risk 2/10 · Minimal
- Unhealthy air days now
- 1 days/yr
- Unhealthy air days in 30 yrs
- 1 days/yr
Risk factors via First Street. Map © Google.
Why this score? — see what drove the C- grade
The composite is a weighted blend of 9 inputs, each scored 0–100. Each bar is that input's sub-score; the figure is the points it added to the 100-point composite (weight × sub-score).
- Cash flow +13.3/30.0
- ARV discount +11.8/15.0
- Appreciation +10.0/10.0
- Schools +4.1/10.0
- DSCR +4.0/10.0
- 1% rule +3.6/10.0
- Livability +3.0/5.0
- Condition / age +2.5/5.0
- Rent growth +2.1/5.0
$215,000
🖨 Deal sheet (PDF) 📄 Offer letter ✓ Due diligence
Listing remarks MLS
Not a short sale or a foreclosure! Warm laminate wood floors, fresh paint with sunlight. There is an extra large bathtub in the Master Bedroom. There is Berber carpet in the bedrooms, tiled floors in the bathrooms, and lots of beautiful wood flooring throughout the home. The kitchen has a pass through opening to make dinner easier. The windows inside the home provide excellent lighting. The two car garage is clean as a whistle with painted floors. Outside you're surrounded with peace and tranquility and fresh Florida air.
Key facts
- Commuter location
- Concrete patio
- Jetted tub
Tags
Property features AI
Finance
- Financial info: Land lease noted (expires 2025-12-18); Pets allowed
- HOA & community: No association fee reported
Exterior
- Parking: Attached 2-car garage with garage door opener
- Security: Smoke detector(s)
- Utilities: Well water; Septic tank; Cable available
- Home design: Single-story home; Northeast facing; Resale property
- Construction: Vinyl siding; Wood frame construction; Shingle roof; Built on foundation (resale)
- Exterior features: Fenced yard; Room for a pool; Rectangular lot; Lot dimensions approximately 80 x 125 x 80 x 125; Southwest exposure; Publicly maintained road
Interior
- Kitchen: Dishwasher; Range; Refrigerator
- Flooring: Carpet; Laminate
- Bathrooms: 2 full bathrooms
- Heating & cooling: Central heating (electric); Central air conditioning (electric); Ceiling fan(s)
- Interior features: Vaulted ceiling(s); Living/Dining room; Pantry; Tub with shower; Walk-in closet(s); Split bedroom layout; Single-hung windows; Unfurnished
- Laundry & utility: Washer hookup in garage; Dryer hookup in garage
Neighborhood map
What this means for you Summary
Snapshot
- This is a 3-bed/2.0-bath single-family listed at $215k.
Deal economics
- At list price, monthly cash flow is $-2 ($-21/yr) — negative.
- To cash-flow at today's rent, offer at most $215k (0.1% below list).
- To meet the 1% rule (rent ≥ 1% of price), the offer needs to be $185k (13.8% below list).
- Recommended offer: $185k (13.8% below list) — sets the bar for 1% rule.
- Cap rate 6.3% vs local median 4.7% in Lehigh Acres — top-decile yield for the area; either an underpriced asset or a hidden risk that comps aren't pricing in. Stress-test before assuming the spread holds.
Location & tenants
- Location reads 59/100 on livability (#826 in FL) — a working-class tenant base; expect higher turnover. Strengths: cost of living A+, housing A+; Watch: crime C-, employment D+, schools D-.
- Lee (suburban): math 47% / reading 50% proficiency, ranked #42 of 73 in FL (top 58%) — families likely to look elsewhere, expect single-tenant / working-renter base with shorter leases.
- Market conditions: Rents soft (-1.5%/yr); 786 active listings in the ZIP; 40 comparable units currently listed for rent nearby; rentals at typical pace (median 24d on market — plan ~3-4 weeks tenant-placement turnaround); 15,411 units permitted in Lee County in 2024 (4,686 in 5+ unit buildings).
- This rent runs 31% of the median local income ($73k/yr) — at the standard rent-burdened threshold; future hikes will face affordability resistance.
Forward outlook
- In year one you build about $23k of equity ($1k loan paydown + $22k appreciation (10.0% local appreciation)).
- Lee County population projected at +44% by 2050 — long-run rental-demand tailwind backs the buy-and-hold thesis.
- At projected returns (10.0% appreciation + 0.0% rent growth), your $60k cash investment doubles in ~3 years — after that, you're playing with house money.
- By year 2, paydown + projected appreciation supports a ~$37k cash-out refi (75% LTV) — recoverable capital for the next deal without selling this one.
Negotiation context
- It's been on market 290 days — a 12% lower offer ($189k) is reasonable based on typical stale-listing flexibility.
- 2 sale attempts; this cycle's ask has dropped $45k (17%) from the opening price — seller is motivated, your offer sets the floor, not the list.
- Current owner paid $44k; list at $215k implies a 389% gain — meaningful room to come down on a strong offer.
Risks & watch-outs
- Climate carrying-cost: severe wind risk, 99% chance of damaging wind over 30y; extreme-heat days projected 7→27/yr by 2055 (HVAC capex compounding) — expect insurance premiums to compound above CPI over the hold.
Questions for the listing agent
- What do current leases actually rent for vs. the listed asking? Can we see a recent rent roll and the last 12 months of T-12 income?
- It's been on market 290 days. Have you received any prior offers? Is the seller open to a 14% concession, seller financing, or rate buy-down credit?
- Why hasn't it sold? Are there any deal-killer items the seller is aware of (foundation, flood, title, zoning, code violations)?
- Is there a deadline driving the sale (1031 exchange, divorce, estate, relocation)? That informs how much negotiation room exists.
- Schools are D-rated, which usually means shorter tenancies and higher turnover. Who's the typical renter profile here, and what's been the actual vacancy rate?
- What's the average days-on-market for RENTAL listings here right now (not sales)? A rising rental-DOM trend means longer vacancies and softer asking-rent achievability than the comps imply.
- What's the recent tenant-quality profile in this submarket — average credit score on applications, eviction rate, late-payment / NSF rate, and stable-employment percentage? A property-management company in the area should have these aggregated.
- How much new for-sale + rental construction is in the pipeline within 1–3 miles? Heavy new supply typically softens prices + rents 12–24 months out; constrained supply supports both.
Investment metrics
- 1% rule
- 0.86% ✗
- Cap rate
- 6.28%
- Cash-on-cash
- -0.04%
- DSCR
- 1.00
- GRM
- 9.7
CMA / ARV
- ARV (on-the-fly)
- $237,440
- Comps found
- 8
Show comp detail 8 sales within ~0.75 mi
| Address | Dist | Beds/Ba | Sqft | Sold | Price | $/sf | Match |
|---|---|---|---|---|---|---|---|
| 2616 14th St SW | 0.07mi | 3/2.0 | 1,154 (+3%) | 0mo | $220,000 | $191 | 91 |
| 2519 22nd St SW | 0.56mi | 3/3.0 | 1,075 (-4%) | 1mo | $309,000 | $287 | 62 |
| 1642 Cheshire Cir N | 0.44mi | 3/2.0 | 1,224 (+9%) | 9mo | $259,900 | $212 | 56 |
| 1425 Alwynne Dr | 0.63mi | 2/2.0 (-1) | 1,096 (-2%) | 13mo | $248,000 | $226 | 51 |
| 9712 Maplecrest Cir | 0.68mi | 2/2.0 (-1) | 1,220 (+9%) | 1mo | $180,000 | $148 | 48 |
| 419 Candlewick Cir S | 0.52mi | 3/2.0 | 1,269 (+13%) | 17mo | $259,900 | $205 | 39 |
| 3015 12th St SW | 0.69mi | 3/2.0 | 1,280 (+14%) | 13mo | $300,000 | $234 | 33 |
| 9801 Maplecrest Cir | 0.68mi | 2/2.0 (-1) | 1,268 (+13%) | 24mo | $250,000 | $197 | 21 |
Match score weights: distance 35% · size 25% · config 20% · recency 20%. Top-matched comps best support the ARV.
Projected returns pro-forma
10.0% appreciation · 0.0% rent growth · sell at horizon
- IRR
- 23.3%
- Equity multiple
- 2.85×
- Total profit
- $111,565
- Equity at exit
- $193,689
- IRR
- 20.1%
- Equity multiple
- 6.30×
- Total profit
- $318,932
- Equity at exit
- $417,698
Cash invested: $60,200 (down + closing). Projections, not guarantees.
Landlord ↔ Tenant lean methodology
- Overall (STATE)
- 87 Strongly Landlord-Friendly
- State Florida
- 87 Strongly Landlord-Friendly · R+3
- County
- — inherits STATE
- City
- — inherits STATE
ZIP-level market 33976
- Home prices YoY
- 6.8%
- Rents YoY
- -1.5%
- Active inventory
- 786
- Price-to-rent
- 9.7×
Monthly cashflow live
- Estimated rent
- $1,854 high interval (Pro) →
- Mortgage (P&I)
- −$1,127
- Tax from tax record
- −$249 /mo · $2,993/yr
- Insurance
- −$90
- HOA
- −$0
- Vacancy / Maint / Mgmt
- −$389
- Net cashflow
- $-2
Break-even live
Sensitivity live
| Price | -10% $120 | -5% $59 | +0% $-2 | +5% $-63 | +10% $-123 |
|---|---|---|---|---|---|
| Rent | -10% $-148 | -5% $-75 | +0% $-2 | +5% $71 | +10% $145 |
| Rate | -1.0pp $107 | -0.5pp $53 | base $-2 | +0.5pp $-57 | +1.0pp $-114 |
UW: 25.0% down · 7.5% · 30yr · 1.5% tax · 5.0% vac · 8.0% maint · 8.0% mgmt
Financing live
Cash to close
- Down payment
- $53,750
- Closing costs
- $6,450
- Reserves months
- —
- Total cash needed
- —
Loan-product check · same deal, 3 products live
Conventional
25% down · 7.5% · 30yr
- Down + closing
- —
- Monthly P&I
- —
- Monthly cashflow
- —
- DSCR
- —
- Eligible?
- —
Personal DTI + credit; lowest rate.
DSCR
20% down · 8.5% · 30yr
- Down + closing
- —
- Monthly P&I
- —
- Monthly cashflow
- —
- DSCR
- —
- Eligible?
- —
No personal income docs; deal must DSCR.
Hard money
10% down · 12.0% · 12mo
- Down + closing
- —
- Monthly P&I
- —
- Monthly cashflow
- —
- DSCR
- —
- Eligible?
- —
Short-term bridge; refi at stabilization.
Rent comps 40 comps
| Address | Beds | Baths | Sqft | Rent | $/sqft | DOM | Units | Dist |
|---|---|---|---|---|---|---|---|---|
| 2805 20th St SW Lehigh Acres, FL | 3.0 | 2.0 | 1151 | $1,699 | $1.48 | 3d | 1 | 0.46mi |
| 2909 15th St SW Lehigh Acres, FL | 3.0 | 2.0 | 1291 | $1,800 | $1.39 | 21d | 1 | 0.48mi |
| 1423 Caywood Cir S Lehigh Acres, FL | 2.0 | 2.0 | 960 | $1,376 | $1.43 | 3d | 1 | 0.62mi |
| 2602 24th St SW Lehigh Acres, FL | 3.0 | 2.0 | 1358 | $1,800 | $1.33 | 3d | 1 | 0.63mi |
| 2916 7th St SW Lehigh Acres, FL | 3.0 | 2.0 | 1357 | $1,900 | $1.40 | 24d | 1 | 0.63mi |
| 10 Beth Stacey Blvd #206 Lehigh Acres, FL | 2.0 | 2.0 | 1012 | $1,100 | $1.09 | 3d | 1 | 0.69mi |
| 28 Cosmopolitan Dr #13 Lehigh Acres, FL | 2.0 | 2.0 | 973 | $1,375 | $1.41 | 15d | 1 | 0.70mi |
| 59 Camelot Gardens Blvd #110 Lehigh Acres, FL | 2.0 | 2.0 | 1166 | $1,800 | $1.54 | 24d | 1 | 0.74mi |
| 111 Yellowtail Loop #3 Lehigh Acres, FL | 2.0 | 2.0 | 1100 | $1,750 | $1.59 | 24d | 1 | 0.76mi |
| 2811 25th St SW Unit NA Lehigh Acres, FL | 3.0 | 2.0 | 1430 | $1,990 | $1.39 | 24d | 1 | 0.79mi |
| 3103 11th St SW Lehigh Acres, FL | 3.0 | 2.0 | 1212 | $1,800 | $1.49 | 24d | 1 | 0.80mi |
| 18461 Copperhead Dr #436 Lehigh Acres, FL | 2.0 | 2.0 | 1154 | $3,495 | $3.03 | 24d | 1 | 0.81mi |
| 18461 Copperhead Dr #431 Lehigh Acres, FL | 3.0 | 2.0 | 1301 | $3,995 | $3.07 | 24d | 1 | 0.81mi |
| 18461 Copperhead Dr #421 Lehigh Acres, FL | 3.0 | 2.0 | 1301 | $1,895 | $1.46 | 24d | 1 | 0.81mi |
| 219 Beth Stacey Blvd Lehigh Acres, FL | 2.0 | 2.0 | 997 | $1,300 | $1.30 | 21d | 1 | 0.83mi |
| 1507 Markdale St E Lehigh Acres, FL | 2.0 | 1.0 | 997 | $1,300 | $1.30 | 3d | 1 | 0.84mi |
| 18451 Copperhead Dr #522 Lehigh Acres, FL | 2.0 | 2.0 | 1120 | $1,895 | $1.69 | 24d | 1 | 0.84mi |
| 312 Grovewood Ave S Lehigh Acres, FL | 2.0 | 2.0 | 1325 | $1,800 | $1.36 | 24d | 1 | 0.88mi |
| 9099 Aegean Cir Lehigh Acres, FL | 2.0 | 2.0 | 1120 | $1,499 | $1.34 | 24d | 1 | 0.91mi |
| 18266 Minorea Ln Lehigh Acres, FL | 3.0 | 2.0 | 1408 | $1,650 | $1.17 | 24d | 1 | 0.94mi |
| 18261 Minorea Ln Lehigh Acres, FL | 2.0 | 2.0 | 1402 | $1,595 | $1.14 | 3d | 1 | 0.94mi |
| 18261 Minorea Ln Lehigh Acres, FL | 2.0 | 2.0 | 1402 | $1,800 | $1.28 | 24d | 1 | 0.94mi |
| 9112 Aegean Cir Lehigh Acres, FL | 3.0 | 2.0 | 1409 | $1,600 | $1.14 | 3d | 1 | 0.95mi |
| 9123 Aegean Cir Lehigh Acres, FL | 2.0 | 2.0 | 1120 | $1,474 | $1.32 | 3d | 1 | 0.96mi |
| 18303 Gibraltar Ln Lehigh Acres, FL | 4.0 | 2.0 | 1203 | $1,549 | $1.29 | 15d | 1 | 0.96mi |
| 18303 Gibraltar Ln Lehigh Acres, FL | 4.0 | 2.0 | 1203 | $1,599 | $1.33 | 24d | 1 | 0.96mi |
| 18421 Copperhead Dr #222 Lehigh Acres, FL | 2.0 | 2.0 | 1154 | $1,700 | $1.47 | 24d | 1 | 0.96mi |
| 9131 Aegean Cir Lehigh Acres, FL | 3.0 | 2.0 | 1400 | $1,574 | $1.12 | 21d | 1 | 0.98mi |
| 9131 Aegean Cir Lehigh Acres, FL | 3.0 | 2.0 | 1400 | $1,574 | $1.12 | 24d | 1 | 0.98mi |
| 18411 Copperhead Dr #346 Lehigh Acres, FL | 2.0 | 2.0 | 1061 | $1,695 | $1.60 | 21d | 1 | 0.99mi |
| 9137 Aegean Cir Lehigh Acres, FL | 2.0 | 2.0 | 1120 | $1,474 | $1.32 | 3d | 1 | 0.99mi |
| 9137 Aegean Cir Lehigh Acres, FL | 2.0 | 2.0 | 1120 | $1,474 | $1.32 | 24d | 1 | 0.99mi |
| 18321 Gibraltar Ln Lehigh Acres, FL | 4.0 | 2.0 | 1203 | $1,675 | $1.39 | 24d | 1 | 1.00mi |
| 3202 21st St SW Lehigh Acres, FL | 3.0 | 2.0 | 1100 | $1,920 | $1.75 | 3d | 1 | 1.01mi |
| 18461 Copperhead Dr Unit 1546499P Lehigh Acres, FL | 2.0 | 2.0 | 1194 | $1,941 | $1.63 | 14d | 1 | 1.02mi |
| 18461 Copperhead Ct N #444 Lehigh Acres, FL | 2.0 | 2.0 | 1120 | $2,300 | $2.05 | 24d | 1 | 1.02mi |
| 9161 Aegean Cir Lehigh Acres, FL | 2.0 | 2.0 | 1120 | $1,650 | $1.47 | 14d | 1 | 1.03mi |
| 1407 Juddale St E Lehigh Acres, FL | 2.0 | 1.0 | 997 | $1,450 | $1.45 | 3d | 1 | 1.04mi |
| 9177 Aegean Cir Lehigh Acres, FL | 4.0 | 2.0 | 1203 | $1,549 | $1.29 | 24d | 1 | 1.04mi |
| 1405 Juddale St E Lehigh Acres, FL | 2.0 | 2.0 | 1302 | $1,400 | $1.08 | 24d | 1 | 1.05mi |
Listing history 21 events
-
2026-06-17days on market $215,000 Active 290 DOM
-
2026-06-16days on market $215,000 Active 289 DOM
-
2026-06-16days on market $215,000 Active 288 DOM
-
2026-06-13pricedays on market $215,000 Active 286 DOM
-
2026-06-09days on market $220,000 Active 282 DOM
-
2026-06-07days on market $220,000 Active 280 DOM
-
2026-06-02days on market $220,000 Active 275 DOM
-
2026-06-01days on market $220,000 Active 274 DOM
-
2026-06-01days on market $220,000 Active 273 DOM
-
2026-05-07price $220,000
-
2026-03-23status Active
-
2026-03-05status Pending
-
2026-02-19price $230,000
-
2025-09-28price $240,000
-
2025-08-12$259,900 Active
-
2011-05-05soldstatus $44,000
-
2011-05-04price $51,000 528-char remark
Show marketing remark (528 chars)
Not a short sale or a foreclosure! Warm laminate wood floors, fresh paint with sunlight. There is an extra large bathtub in the Master Bedroom. There is Berber carpet in the bedrooms, tiled floors in the bathrooms, and lots of beautiful wood flooring throughout the home. The kitchen has a pass through opening to make dinner easier. The windows inside the home provide excellent lighting. The two car garage is clean as a whistle with painted floors. Outside you're surrounded with peace and tranquility and fresh Florida air.
-
2011-04-29soldstatus $44,000 528-char remark
Show marketing remark (528 chars)
Not a short sale or a foreclosure! Warm laminate wood floors, fresh paint with sunlight. There is an extra large bathtub in the Master Bedroom. There is Berber carpet in the bedrooms, tiled floors in the bathrooms, and lots of beautiful wood flooring throughout the home. The kitchen has a pass through opening to make dinner easier. The windows inside the home provide excellent lighting. The two car garage is clean as a whistle with painted floors. Outside you're surrounded with peace and tranquility and fresh Florida air.
-
2010-12-21soldstatus $30,000 222-char remark
Show marketing remark (222 chars)
This is a Short Sale subject to existing lender's approval which could result in delays. This is a short sale and subject to third party approval which may result in delays. 3 bedroom 2 bath home in Southwest Lehigh Acres.
-
2006-05-22soldstatus $190,000
-
1995-03-20soldstatus $64,900
ⓘ Source: listings_history table (triggers on properties + properties_extension) + one-shot
backfill from property_details.listing_events for pre-trigger history.
Tax reassessment forecast FL · Resets to sale price
- Current annual tax
- $2,993 · $249/mo
- Projected year-2 tax
- $2,993 · $249/mo
- Expected delta
- $0/yr ($0/mo · 0.0%)
ⓘ Screening estimate from a state-policy table — verify with the county assessor before closing.
Climate risk First Street
- Flood 1/10 Low FEMA zone X (unshaded) · 0% chance over 30 yrs
- Wildfire 3/10 Moderate
- Heat 10/10 Extreme 7 d/yr ≥107°F today · 27 d/yr by 30 yrs out
- Wind 10/10 Extreme 99% chance of damaging wind over 30 yrs
- Air quality 2/10 Low 1 unhealthy d/yr today · 1 by 30 yrs out
Nearby sold comps map
Loading sold comps map…
Walkable amenities ~0.75 mi
Loading nearby amenities…
Taxation est. · year 1
- Rental income
- $22,248
- − Mortgage interest
- −$12,043
- − Property taxes
- −$2,993
- − Insurance
- −$1,075
- − Repairs & maintenance
- −$1,780
- − Management
- −$1,780
- − Depreciation
- −$6,255
- Taxable loss
- −$3,677
- Est. tax savings @ 24.0%
- +$882
- After-tax cash flow
- $861/yr
For passive investors: Depreciation is non-cash, so a rental often shows a tax loss while cash-flowing — sheltering income. Rental losses are passive: they offset passive income freely, and up to $25,000/yr can offset ordinary (W-2) income if you actively participate and your MAGI is under $100k (phasing out to $0 by $150k); unused losses carry forward. On sale, claimed depreciation is recaptured at up to 25%, and gains may owe capital-gains tax (a 1031 exchange can defer both). Figures are a year-1 estimate at your 24.0% rate — not tax advice; consult a CPA.
Schools (NCES district)
- District
- Lee
- NCES district ID
- 1201080
- Math proficiency
- 47% ▼ -11.00%
- Reading proficiency
- 50% ▼ -4.00%
- Median HH income
- $49,518
- Composite
- 41.49/100
- National rank
- #3458
- State rank
- #42 of 73 in FL
Livability — Lehigh Acres
- Score
- 59/100
- State rank
- #826
- US rank
- #20055
Category grades
Schools grade is shown separately in the Schools card above.
Census & demographics
- Census place
- Lehigh Acres, FL
- County
- Lee County · 788,662 people
- City population
- 130,638
- Metro
- Cape Coral-Fort Myers, FL
- Population (ZIP)
- 20,277
- Household income
- $72,679
- Rent vs Own
- Severe rent burden
- 574.0
Population outlook (Lee County) Hauer SSP2
- Today (2025)
- 871,946 people
- By 2030
- 955,468 · +9.6%
- By 2040
- 1,113,587 · +27.7%
- By 2050
- 1,256,891 · +44.1%
- By 2075
- 1,560,270 · +78.9%
- By 2100
- 1,726,848 · +98.0%
Race, ethnicity, and origin ACS 2023
- Neighborhood character
- Diverse neighborhood (Simpson 0.65)
- Race & ethnicity
- Hispanic / Latino 50% Two or more races 30% White 24% Black 20% Asian 3%
- Hispanic origin (detail)
- Mexican 8% Puerto Rican 8% Cuban 18% Dominican 4%
- Common ancestry
- Hispanic 8% Slovak 1% Lithuanian 1%
- Foreign-born
- 35% · Canada, Jamaica, Vietnam
- Languages at home
- 46% English-only · Spanish 43% French/Haitian/Cajun 8% Vietnamese 1%
Political lean MEDSL · Lee
- 2024 margin
- Strong R (+28.4) · D 35.5% · R 63.9%
- 2008→2024 swing
- -18.0pp toward R · 2008: -10.4pp · 2024: -28.4pp
- All cycles
- 2024: R+28.4 2020: R+19.2 2016: R+20.4 2012: R+16.6 2008: R+10.4
Not yet ingested
- Civics
- —
Market trends
- HPI YoY
- ▲ 21.77%
- Current HPI
- 340.4255
- Rent YoY
- ▼ -1.54%
- Metro
- Cape Coral-Fort Myers, FL
- State GDP YoY
- ▲ 3.28%
- F500 in state
- 36
Industry mix (Fortune 500 HQ in FL)
| Industry | F500 HQs | Revenue |
|---|---|---|
| Industrial Technology | 2 | $29B |
|
||
| Insurance | 2 | $17B |
|
||
| Retail | 1 | $60B |
|
||
| Technology Distribution | 1 | $58B |
|
||
| Homebuilding | 1 | $35B |
|
||
| Technology Manufacturing | 1 | $35B |
|
||
Price history
+239.0% since first listed12 events — show timeline
- 2026-05-07 Price Changed $220,000 FORTMLS
- 2026-03-23 Relisted — FORTMLS
- 2026-03-05 Pending — FORTMLS
- 2026-02-19 Price Changed $230,000 FORTMLS
- 2025-09-28 Price Changed $240,000 FORTMLS
- 2025-08-12 Listed $259,900 FORTMLS
- 2011-05-05 Sold (Public Records) $44,000 Public Records
- 2011-05-04 Price Changed $51,000 FORTMLS
- 2011-04-29 Sold (MLS) $44,000 FORTMLS
- 2010-12-21 Sold (MLS) $30,000 FORTMLS
- 2006-05-22 Sold (Public Records) $190,000 Public Records
- 1995-03-20 Sold (Public Records) $64,900 Public Records
Property tax history
+9.7%/yrLatest (2025): $2,993 · -7.0% YoY. Source: county tax records.
Cash-flow waterfall
monthlySold comps — $/sqft
last 12 mo · ≤1 miLoading sold comps…