20940 SE 141st Ln · Umatilla, FL
Flood risk 1/10 · Minimal
- FEMA flood zone
- X (unshaded)
- Chance of flooding over 30 yrs
- 0.0%
- Est. flood insurance / yr
- $507 – $1,088
Fire risk 4/10 · Minor
- Est. fire insurance / yr
- $947 – $1,759
Heat risk 8/10 · Major
- Hot days now (above 108°F)
- 7 days/yr
- Hot days in 30 yrs
- 21 days/yr
Wind risk 9/10 · Severe
- Chance of severe wind over 30 yrs
- 99.0%
Air-quality risk 3/10 · Minor
- Unhealthy air days now
- 3 days/yr
- Unhealthy air days in 30 yrs
- 3 days/yr
Risk factors via First Street. Map © Google.
Why this score? — see what drove the D grade
The composite is a weighted blend of 9 inputs, each scored 0–100. Each bar is that input's sub-score; the figure is the points it added to the 100-point composite (weight × sub-score).
- Cash flow +15.0/30.0
- ARV discount +7.5/15.0
- 1% rule +5.0/10.0
- DSCR +5.0/10.0
- Livability +3.7/5.0
- Schools +3.6/10.0
- Rent growth +2.5/5.0
- Condition / age +2.5/5.0
- Appreciation +0.0/10.0
$17,000
🖨 Deal sheet 📄 Offer letter ✓ Due diligence
Listing remarks
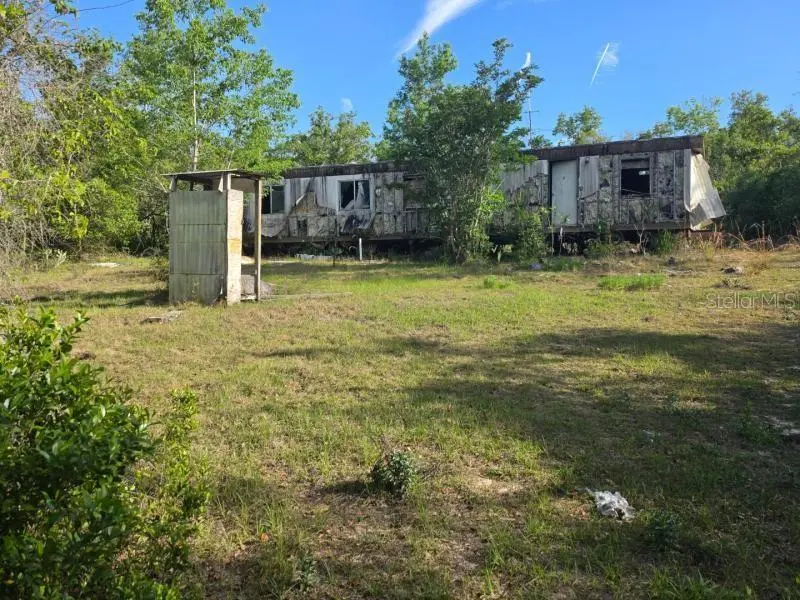
CHECK OUT THIS Spacious 0.37-acre residential lot featuring an existing tear down mobile home. This property offers a great opportunity for investors, builders, or buyers looking to renovate or replace with a new home. Plenty of room for expansion, outdoor living, or additional improvements. Conveniently located with easy access to nearby amenities, shopping, and major roadways. Endless potential to make it your own.
Key facts
- Major roadways
- Shopping
- Room for expansion
Tags
Property features AI
Finance
- Other: Lot about 0.37 acres (0.25–0.5 acre range); Located on a road with other surface type; One well and one septic on property; Unfurnished
- HOA & community: No association
Exterior
- Utilities: Well water; Septic tank; Other utilities
- Home design: Residential manufactured home (single wide); One story; South-facing entry
- Construction: Frame construction; Shingle roof; Pillar/Post/Pier foundation; Built as a fixer
- Exterior features: Other exterior features
Interior
- Bedrooms: 2 bedrooms
- Flooring: Wood flooring
- Bathrooms: 1 full bathroom
- Heating & cooling: No heating; No cooling
- Interior features: Open floorplan; Other interior features
- Laundry & utility: Laundry: Other
Neighborhood map
What this means for you Summary
Snapshot
- This is a 2-bed/1.0-bath manufactured listed at $17k.
Deal economics
- At list price, monthly cash flow is $842 ($10k/yr) — positive.
- The deal already cash-flows at list — no discount required.
- Meets the 1% rule at list price ($1k rent vs $17k).
- Cap rate 65.7% vs local median 2.9% in Umatilla — top-decile yield for the area; either an underpriced asset or a hidden risk that comps aren't pricing in. Stress-test before assuming the spread holds.
Location & tenants
- Location reads 73/100 on livability (#300 in FL) — a middle-class / working-renter tenant base. Strengths: crime A+, cost of living A+, health & safety A+; Watch: employment C-, amenities F, commute F.
- Marion (rural): math 42% / reading 43% proficiency, ranked #61 of 73 in FL (top 84%) — families likely to look elsewhere, expect single-tenant / working-renter base with shorter leases; 61% free/reduced lunch — lower-income household profile, screen leases tightly.
- Market conditions: 223 active listings in the ZIP; 7,071 units permitted in Marion County in 2024 (534 in 5+ unit buildings).
Forward outlook
- Local home prices are declining (-3.0%/yr); year-one equity from $118 of loan paydown is wiped out by about $510 of value loss. Plan a longer hold.
- Marion County population projected at +13% by 2050 — modest demand growth; plan on rents tracking national, not racing it.
- At projected returns (-3.0% appreciation + 3.0% rent growth), your $5k cash investment doubles in ~1 year — after that, you're playing with house money.
Negotiation context
- Only 14 days on market — expect competitive offers; lowballing is unlikely to land.
Risks & watch-outs
- Climate carrying-cost: severe wind risk, 99% chance of damaging wind over 30y; extreme-heat days projected 7→21/yr by 2055 (HVAC capex compounding) — expect insurance premiums to compound above CPI over the hold.
Questions for the listing agent
- Is there a deadline driving the sale (1031 exchange, divorce, estate, relocation)? That informs how much negotiation room exists.
- The area grade is low — what's the realistic commute time and amenity access for the typical tenant pool here? Any planned neighborhood developments (good or bad) we should know about?
- What's the average days-on-market for RENTAL listings here right now (not sales)? A rising rental-DOM trend means longer vacancies and softer asking-rent achievability than the comps imply.
- What's the recent tenant-quality profile in this submarket — average credit score on applications, eviction rate, late-payment / NSF rate, and stable-employment percentage? A property-management company in the area should have these aggregated.
- How much new for-sale + rental construction is in the pipeline within 1–3 miles? Heavy new supply typically softens prices + rents 12–24 months out; constrained supply supports both.
Investment metrics
- 1% rule
- 7.25% ✓
- Cap rate
- 65.74%
- Cash-on-cash
- 212.31%
- DSCR
- 10.45
- GRM
- 1.1
CMA / ARV
No comps found within radius.
Projected returns pro-forma
-3.0% appreciation · 3.0% rent growth · sell at horizon
- IRR
- —
- Equity multiple
- 11.70×
- Total profit
- $50,910
- Equity at exit
- $2,535
- IRR
- —
- Equity multiple
- 24.85×
- Total profit
- $113,509
- Equity at exit
- $1,470
Cash invested: $4,760 (down + closing). Projections, not guarantees.
Landlord ↔ Tenant lean methodology
- Overall (STATE)
- 87 Strongly Landlord-Friendly
- State Florida
- 87 Strongly Landlord-Friendly · R+3
- County
- — inherits STATE
- City
- — inherits STATE
ZIP-level market 32784
- Home prices YoY
- -8.5%
- Active inventory
- 223
- Price-to-rent
- 1.1×
Monthly cashflow live
- Estimated rent
- $1,232 medium interval (Pro) →
- Mortgage (P&I)
- −$89
- Tax from tax record
- −$35 /mo · $421/yr
- Insurance
- −$7
- HOA
- −$0
- Vacancy / Maint / Mgmt
- −$259
- Net cashflow
- $842
Break-even live
UW: 25.0% down · 7.5% · 30yr · 1.5% tax · 5.0% vac · 8.0% maint · 8.0% mgmt
Financing live
Cash to close
- Down payment
- $4,250
- Closing costs
- $510
- Reserves months
- —
- Total cash needed
- —
Loan-product check · same deal, 3 products live
Conventional
25% down · 7.5% · 30yr
- Down + closing
- —
- Monthly P&I
- —
- Monthly cashflow
- —
- DSCR
- —
- Eligible?
- —
Personal DTI + credit; lowest rate.
DSCR
20% down · 8.5% · 30yr
- Down + closing
- —
- Monthly P&I
- —
- Monthly cashflow
- —
- DSCR
- —
- Eligible?
- —
No personal income docs; deal must DSCR.
Hard money
10% down · 12.0% · 12mo
- Down + closing
- —
- Monthly P&I
- —
- Monthly cashflow
- —
- DSCR
- —
- Eligible?
- —
Short-term bridge; refi at stabilization.
Listing history 2 events
-
2026-05-08status Pending
-
2026-04-24$17,000 Active
ⓘ Source: listings_history table (triggers on properties + properties_extension) + one-shot
backfill from property_details.listing_events for pre-trigger history.
Tax reassessment forecast FL · Resets to sale price
- Current annual tax
- $421 · $35/mo
- Projected year-2 tax
- $421 · $35/mo
- Expected delta
- $0/yr ($0/mo · 0.0%)
ⓘ Screening estimate from a state-policy table — verify with the county assessor before closing.
Climate risk First Street
- Flood 1/10 Low FEMA zone X (unshaded) · 0% chance over 30 yrs
- Wildfire 4/10 Moderate
- Heat 8/10 Severe 7 d/yr ≥108°F today · 21 d/yr by 30 yrs out
- Wind 9/10 Extreme 99% chance of damaging wind over 30 yrs
- Air quality 3/10 Moderate 3 unhealthy d/yr today · 3 by 30 yrs out
Nearby sold comps map
Loading sold comps map…
Walkable amenities ~0.75 mi
Loading nearby amenities…
Taxation est. · year 1
- Rental income
- $14,787
- − Mortgage interest
- −$952
- − Property taxes
- −$421
- − Insurance
- −$85
- − Repairs & maintenance
- −$1,183
- − Management
- −$1,183
- − Depreciation
- −$495
- Taxable income
- $10,468
- Est. tax owed @ 24.0%
- −$2,512
- After-tax cash flow
- $7,594/yr
For passive investors: Depreciation is non-cash, so a rental often shows a tax loss while cash-flowing — sheltering income. Rental losses are passive: they offset passive income freely, and up to $25,000/yr can offset ordinary (W-2) income if you actively participate and your MAGI is under $100k (phasing out to $0 by $150k); unused losses carry forward. On sale, claimed depreciation is recaptured at up to 25%, and gains may owe capital-gains tax (a 1031 exchange can defer both). Figures are a year-1 estimate at your 24.0% rate — not tax advice; consult a CPA.
Schools (NCES district)
- District
- Marion
- NCES district ID
- 1201260
- Math proficiency
- 42% ▼ -7.00%
- Reading proficiency
- 43% ▼ -4.00%
- Median HH income
- $40,015
- Composite
- 35.61/100
- National rank
- #4890
- State rank
- #61 of 73 in FL
Livability — Umatilla
- Score
- 73/100
- State rank
- #300
- US rank
- #5132
Category grades
Schools grade is shown separately in the Schools card above.
Census & demographics
- Population (ZIP)
- 9,859
Population outlook (Marion County) Hauer SSP2
- Today (2025)
- 365,905 people
- By 2030
- 376,768 · +3.0%
- By 2040
- 396,555 · +8.4%
- By 2050
- 412,723 · +12.8%
- By 2075
- 446,090 · +21.9%
- By 2100
- 436,193 · +19.2%
Race, ethnicity, and origin ACS 2023
- Neighborhood character
- Predominantly White (84%)
- Race & ethnicity
- White 84% Hispanic / Latino 12% Two or more races 9% Black 2%
- Hispanic origin (detail)
- Mexican 10% Puerto Rican 1%
- Common ancestry
- Portuguese 2% Slovak 2% Lithuanian 2%
- Foreign-born
- 4% · Canada
- Languages at home
- 91% English-only · Spanish 8% German/W. Germanic 1%
Political lean MEDSL · Marion
- 2024 margin
- Solid R (+31.6) · D 33.8% · R 65.5%
- 2008→2024 swing
- -20.0pp toward R · 2008: -11.6pp · 2024: -31.6pp
- All cycles
- 2024: R+31.6 2020: R+25.9 2016: R+26.2 2012: R+16.2 2008: R+11.6
Not yet ingested
- Civics
- —
Market trends
- HPI YoY
- ▼ -32.66%
- Current HPI
- 352.4197
- Rent YoY
- —
- Metro
- —
- State GDP YoY
- ▲ 3.28%
- F500 in state
- 36
Industry mix (Fortune 500 HQ in FL)
| Industry | F500 HQs | Revenue |
|---|---|---|
| Industrial Technology | 2 | $29B |
|
||
| Insurance | 2 | $17B |
|
||
| Retail | 1 | $60B |
|
||
| Technology Distribution | 1 | $58B |
|
||
| Homebuilding | 1 | $35B |
|
||
| Technology Manufacturing | 1 | $35B |
|
||
Price history
2 events — show timeline
- 2026-05-08 Pending — Stellar MLS as Distributed by MLS Grid
- 2026-04-24 Listed $17,000 Stellar MLS as Distributed by MLS Grid
Property tax history
+4.2%/yrLatest (2025): $421 · +13.4% YoY. Source: county tax records.
Cash-flow waterfall
monthlySold comps — $/sqft
last 12 mo · ≤1 miLoading sold comps…