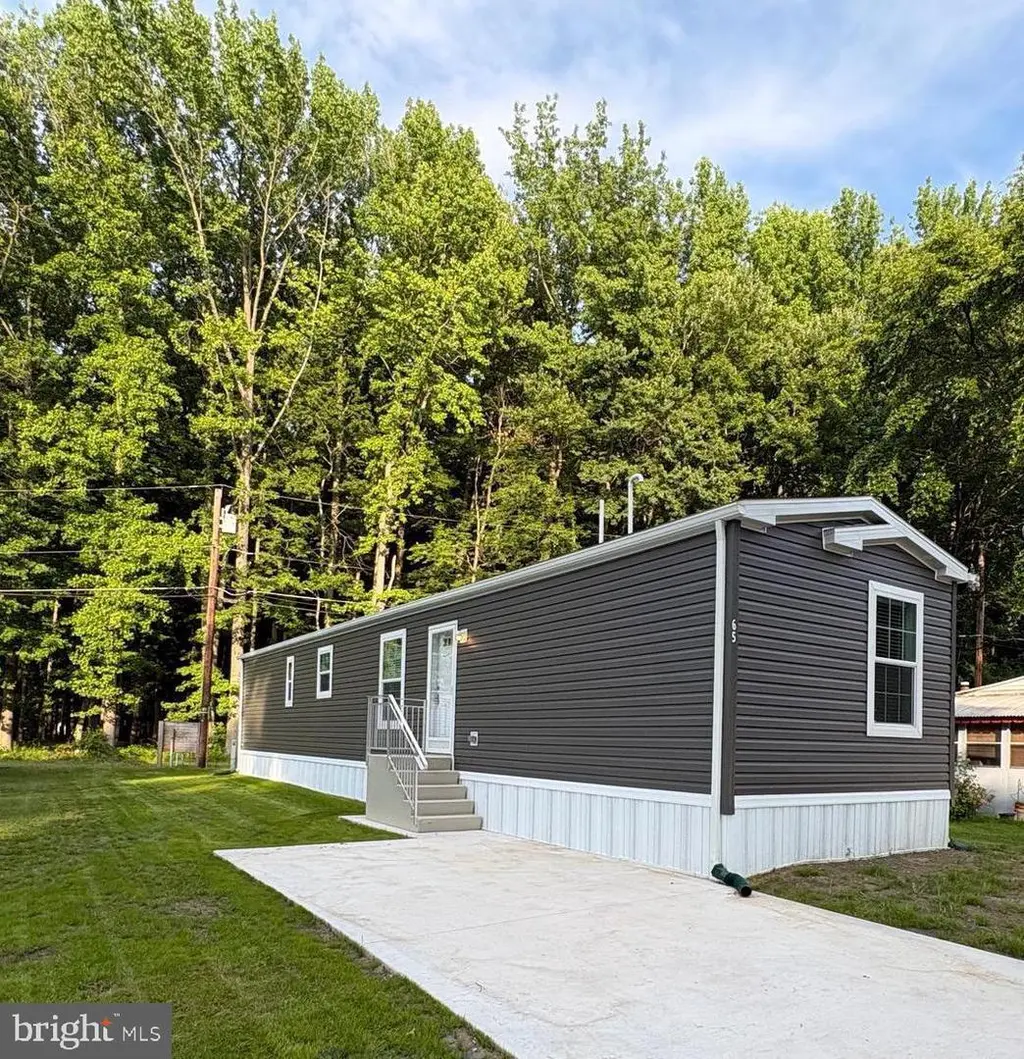
65 Forest Dr · Pennsville, NJ
Flood risk No data
- FEMA flood zone
- —
- Chance of flooding over 30 yrs
- —
- Est. flood insurance / yr
- —
Fire risk No data
- Est. fire insurance / yr
- —
Heat risk No data
- Hot days now (above threshold)
- —
- Hot days in 30 yrs
- —
Wind risk No data
- Chance of severe wind over 30 yrs
- —
Air-quality risk No data
- Unhealthy air days now
- —
- Unhealthy air days in 30 yrs
- —
Risk factors via First Street. Map © Google.
Why this score? — see what drove the C+ grade
The composite is a weighted blend of 9 inputs, each scored 0–100. Each bar is that input's sub-score; the figure is the points it added to the 100-point composite (weight × sub-score).
- Cash flow +27.3/30.0
- DSCR +9.5/10.0
- ARV discount +7.7/15.0
- 1% rule +7.4/10.0
- Livability +3.6/5.0
- Schools +2.6/10.0
- Rent growth +2.5/5.0
- Condition / age +2.5/5.0
- Appreciation +0.0/10.0
$134,400
🖨 Deal sheet 📄 Offer letter ✓ Due diligence
Listing remarks MLS
Lot 65 Forest Drive in 0ver 55+ community, enclosed porch, spacious family room addition, newer carport, concrete driveway. All double hung windows (approximately 10 years old), central air (3 years old), oil h/a heat. Current Lot rent is $379/month.
Key facts
- Plenty of storage
- Open-concept kitchen
- Built-in shelving
Tags
Property features AI
Finance
- Financial info: Annual ground rent (income/expense item)
- HOA & community: Senior community with 55+ age requirement
Exterior
- Parking: Concrete driveway; Driveway parking with space for 1 vehicle; Total of 1 garage/parking space
- Utilities: Public water; Public sewer; Circuit breaker electric; Municipal trash service
- Home design: Manufactured single-wide home; Estimated year built; Pitched shingle roof; Above-grade living space
- Construction: Vinyl siding; Construction completed; Made by Redman; Dimensions approximately 14 ft by 60 ft
- Exterior features: Street lights; Level lot; Ground rent exists (paid annually)
Interior
- Kitchen: Built-in range; Built-in microwave; Dishwasher; Refrigerator
- Bedrooms: 2 bedrooms on the main level
- Flooring: Laminate plank flooring
- Bathrooms: 2 full bathrooms (both on the main level)
- Heating & cooling: Forced air heating; Natural gas heating fuel; Electric hot water
- Interior features: Eat-in kitchen; Storm door(s)
- Laundry & utility: Main-floor laundry
Neighborhood map
What this means for you Summary
Snapshot
- This is a 2-bed/2.0-bath single-family listed at $134k.
Deal economics
- At list price, monthly cash flow is $389 ($5k/yr) — positive.
- The deal already cash-flows at list — no discount required.
- Meets the 1% rule at list price ($2k rent vs $134k).
- Cap rate 9.8% vs local median 3.6% in Pennsville — top-decile yield for the area; either an underpriced asset or a hidden risk that comps aren't pricing in. Stress-test before assuming the spread holds.
Location & tenants
- Location reads 72/100 on livability (#225 in NJ) — a middle-class / working-renter tenant base. Strengths: housing A+, health & safety A+, cost of living A-; Watch: amenities F, commute F.
- Pennsville Public School District (suburban): math 12% / reading 45% proficiency, ranked #356 of 472 in NJ (top 75%) — low school quality limits family demand, transient renter base, plan for 1-2y turnover.
- Zoned schools: Pennsville Memorial High School (math 17% / reading 42%, grade F, #290 of 399 statewide, top 74%, 462 students, 29% FRL) — zoned schools at 29% FRL track the district average.
- Market conditions: 84 active listings in the ZIP; 95 units permitted in Salem County in 2024 (0 in 5+ unit buildings).
Forward outlook
- Local home prices are declining (-3.0%/yr); year-one equity from $929 of loan paydown is wiped out by about $4k of value loss. Plan a longer hold.
- Salem County population projected at -23% by 2050 — secular population decline; favor cash flow + early exit over multi-decade hold.
- At projected returns (-3.0% appreciation + 3.0% rent growth), your $38k cash investment doubles in ~10 years — after that, you're playing with house money.
Negotiation context
- Only 6 days on market — expect competitive offers; lowballing is unlikely to land.
- 2 sale attempts since 14y ago with the ask held roughly flat each time — persistent listings suggest the price (not the market) is what's stuck; bring a comps-based counter.
- Current owner paid $20k; list at $134k implies a 572% gain — meaningful room to come down on a strong offer.
Questions for the listing agent
- Is there a deadline driving the sale (1031 exchange, divorce, estate, relocation)? That informs how much negotiation room exists.
- What's the average days-on-market for RENTAL listings here right now (not sales)? A rising rental-DOM trend means longer vacancies and softer asking-rent achievability than the comps imply.
- What's the recent tenant-quality profile in this submarket — average credit score on applications, eviction rate, late-payment / NSF rate, and stable-employment percentage? A property-management company in the area should have these aggregated.
- How much new for-sale + rental construction is in the pipeline within 1–3 miles? Heavy new supply typically softens prices + rents 12–24 months out; constrained supply supports both.
Investment metrics
- 1% rule
- 1.24% ✓
- Cap rate
- 9.77%
- Cash-on-cash
- 12.40%
- DSCR
- 1.55
- GRM
- 6.7
CMA / ARV
- ARV (on-the-fly)
- $135,000
- Comps found
- 12
Show comp detail 12 sales within ~0.75 mi
| Address | Dist | Beds/Ba | Sqft | Sold | Price | $/sf | Match |
|---|---|---|---|---|---|---|---|
| 86 Mobile Dr | 0.05mi | 2/2.0 | 900 (0%) | 15mo | $135,000 | $150 | 85 |
| 50 Pennington Dr | 0.27mi | 2/2.0 | 900 (0%) | 11mo | $135,500 | $151 | 78 |
| 59 Forest Dr | 0.21mi | 2/2.0 | 800 (-11%) | 0mo | $105,000 | $131 | 72 |
| 239 Pin Oak | 0.22mi | 2/1.0 | 800 (-11%) | 1mo | $45,000 | $56 | 66 |
| 45 Pennington Dr | 0.20mi | 2/2.0 | 1,000 (+11%) | 10mo | $146,500 | $147 | 64 |
| 1 Victory Ave #55 | 0.38mi | 2/1.0 | 960 (+7%) | 7mo | $45,600 | $48 | 61 |
| 11 Leap Ct | 0.27mi | 3/1.5 (+1) | 1,008 (+12%) | 0mo | $245,000 | $243 | 60 |
| 226 Pin Oak Dr | 0.19mi | 2/1.0 | 800 (-11%) | 11mo | $49,000 | $61 | 59 |
| 4 Dunlap Ave | 0.42mi | 3/2.0 (+1) | 952 (+6%) | 8mo | $215,509 | $226 | 59 |
| 35 Pennington Dr | 0.30mi | 2/2.0 | 800 (-11%) | 19mo | $120,000 | $150 | 52 |
| 12 Dennis Dr | 0.29mi | 2/1.0 | 800 (-11%) | 20mo | $85,000 | $106 | 47 |
| 280 N Broadway | 0.68mi | 2/1.0 | 833 (-7%) | 14mo | $209,000 | $251 | 40 |
Match score weights: distance 35% · size 25% · config 20% · recency 20%. Top-matched comps best support the ARV.
Projected returns pro-forma
-3.0% appreciation · 3.0% rent growth · sell at horizon
- IRR
- 2.1%
- Equity multiple
- 1.08×
- Total profit
- $3,023
- Equity at exit
- $20,039
- IRR
- 11.7%
- Equity multiple
- 1.92×
- Total profit
- $34,637
- Equity at exit
- $11,620
Cash invested: $37,632 (down + closing). Projections, not guarantees.
Landlord ↔ Tenant lean methodology
- Overall (STATE)
- 21 Tenant-Leaning
- State New Jersey
- 21 Tenant-Leaning · D+6
- County
- — inherits STATE
- City
- — inherits STATE
ZIP-level market 08070
- Home prices YoY
- -23.7%
- Active inventory
- 84
- Price-to-rent
- 6.7×
Monthly cashflow live
- Estimated rent
- $1,668 medium interval (Pro) →
- Mortgage (P&I)
- −$705
- Tax est. 1.5%
- −$168 /mo · $2,016/yr
- Insurance
- −$56
- HOA
- −$0
- Vacancy / Maint / Mgmt
- −$350
- Net cashflow
- $389
Break-even live
UW: 25.0% down · 7.5% · 30yr · 1.5% tax · 5.0% vac · 8.0% maint · 8.0% mgmt
Financing live
Cash to close
- Down payment
- $33,600
- Closing costs
- $4,032
- Reserves months
- —
- Total cash needed
- —
Loan-product check · same deal, 3 products live
Conventional
25% down · 7.5% · 30yr
- Down + closing
- —
- Monthly P&I
- —
- Monthly cashflow
- —
- DSCR
- —
- Eligible?
- —
Personal DTI + credit; lowest rate.
DSCR
20% down · 8.5% · 30yr
- Down + closing
- —
- Monthly P&I
- —
- Monthly cashflow
- —
- DSCR
- —
- Eligible?
- —
No personal income docs; deal must DSCR.
Hard money
10% down · 12.0% · 12mo
- Down + closing
- —
- Monthly P&I
- —
- Monthly cashflow
- —
- DSCR
- —
- Eligible?
- —
Short-term bridge; refi at stabilization.
Listing history 6 events
-
2026-06-18days on market $134,400 Active 6 DOM
-
2026-06-17days on market $134,400 Active 5 DOM
-
2026-06-16days on market $134,400 Active 4 DOM
-
2026-06-15days on market $134,400 Active 3 DOM
-
2026-06-13remarks 693-char remark
-
2026-06-13$134,400 Active 1 DOM
ⓘ Source: listings_history table (triggers on properties + properties_extension) + one-shot
backfill from property_details.listing_events for pre-trigger history.
Nearby sold comps map
Loading sold comps map…
Walkable amenities ~0.75 mi
Loading nearby amenities…
Taxation est. · year 1
- Rental income
- $20,017
- − Mortgage interest
- −$7,528
- − Property taxes
- −$2,016
- − Insurance
- −$672
- − Repairs & maintenance
- −$1,601
- − Management
- −$1,601
- − Depreciation
- −$3,910
- Taxable income
- $2,688
- Est. tax owed @ 24.0%
- −$645
- After-tax cash flow
- $4,023/yr
For passive investors: Depreciation is non-cash, so a rental often shows a tax loss while cash-flowing — sheltering income. Rental losses are passive: they offset passive income freely, and up to $25,000/yr can offset ordinary (W-2) income if you actively participate and your MAGI is under $100k (phasing out to $0 by $150k); unused losses carry forward. On sale, claimed depreciation is recaptured at up to 25%, and gains may owe capital-gains tax (a 1031 exchange can defer both). Figures are a year-1 estimate at your 24.0% rate — not tax advice; consult a CPA.
Schools (NCES district)
- District
- Pennsville Public School District
- NCES district ID
- 3409120
- Math proficiency
- 12% ▼ -26.00%
- Reading proficiency
- 45% ▬ 0.00%
- Median HH income
- $58,237
- Composite
- 25.61/100
- National rank
- #7411
- State rank
- #356 of 472 in NJ
Livability — Pennsville
- Score
- 72/100
- State rank
- #225
- US rank
- #6134
Category grades
Schools grade is shown separately in the Schools card above.
Census & demographics
- Census place
- Pennsville, NJ
- City population
- 12,766
- Population (ZIP)
- 12,477
Population outlook (Salem County) Hauer SSP2
- Today (2025)
- 59,905 people
- By 2030
- 57,351 · -4.3%
- By 2040
- 51,837 · -13.5%
- By 2050
- 46,356 · -22.6%
- By 2075
- 36,452 · -39.2%
- By 2100
- 28,907 · -51.7%
Race, ethnicity, and origin ACS 2023
- Neighborhood character
- Predominantly White (84%)
- Race & ethnicity
- White 84% Hispanic / Latino 7% Two or more races 5% Black 4%
- Hispanic origin (detail)
- Mexican 1% Puerto Rican 4%
- Common ancestry
- Romanian 6% Slovak 2% Lithuanian 1%
- Foreign-born
- 3% · Canada
- Languages at home
- 93% English-only · Other Indo-European 4% Spanish 2%
Political lean MEDSL · Salem
- 2024 margin
- R (+19.2) · D 39.6% · R 58.8% · Other 1.6%
- 2008→2024 swing
- -23.1pp toward R · 2008: 3.9pp · 2024: -19.2pp
- All cycles
- 2024: R+19.2 2020: R+12.8 2016: R+15.4 2012: D+0.8 2008: D+3.9
Not yet ingested
- Civics
- —
Market trends
- HPI YoY
- ▼ -85.34%
- Current HPI
- 275.2185
- Rent YoY
- —
- Metro
- —
- State GDP YoY
- ▲ 2.05%
- F500 in state
- 34
Industry mix (Fortune 500 HQ in NJ)
| Industry | F500 HQs | Revenue |
|---|---|---|
| Consumer Goods | 3 | $31B |
|
||
| Pharmaceuticals | 2 | $153B |
|
||
| Technology | 2 | $21B |
|
||
| Insurance | 2 | $20B |
|
||
| Healthcare | 2 | $19B |
|
||
| Financial Services | 1 | $70B |
|
||
Price history
+510.9% since first listed4 events — show timeline
- 2026-06-13 Listed $134,400 BRIGHT MLS
- 2013-10-31 Sold (MLS) $20,000 BRIGHT MLS
- 2013-10-01 Listing Removed — BRIGHT MLS
- 2012-12-22 Listed $22,000 BRIGHT MLS
Cash-flow waterfall
monthlySold comps — $/sqft
last 12 mo · ≤1 miLoading sold comps…