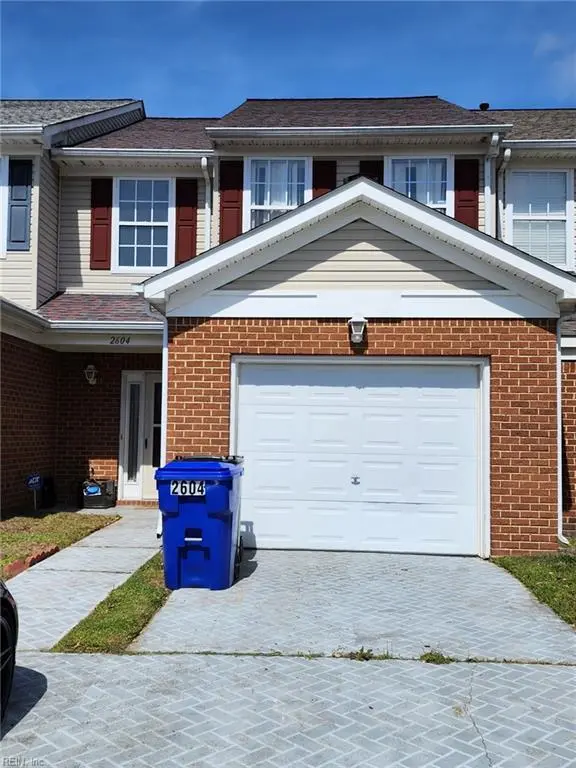
2604 Bracston Rd · Virginia Beach, VA
Flood risk 1/10 · Minimal
- FEMA flood zone
- X (unshaded)
- Chance of flooding over 30 yrs
- 0.0%
- Est. flood insurance / yr
- $507 – $1,088
Fire risk 4/10 · Minor
- Est. fire insurance / yr
- $666 – $1,236
Heat risk 9/10 · Severe
- Hot days now (above 105°F)
- 7 days/yr
- Hot days in 30 yrs
- 17 days/yr
Wind risk 8/10 · Major
- Chance of severe wind over 30 yrs
- 99.0%
Air-quality risk 2/10 · Minimal
- Unhealthy air days now
- 0 days/yr
- Unhealthy air days in 30 yrs
- 2 days/yr
Risk factors via First Street. Map © Google.
Why this score? — see what drove the D grade
The composite is a weighted blend of 9 inputs, each scored 0–100. Each bar is that input's sub-score; the figure is the points it added to the 100-point composite (weight × sub-score).
- Cash flow +12.0/30.0
- ARV discount +9.9/15.0
- Schools +6.4/10.0
- Livability +4.2/5.0
- DSCR +3.6/10.0
- Rent growth +3.4/5.0
- 1% rule +2.8/10.0
- Condition / age +2.5/5.0
- Appreciation +0.0/10.0
$379,000
🖨 Deal sheet (PDF) 📄 Offer letter ✓ Due diligence
Listing remarks
“HOMEBUYERS INSPECTION” - NO FEE PROPERTY - CONVENIENTLY LOCATED TO MILITARY BASES - SHOPPING - DINING - BEACHES! SPACIOUS THREE (3) BEDROOMS WITH 1ST FLOOR PRIMARY BEDROOM - WALK-IN CLOSETS - OPEN RELAXING FLOOR PLAN - PATIO/FENCED BACKYARD AND ATTACHED GARAGE - PROPERTY NEED (TLC) - CONVEYS "AS IS" - NO REPAIRS BY SELLER-
Key facts
- beaches
- Walk-in closets
- Patio
Tags
Neighborhood map
What this means for you Summary
Snapshot
- This is a 3-bed/2.5-bath townhouse listed at $379k.
Deal economics
- At list price, monthly cash flow is $-89 ($-1k/yr) — negative.
- To cash-flow at today's rent, offer at most $363k (4.2% below list).
- To meet the 1% rule (rent ≥ 1% of price), the offer needs to be $294k (22.4% below list).
- Recommended offer: $294k (22.4% below list) — sets the bar for 1% rule.
- Cap rate 6.0% vs local median 3.5% in Virginia Beach — top-decile yield for the area; either an underpriced asset or a hidden risk that comps aren't pricing in. Stress-test before assuming the spread holds.
Location & tenants
- Location reads 83/100 on livability (#38 in VA, #880 nationally) — a professional / high-income tenant draw. Strengths: amenities A+, employment A+, housing A+; Watch: cost of living C-, commute F.
- Va Beach City Public School District (urban): math 69% / reading 78% proficiency, ranked #10 of 131 in VA (top 8%) — strong family-tenant draw, lease renewals of 3-5y typical.
- Zoned schools: Princess Anne Elementary (math 85% / reading 86%, grade A+, #61 of 1,108 statewide, top 6%, 682 students, 13% FRL); Princess Anne Middle (math 79% / reading 85%, grade A+, #20 of 342 statewide, top 6%, 1,400 students, 14% FRL); Floyd Kellam High (math 83% / reading 93%, grade A, #13 of 319 statewide, top 4%, 1,882 students, 14% FRL).
- Market conditions: Rents rising (+3.8%/yr); 367 active listings in the ZIP; 5 comparable units currently listed for rent nearby; rentals at typical pace (median 26d on market — plan ~3-4 weeks tenant-placement turnaround); high-income renter base; 666 units permitted in Virginia Beach city in 2024 (347 in 5+ unit buildings).
Forward outlook
- Local home prices are declining (-3.0%/yr); year-one equity from $3k of loan paydown is wiped out by about $11k of value loss. Plan a longer hold.
- Virginia Beach County population projected at +6% by 2050 — modest demand growth; plan on rents tracking national, not racing it.
Negotiation context
- Only 10 days on market — expect competitive offers; lowballing is unlikely to land.
- Current owner paid $108k; list at $379k implies a 251% gain — meaningful room to come down on a strong offer.
Risks & watch-outs
- Climate carrying-cost: severe wind risk, 99% chance of damaging wind over 30y; extreme-heat days projected 7→17/yr by 2055 (HVAC capex compounding) — expect insurance premiums to compound above CPI over the hold.
Questions for the listing agent
- What do current leases actually rent for vs. the listed asking? Can we see a recent rent roll and the last 12 months of T-12 income?
- Is there a deadline driving the sale (1031 exchange, divorce, estate, relocation)? That informs how much negotiation room exists.
- Schools are A-rated — typically a magnet for longer-tenancy family renters. What's the average tenant stay here, and is there a school-zone premium baked into asking?
- The area grade is low — what's the realistic commute time and amenity access for the typical tenant pool here? Any planned neighborhood developments (good or bad) we should know about?
- What's the average days-on-market for RENTAL listings here right now (not sales)? A rising rental-DOM trend means longer vacancies and softer asking-rent achievability than the comps imply.
- What's the recent tenant-quality profile in this submarket — average credit score on applications, eviction rate, late-payment / NSF rate, and stable-employment percentage? A property-management company in the area should have these aggregated.
- How much new for-sale + rental construction is in the pipeline within 1–3 miles? Heavy new supply typically softens prices + rents 12–24 months out; constrained supply supports both.
Investment metrics
- 1% rule
- 0.78% ✗
- Cap rate
- 6.01%
- Cash-on-cash
- -1.01%
- DSCR
- 0.96
- GRM
- 10.7
CMA / ARV
- ARV (on-the-fly)
- $399,968
- Comps found
- 12
Show comp detail 12 sales within ~0.75 mi
| Address | Dist | Beds/Ba | Sqft | Sold | Price | $/sf | Match |
|---|---|---|---|---|---|---|---|
| 2604 Bracston Rd | 0.00mi | 3/2.5 | 1,724 (0%) | 1mo | $379,000 | $220 | 99 |
| 2350 Charing Cross Rd | 0.13mi | 3/2.5 | 1,727 (+0%) | 0mo | $410,000 | $237 | 93 |
| 2578 Hartley St | 0.16mi | 3/2.5 | 1,727 (+0%) | 1mo | $399,900 | $232 | 91 |
| 2449 Dillingham Rd | 0.09mi | 3/2.5 | 1,849 (+7%) | 6mo | $419,900 | $227 | 78 |
| 2697 Bracston Rd | 0.12mi | 3/2.5 | 1,586 (-8%) | 5mo | $415,500 | $262 | 77 |
| 2510 Hartley St | 0.06mi | 3/2.5 | 1,889 (+10%) | 6mo | $370,000 | $196 | 77 |
| 2589 Hartley St | 0.13mi | 3/2.5 | 1,889 (+10%) | 2mo | $432,000 | $229 | 76 |
| 2623 Bracston Rd | 0.06mi | 3/2.5 | 1,889 (+10%) | 7mo | $409,000 | $217 | 76 |
| 2400 Dillingham Rd | 0.09mi | 3/2.5 | 1,889 (+10%) | 6mo | $430,000 | $228 | 75 |
| 2343 Nottoway Ln | 0.58mi | 3/2.5 | 1,884 (+9%) | 1mo | $520,000 | $276 | 57 |
| 2115 Martlet Ln | 0.63mi | 3/2.5 | 1,884 (+9%) | 1mo | $525,000 | $279 | 55 |
| 2344 Nottoway Ln | 0.59mi | 3/2.5 | 1,536 (-11%) | 6mo | $495,000 | $322 | 49 |
Match score weights: distance 35% · size 25% · config 20% · recency 20%. Top-matched comps best support the ARV.
Projected returns pro-forma
-3.0% appreciation · 3.78% rent growth · sell at horizon
- IRR
- -17.2%
- Equity multiple
- 0.39×
- Total profit
- $-64,849
- Equity at exit
- $56,510
- IRR
- -7.9%
- Equity multiple
- 0.49×
- Total profit
- $-54,418
- Equity at exit
- $32,769
Cash invested: $106,120 (down + closing). Projections, not guarantees.
Landlord ↔ Tenant lean methodology
- Overall (STATE)
- 55 Moderately Landlord-Leaning
- State Virginia
- 55 Moderately Landlord-Leaning · D+2
- County
- — inherits STATE
- City
- — inherits STATE
ZIP-level market 23456
- Rents YoY
- 3.8%
- Active inventory
- 367
- Price-to-rent
- 10.7×
Monthly cashflow live
- Estimated rent
- $2,941 high interval (Pro) →
- Mortgage (P&I)
- −$1,988
- Tax from tax record
- −$267 /mo · $3,210/yr
- Insurance
- −$158
- HOA
- −$0
- Vacancy / Maint / Mgmt
- −$618
- Net cashflow
- $-89
Break-even live
Sensitivity live
| Price | -10% $125 | -5% $18 | +0% $-89 | +5% $-196 | +10% $-304 |
|---|---|---|---|---|---|
| Rent | -10% $-322 | -5% $-205 | +0% $-89 | +5% $27 | +10% $143 |
| Rate | -1.0pp $102 | -0.5pp $7 | base $-89 | +0.5pp $-187 | +1.0pp $-287 |
UW: 25.0% down · 7.5% · 30yr · 1.5% tax · 5.0% vac · 8.0% maint · 8.0% mgmt
Financing live
Cash to close
- Down payment
- $94,750
- Closing costs
- $11,370
- Reserves months
- —
- Total cash needed
- —
Loan-product check · same deal, 3 products live
Conventional
25% down · 7.5% · 30yr
- Down + closing
- —
- Monthly P&I
- —
- Monthly cashflow
- —
- DSCR
- —
- Eligible?
- —
Personal DTI + credit; lowest rate.
DSCR
20% down · 8.5% · 30yr
- Down + closing
- —
- Monthly P&I
- —
- Monthly cashflow
- —
- DSCR
- —
- Eligible?
- —
No personal income docs; deal must DSCR.
Hard money
10% down · 12.0% · 12mo
- Down + closing
- —
- Monthly P&I
- —
- Monthly cashflow
- —
- DSCR
- —
- Eligible?
- —
Short-term bridge; refi at stabilization.
Rent comps 5 comps
| Address | Beds | Baths | Sqft | Rent | $/sqft | DOM | Units | Dist |
|---|---|---|---|---|---|---|---|---|
| 2409 Dillingham Rd Virginia Beach, VA | 3.0 | 2.5 | 1751 | $3,000 | $1.71 | 25d | 1 | 0.08mi |
| 2591 Hartley St Virginia Beach, VA | 3.0 | 2.5 | 1589 | $2,250 | $1.42 | 9d | 1 | 0.12mi |
| 2228 Martlet Ln Virginia Beach, VA | 3.0 | 3.0 | 2185 | $3,400 | $1.56 | 25d | 1 | 0.53mi |
| 2361 Nottoway Ln Virginia Beach, VA | 3.0 | 2.5 | 2008 | $3,200 | $1.59 | 25d | 1 | 0.64mi |
| 2250 Princess Anne Rd Virginia Beach, VA | 3.0 | 1.5 | 1680 | $2,300 | $1.37 | 25d | 1 | 1.07mi |
Listing history 5 events
-
2026-04-24status Under Contract
-
2026-04-23price $379,000
-
2026-04-19historical Active Under Contract
-
2026-04-13$375,000 Active
-
1997-03-25soldstatus $108,065
ⓘ Source: listings_history table (triggers on properties + properties_extension) + one-shot
backfill from property_details.listing_events for pre-trigger history.
Tax reassessment forecast VA · Resets to sale price
- Current annual tax
- $3,210 · $267/mo
- Projected year-2 tax
- $3,210 · $267/mo
- Expected delta
- $0/yr ($0/mo · 0.0%)
ⓘ Screening estimate from a state-policy table — verify with the county assessor before closing.
Climate risk First Street
- Flood 1/10 Low FEMA zone X (unshaded) · 0% chance over 30 yrs
- Wildfire 4/10 Moderate
- Heat 9/10 Extreme 7 d/yr ≥105°F today · 17 d/yr by 30 yrs out
- Wind 8/10 Severe 99% chance of damaging wind over 30 yrs
- Air quality 2/10 Low 0 unhealthy d/yr today · 2 by 30 yrs out
Nearby sold comps map
Loading sold comps map…
Walkable amenities ~0.75 mi
Loading nearby amenities…
Taxation est. · year 1
- Rental income
- $35,297
- − Mortgage interest
- −$21,230
- − Property taxes
- −$3,210
- − Insurance
- −$1,895
- − Repairs & maintenance
- −$2,824
- − Management
- −$2,824
- − Depreciation
- −$11,025
- Taxable loss
- −$7,710
- Est. tax savings @ 24.0%
- +$1,850
- After-tax cash flow
- $780/yr
For passive investors: Depreciation is non-cash, so a rental often shows a tax loss while cash-flowing — sheltering income. Rental losses are passive: they offset passive income freely, and up to $25,000/yr can offset ordinary (W-2) income if you actively participate and your MAGI is under $100k (phasing out to $0 by $150k); unused losses carry forward. On sale, claimed depreciation is recaptured at up to 25%, and gains may owe capital-gains tax (a 1031 exchange can defer both). Figures are a year-1 estimate at your 24.0% rate — not tax advice; consult a CPA.
Schools (NCES district)
- District
- Va Beach City Public School District
- NCES district ID
- 5103840
- Math proficiency
- 69% ▼ -19.00%
- Reading proficiency
- 78% ▼ -7.00%
- Median HH income
- $66,452
- Composite
- 63.81/100
- National rank
- #594
- State rank
- #10 of 131 in VA
Livability — Virginia Beach
- Score
- 83/100
- State rank
- #38
- US rank
- #880
Category grades
Schools grade is shown separately in the Schools card above.
Census & demographics
- Census place
- Virginia Beach, VA
- County
- Virginia Beach City · 448,227 people
- City population
- 448,227
- Metro
- Virginia Beach-Norfolk-Newport News, VA-NC
- Population (ZIP)
- 61,911
- Household income
- $130,533
- Rent vs Own
- Severe rent burden
- 390.0
Population outlook (Virginia Beach County) Hauer SSP2
- Today (2025)
- 480,401 people
- By 2030
- 491,221 · +2.3%
- By 2040
- 504,882 · +5.1%
- By 2050
- 508,847 · +5.9%
- By 2075
- 504,831 · +5.1%
- By 2100
- 465,867 · -3.0%
Race, ethnicity, and origin ACS 2023
- Neighborhood character
- Diverse neighborhood (Simpson 0.60)
- Race & ethnicity
- White 60% Black 13% Asian 12% Two or more races 10% Hispanic / Latino 9%
- Hispanic origin (detail)
- Mexican 3% Puerto Rican 2%
- Common ancestry
- Romanian 2% Slovak 2% Lithuanian 2%
- Foreign-born
- 12% · Canada, China, Vietnam
- Languages at home
- 85% English-only · Tagalog/Filipino 4% Spanish 4% Other Indo-European 2%
Political lean MEDSL · Virginia Beach
- 2024 margin
- Toss-up / Even · D 50.7% · R 48.0% · Other 1.3%
- 2008→2024 swing
- +3.4pp toward D · 2008: -0.7pp · 2024: 2.6pp
- All cycles
- 2024: D+2.6 2020: D+5.4 2016: R+4.5 2012: R+2.5 2008: R+0.7
Not yet ingested
- Civics
- —
Market trends
- HPI YoY
- ▼ -328.17%
- Current HPI
- 318.3094
- Rent YoY
- ▲ 3.78%
- Metro
- Virginia Beach-Norfolk-Newport News, VA-NC
- State GDP YoY
- ▲ 2.40%
- F500 in state
- 50
Industry mix (Fortune 500 HQ in VA)
| Industry | F500 HQs | Revenue |
|---|---|---|
| Aerospace / Defense | 4 | $236B |
|
||
| Technology / Defense | 3 | $32B |
|
||
| Financial Services | 2 | $176B |
|
||
| Utilities | 2 | $27B |
|
||
| Insurance | 2 | $25B |
|
||
| Technology | 2 | $15B |
|
||
Price history
+250.7% since first listed5 events — show timeline
- 2026-04-24 Pending — REINMLS
- 2026-04-23 Price Changed $379,000 REINMLS
- 2026-04-19 Contingent — REINMLS
- 2026-04-13 Listed $375,000 REINMLS
- 1997-03-25 Sold (Public Records) $108,065 Public Records
Property tax history
+22.7%/yrLatest (2025): $3,210 · +4.4% YoY. Source: county tax records.
Cash-flow waterfall
monthlySold comps — $/sqft
last 12 mo · ≤1 miLoading sold comps…