 Multi-family
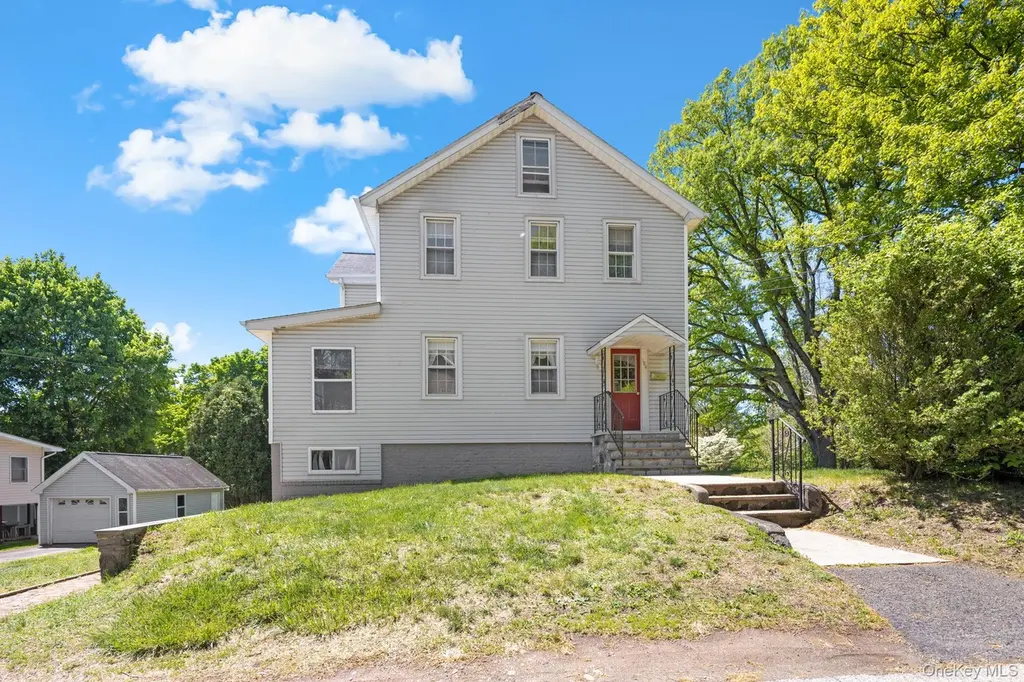
184 3rd St · Buchanan, NY
Flood risk 1/10 · Minimal
- FEMA flood zone
- X (unshaded)
- Chance of flooding over 30 yrs
- 0.0%
- Est. flood insurance / yr
- $507 – $1,088
Fire risk 1/10 · Minimal
- Est. fire insurance / yr
- $691 – $1,283
Heat risk 6/10 · Moderate
- Hot days now (above 101°F)
- 7 days/yr
- Hot days in 30 yrs
- 15 days/yr
Wind risk 4/10 · Minor
- Chance of severe wind over 30 yrs
- 21.0%
Air-quality risk 3/10 · Minor
- Unhealthy air days now
- 2 days/yr
- Unhealthy air days in 30 yrs
- 4 days/yr
Risk factors via First Street. Map © Google.
Why this score? — see what drove the F grade
The composite is a weighted blend of 9 inputs, each scored 0–100. Each bar is that input's sub-score; the figure is the points it added to the 100-point composite (weight × sub-score).
- ARV discount +15.0/15.0
- Schools +6.0/10.0
- Livability +4.0/5.0
- Rent growth +2.5/5.0
- Condition / age +2.5/5.0
- Cash flow +2.3/30.0
- 1% rule +0.0/10.0
- DSCR +0.0/10.0
- Appreciation +0.0/10.0
$709,000
🖨 Deal sheet (PDF) 📄 Offer letter ✓ Due diligence
Multi-family units
County records classify this as Multi-Family (2-4 Unit). Listing-text estimate: 1 unit. estimate disagrees with records
Listing remarks
Welcome to 184 3 St. Buchanan NY , This is a remarkable opportunity to acquire a well maintained 2 Family that lives like a Single Family with an accessory apartment. The main portion of the home is (1900 Sq ft ) 2 levels - 3 Bedrooms - 2 Full baths with a bonus room off the Kitchen . The apartment has a separate entrance and is 1 Bedroom, I Full bath 400 Sq Ft with a sun-room. The house is on a extra large partially fenced in lot with plenty of room for entertaining, the driveway Leads to a one car garage and can accommodate 4-5 cars.
Key facts
- Separate entrance
- Partially fenced lot
- Sun-room
Tags
Property features AI
Exterior
- Parking: Detached garage; Driveway parking; Garage plus total of 5 parking spaces; One garage space
- Utilities: Central Hudson electric service; Natural gas connected; Public water connected; Public sewer; Cable connected; Trash collection (public)
- Home design: Duplex; Measured building area (approx. 2300 total); Actual property condition
- Construction: Block and frame construction
- Exterior features: Partial perimeter fencing; Not waterfront
Interior
- Kitchen: Kitchen island; Breakfast bar; Eat-in kitchen; Open kitchen; Formal dining area
- Bedrooms: One 1-bedroom unit; One 3-bedroom unit
- Bathrooms: Three full bathrooms
- Heating & cooling: Baseboard heating; Natural gas heating; No central cooling
- Interior features: First-floor bedroom; First-floor full bathroom; Breakfast bar; Eat-in kitchen; Formal dining room; Kitchen island; Open kitchen
- Laundry & utility: Basement (partial, unfinished)
Neighborhood map
What this means for you Summary
Snapshot
- This is a 4-bed/3.0-bath multifamily listed at $709k.
Deal economics
- At list price, monthly cash flow is $-3k ($-30k/yr) — negative.
- To cash-flow at today's rent, offer at most $266k (62.4% below list).
- To meet the 1% rule (rent ≥ 1% of price), the offer needs to be $260k (63.4% below list).
- Recommended offer: $260k (63.4% below list) — sets the bar for 1% rule.
Location & tenants
- Location reads 79/100 on livability (#139 in NY, #2,170 nationally) — a middle-class / working-renter tenant base. Strengths: crime A+, commute A+, employment A+; Watch: amenities F, cost of living F.
- Hendrick Hudson Central School District (suburban): math 62% / reading 72% proficiency, ranked #143 of 590 in NY (top 24%) — acceptable for families but not a draw, mixed tenant base, ~2y average lease; only 16% free/reduced lunch — higher-income household profile.
- Zoned schools: Buchanan-Verplanck Elementary School (math 42% / reading 57%, grade D, #1,085 of 2,108 statewide, top 56%, 291 students, 30% FRL); Blue Mountain Middle School (math 47% / reading 70%, grade B, #178 of 729 statewide, top 25%, 489 students, 31% FRL); Hendrick Hudson High School (math 87% / reading 84%, grade A, #358 of 1,100 statewide, top 33%, 727 students, 31% FRL).
- Market conditions: 20 active listings in the ZIP; 954 units permitted in Westchester County in 2024 (649 in 5+ unit buildings).
Forward outlook
- Local home prices are declining (-3.0%/yr); year-one equity from $5k of loan paydown is wiped out by about $21k of value loss. Plan a longer hold.
- Westchester County population projected at +10% by 2050 — modest demand growth; plan on rents tracking national, not racing it.
Negotiation context
- It's been on market 37 days — a 3% lower offer ($688k) is reasonable based on typical stale-listing flexibility.
- Current owner paid $101k; list at $709k implies a 602% gain — meaningful room to come down on a strong offer.
Risks & watch-outs
- Watch-outs: built in 1951 — expect roof / HVAC / electrical / plumbing capex.
- Climate carrying-cost: extreme-heat days projected 7→15/yr by 2055 (HVAC capex compounding) — expect insurance premiums to compound above CPI over the hold.
Questions for the listing agent
- What do current leases actually rent for vs. the listed asking? Can we see a recent rent roll and the last 12 months of T-12 income?
- It's been on market 37 days. Have you received any prior offers? Is the seller open to a 63% concession, seller financing, or rate buy-down credit?
- Built in 1951 — when were the roof, HVAC, electrical panel, plumbing, and water heater last replaced?
- Is there a deadline driving the sale (1031 exchange, divorce, estate, relocation)? That informs how much negotiation room exists.
- The area grade is low — what's the realistic commute time and amenity access for the typical tenant pool here? Any planned neighborhood developments (good or bad) we should know about?
- What's the average days-on-market for RENTAL listings here right now (not sales)? A rising rental-DOM trend means longer vacancies and softer asking-rent achievability than the comps imply.
- What's the recent tenant-quality profile in this submarket — average credit score on applications, eviction rate, late-payment / NSF rate, and stable-employment percentage? A property-management company in the area should have these aggregated.
- How much new apartment / multifamily construction is in the pipeline within 1–3 miles? Heavy new supply (>2% of stock underway) typically softens rents 12–24 months out; light construction supports rent growth.
Investment metrics
- 1% rule
- 0.37% ✗
- Cap rate
- 2.05%
- Cash-on-cash
- -15.15%
- DSCR
- 0.33
- GRM
- 22.7
CMA / ARV
- ARV (median comp)
- $1,058,891
- List price
- $709,000
- Delta
- -33.04%
- Verdict
- UNDERPRICED
- Comps
- 12 within 1.0 mi
Show comp detail 2 sales within ~0.75 mi
| Address | Dist | Beds/Ba | Sqft | Sold | Price | $/sf | Match |
|---|---|---|---|---|---|---|---|
| 168 Seward St | 0.34mi | 5/3.0 (+1) | 2,428 (+6%) | 4mo | $800,000 | $329 | 67 |
| 151 Seward St | 0.39mi | 4/4.0 | 2,220 (-4%) | 16mo | $842,800 | $380 | 58 |
Match score weights: distance 35% · size 25% · config 20% · recency 20%. Top-matched comps best support the ARV.
Projected returns pro-forma
-3.0% appreciation · 3.0% rent growth · sell at horizon
- IRR
- -45.5%
- Equity multiple
- -0.38×
- Total profit
- $-274,650
- Equity at exit
- $105,714
- IRR
- -84.2%
- Equity multiple
- -1.24×
- Total profit
- $-445,351
- Equity at exit
- $61,301
Cash invested: $198,520 (down + closing). Projections, not guarantees.
Landlord ↔ Tenant lean methodology
- Overall (STATE)
- 15 Strongly Tenant-Friendly
- State New York
- 15 Strongly Tenant-Friendly · D+10
- County
- — inherits STATE
- City
- — inherits STATE
ZIP-level market 10511
- Home prices YoY
- -15.1%
- Active inventory
- 20
- Price-to-rent
- 22.7×
Monthly cashflow live
- Estimated rent
- $2,598 medium interval (Pro) →
- Mortgage (P&I)
- −$3,718
- Tax from tax record
- −$545 /mo · $6,538/yr
- Insurance
- −$295
- HOA
- −$0
- Vacancy / Maint / Mgmt
- −$546
- Net cashflow
- $-2,506
Break-even live
Sensitivity live
| Price | -10% $-2,104 | -5% $-2,305 | +0% $-2,506 | +5% $-2,706 | +10% $-2,907 |
|---|---|---|---|---|---|
| Rent | -10% $-2,711 | -5% $-2,608 | +0% $-2,506 | +5% $-2,403 | +10% $-2,300 |
| Rate | -1.0pp $-2,149 | -0.5pp $-2,325 | base $-2,506 | +0.5pp $-2,689 | +1.0pp $-2,876 |
UW: 25.0% down · 7.5% · 30yr · 1.5% tax · 5.0% vac · 8.0% maint · 8.0% mgmt
Financing live
Cash to close
- Down payment
- $177,250
- Closing costs
- $21,270
- Reserves months
- —
- Total cash needed
- —
Loan-product check · same deal, 3 products live
Conventional
25% down · 7.5% · 30yr
- Down + closing
- —
- Monthly P&I
- —
- Monthly cashflow
- —
- DSCR
- —
- Eligible?
- —
Personal DTI + credit; lowest rate.
DSCR
20% down · 8.5% · 30yr
- Down + closing
- —
- Monthly P&I
- —
- Monthly cashflow
- —
- DSCR
- —
- Eligible?
- —
No personal income docs; deal must DSCR.
Hard money
10% down · 12.0% · 12mo
- Down + closing
- —
- Monthly P&I
- —
- Monthly cashflow
- —
- DSCR
- —
- Eligible?
- —
Short-term bridge; refi at stabilization.
Listing history 16 events
-
2026-06-17status $709,000 Pending 37 DOM
-
2026-06-17days on market $709,000 Active 37 DOM
-
2026-06-16days on market $709,000 Active 36 DOM
-
2026-06-15days on market $709,000 Active 35 DOM
-
2026-06-13days on market $709,000 Active 33 DOM
-
2026-06-13days on market $709,000 Active 32 DOM
-
2026-06-09days on market $709,000 Active 29 DOM
-
2026-06-08days on market $709,000 Active 28 DOM
-
2026-06-07days on market $709,000 Active 27 DOM
-
2026-06-04days on market $709,000 Active 24 DOM
-
2026-06-03days on market $709,000 Active 23 DOM
-
2026-06-02days on market $709,000 Active 22 DOM
-
2026-06-01days on market $709,000 Active 21 DOM
-
2026-05-31days on market $709,000 Active 20 DOM
-
2026-05-11$709,000 Active 541-char remark
-
1984-09-26soldstatus $101,000
ⓘ Source: listings_history table (triggers on properties + properties_extension) + one-shot
backfill from property_details.listing_events for pre-trigger history.
Tax reassessment forecast NY · Partial reset (capped growth)
- Current annual tax
- $6,538 · $545/mo
- Projected year-2 tax
- $9,260 · $772/mo
- Expected delta
- +$2,722/yr (+$227/mo · 41.6%)
ⓘ Screening estimate from a state-policy table — verify with the county assessor before closing.
Climate risk First Street
- Flood 1/10 Low FEMA zone X (unshaded) · 0% chance over 30 yrs
- Wildfire 1/10 Low
- Heat 6/10 Major 7 d/yr ≥101°F today · 15 d/yr by 30 yrs out
- Wind 4/10 Moderate 21% chance of damaging wind over 30 yrs
- Air quality 3/10 Moderate 2 unhealthy d/yr today · 4 by 30 yrs out
Nearby sold comps map
Loading sold comps map…
Walkable amenities ~0.75 mi
Loading nearby amenities…
Taxation est. · year 1
- Rental income
- $31,178
- − Mortgage interest
- −$39,715
- − Property taxes
- −$6,538
- − Insurance
- −$3,545
- − Repairs & maintenance
- −$2,494
- − Management
- −$2,494
- − Depreciation
- −$20,625
- Taxable loss
- −$44,233
- Est. tax savings @ 24.0%
- +$10,616
- After-tax cash flow
- $-19,453/yr
For passive investors: Depreciation is non-cash, so a rental often shows a tax loss while cash-flowing — sheltering income. Rental losses are passive: they offset passive income freely, and up to $25,000/yr can offset ordinary (W-2) income if you actively participate and your MAGI is under $100k (phasing out to $0 by $150k); unused losses carry forward. On sale, claimed depreciation is recaptured at up to 25%, and gains may owe capital-gains tax (a 1031 exchange can defer both). Figures are a year-1 estimate at your 24.0% rate — not tax advice; consult a CPA.
Schools (NCES district)
- District
- Hendrick Hudson Central School District
- NCES district ID
- 3614190
- Math proficiency
- 62% ▼ -2.00%
- Reading proficiency
- 72% ▲ 15.00%
- Median HH income
- $88,159
- Composite
- 60.49/100
- National rank
- #846
- State rank
- #143 of 590 in NY
Livability — Buchanan
- Score
- 79/100
- State rank
- #139
- US rank
- #2170
Category grades
Schools grade is shown separately in the Schools card above.
Census & demographics
- Census place
- Buchanan, NY
- City population
- 2,296
- Population (ZIP)
- 2,296
Population outlook (Westchester County) Hauer SSP2
- Today (2025)
- 1,028,035 people
- By 2030
- 1,051,636 · +2.3%
- By 2040
- 1,098,520 · +6.9%
- By 2050
- 1,136,044 · +10.5%
- By 2075
- 1,196,925 · +16.4%
- By 2100
- 1,175,147 · +14.3%
Race, ethnicity, and origin ACS 2023
- Neighborhood character
- Diverse neighborhood (Simpson 0.61)
- Race & ethnicity
- White 58% Hispanic / Latino 22% Two or more races 17% Black 8% Asian 6%
- Hispanic origin (detail)
- Puerto Rican 4%
- Common ancestry
- Italian 4% Romanian 2% Slovak 1%
- Foreign-born
- 10% · Canada, China
- Languages at home
- 76% English-only · Spanish 12% Chinese 6% German/W. Germanic 2%
Political lean MEDSL · Westchester
- 2024 margin
- Strong D (+26.3) · D 63.1% · R 36.9%
- 2008→2024 swing
- -1.3pp toward R · 2008: 27.6pp · 2024: 26.3pp
- All cycles
- 2024: D+26.3 2020: D+36.3 2016: D+32.8 2012: D+22.2 2008: D+27.6
Not yet ingested
- Civics
- —
Market trends
- HPI YoY
- ▼ -40.72%
- Current HPI
- 229.5204
- Rent YoY
- —
- Metro
- —
- State GDP YoY
- ▲ 2.60%
- F500 in state
- 92
Industry mix (Fortune 500 HQ in NY)
| Industry | F500 HQs | Revenue |
|---|---|---|
| Financial Services | 10 | $950B |
|
||
| Consumer Goods | 9 | $162B |
|
||
| Insurance | 4 | $225B |
|
||
| Telecommunications | 2 | $144B |
|
||
| Pharmaceuticals | 2 | $112B |
|
||
| Media / Entertainment | 2 | $69B |
|
||
Price history
+602.0% since first listed3 events — show timeline
- 2026-06-17 Pending — OneKey® MLS as Distributed by MLS Grid
- 2026-05-11 Listed $709,000 OneKey® MLS as Distributed by MLS Grid
- 1984-09-26 Sold (Public Records) $101,000 Public Records
Property tax history
+2.1%/yrLatest (2025): $6,538 · +3.8% YoY. Source: county tax records.
Cash-flow waterfall
monthlySold comps — $/sqft
last 12 mo · ≤1 miLoading sold comps…