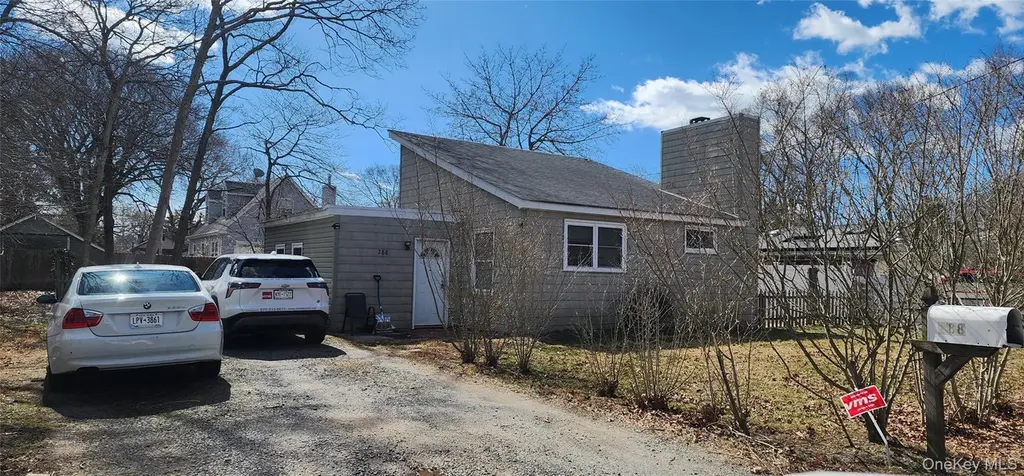
288 Cedar Rd W · Mastic Beach, NY
Flood risk 1/10 · Minimal
- FEMA flood zone
- X (unshaded)
- Chance of flooding over 30 yrs
- 0.0%
- Est. flood insurance / yr
- $473 – $860
Fire risk 1/10 · Minimal
- Est. fire insurance / yr
- $691 – $1,283
Heat risk 4/10 · Minor
- Hot days now (above 92°F)
- 7 days/yr
- Hot days in 30 yrs
- 20 days/yr
Wind risk 8/10 · Major
- Chance of severe wind over 30 yrs
- 80.0%
Air-quality risk 4/10 · Minor
- Unhealthy air days now
- 3 days/yr
- Unhealthy air days in 30 yrs
- 5 days/yr
Risk factors via First Street. Map © Google.
Why this score? — see what drove the B- grade
The composite is a weighted blend of 9 inputs, each scored 0–100. Each bar is that input's sub-score; the figure is the points it added to the 100-point composite (weight × sub-score).
- Cash flow +19.3/30.0
- ARV discount +15.0/15.0
- Appreciation +10.0/10.0
- DSCR +6.1/10.0
- 1% rule +5.0/10.0
- Schools +4.7/10.0
- Livability +3.1/5.0
- Rent growth +2.5/5.0
- Condition / age +2.5/5.0
$299,990
🖨 Deal sheet 📄 Offer letter ✓ Due diligence
Listing remarks MLS
Calling All investors ! Low taxes! Contemporary style home with long term tenants who would like to stay! Can be part of a package deal with 5 other homes! Be the 1st!
Key facts
- 7,841 sq ft lot
- Built 1955
- Listed 92 days
Neighborhood map
What this means for you Summary
Snapshot
- This is a 2-bed/1.0-bath single-family listed at $300k.
Deal economics
- At list price, monthly cash flow is $328 ($4k/yr) — positive.
- The deal already cash-flows at list — no discount required.
- To meet the 1% rule (rent ≥ 1% of price), the offer needs to be $299k (0.4% below list).
- Recommended offer: $273k (9.0% below list) — sets the bar for market timing.
- Cap rate 7.6% vs local median 4.7% in Mastic Beach — top-decile yield for the area; either an underpriced asset or a hidden risk that comps aren't pricing in. Stress-test before assuming the spread holds.
Location & tenants
- Location reads 61/100 on livability (#936 in NY) — a middle-class / working-renter tenant base. Strengths: employment A+, housing A+; Watch: schools D, crime D, amenities F.
- William Floyd Union Free School District (suburban): math 48% / reading 57% proficiency, ranked #309 of 590 in NY (top 52%) — acceptable for families but not a draw, mixed tenant base, ~2y average lease.
- Market conditions: 133 active listings in the ZIP; 4 comparable units currently listed for rent nearby; rentals at typical pace (median 17d on market — plan ~3-4 weeks tenant-placement turnaround); 1,366 units permitted in Suffolk County in 2024 (216 in 5+ unit buildings).
Forward outlook
- In year one you build about $32k of equity ($2k loan paydown + $30k appreciation (10.0% local appreciation)).
- Suffolk County population projected to shrink 5% by 2050 — rents likely to lag national; underwrite the cash flow, not the appreciation.
- At projected returns (10.0% appreciation + 3.0% rent growth), your $84k cash investment doubles in ~3 years — after that, you're playing with house money.
- By year 2, paydown + projected appreciation supports a ~$52k cash-out refi (75% LTV) — recoverable capital for the next deal without selling this one.
Negotiation context
- It's been on market 93 days — a 9% lower offer ($273k) is reasonable based on typical stale-listing flexibility.
- 2 sale attempts since 9y ago with the ask held roughly flat each time — persistent listings suggest the price (not the market) is what's stuck; bring a comps-based counter.
- Current owner paid $200k; 50% above their basis — modest negotiation headroom, anchor on the comps not their cost.
Risks & watch-outs
- Watch-outs: built in 1955 — expect roof / HVAC / electrical / plumbing capex.
- Climate carrying-cost: severe wind risk, 80% chance of damaging wind over 30y — expect insurance premiums to compound above CPI over the hold.
Questions for the listing agent
- It's been on market 93 days. Have you received any prior offers? Is the seller open to a 9% concession, seller financing, or rate buy-down credit?
- Built in 1955 — when were the roof, HVAC, electrical panel, plumbing, and water heater last replaced?
- Why hasn't it sold? Are there any deal-killer items the seller is aware of (foundation, flood, title, zoning, code violations)?
- Is there a deadline driving the sale (1031 exchange, divorce, estate, relocation)? That informs how much negotiation room exists.
- Schools are D-rated, which usually means shorter tenancies and higher turnover. Who's the typical renter profile here, and what's been the actual vacancy rate?
- Crime grade is D in this area — have there been break-ins, vandalism, or insurance claims at this property in the last 3 years? What carrier currently insures it and at what premium?
- What's the average days-on-market for RENTAL listings here right now (not sales)? A rising rental-DOM trend means longer vacancies and softer asking-rent achievability than the comps imply.
- What's the recent tenant-quality profile in this submarket — average credit score on applications, eviction rate, late-payment / NSF rate, and stable-employment percentage? A property-management company in the area should have these aggregated.
- How much new for-sale + rental construction is in the pipeline within 1–3 miles? Heavy new supply typically softens prices + rents 12–24 months out; constrained supply supports both.
Investment metrics
- 1% rule
- 1.00% ✗
- Cap rate
- 7.60%
- Cash-on-cash
- 4.68%
- DSCR
- 1.21
- GRM
- 8.4
CMA / ARV
- ARV (median comp)
- $421,284
- List price
- $299,990
- Delta
- -28.79%
- Verdict
- UNDERPRICED
- Comps
- 20 within 1.0 mi
Show comp detail 12 sales within ~0.75 mi
| Address | Dist | Beds/Ba | Sqft | Sold | Price | $/sf | Match |
|---|---|---|---|---|---|---|---|
| 123 Lynbrook Dr | 0.35mi | 2/1.0 | 795 (+1%) | 3mo | $370,000 | $465 | 80 |
| 21 Sherwood Dr | 0.33mi | 3/1.0 (+1) | 800 (+2%) | 9mo | $350,000 | $438 | 70 |
| 129 Locust Dr | 0.61mi | 2/1.0 | 800 (+2%) | 8mo | $371,000 | $464 | 63 |
| 313 Forest Rd W | 0.40mi | 2/1.0 | 864 (+10%) | 5mo | $399,000 | $462 | 62 |
| 192 E Parkview Dr | 0.55mi | 3/1.0 (+1) | 800 (+2%) | 6mo | $377,000 | $471 | 61 |
| 88 Woodside Rd | 0.51mi | 3/1.0 (+1) | 800 (+2%) | 10mo | $369,000 | $461 | 60 |
| 186 Cranberry Dr | 0.16mi | 2/1.0 | 900 (+14%) | 10mo | $320,000 | $356 | 60 |
| 19 Lacrosse Rd | 0.67mi | 2/1.0 | 740 (-6%) | 3mo | $275,000 | $372 | 56 |
| 80 Diana Dr | 0.47mi | 1/1.0 (-1) | 835 (+6%) | 11mo | $375,000 | $449 | 54 |
| 154 Jefferson Dr | 0.74mi | 2/1.0 | 836 (+6%) | 4mo | $380,000 | $455 | 52 |
| 94 Elder Dr | 0.33mi | 3/1.0 (+1) | 900 (+14%) | 7mo | $368,000 | $409 | 50 |
| 15 Robinwood Dr | 0.45mi | 2/2.0 | 700 (-11%) | 10mo | $461,000 | $659 | 48 |
Match score weights: distance 35% · size 25% · config 20% · recency 20%. Top-matched comps best support the ARV.
Projected returns pro-forma
10.0% appreciation · 3.0% rent growth · sell at horizon
- IRR
- 27.7%
- Equity multiple
- 3.19×
- Total profit
- $184,284
- Equity at exit
- $270,255
- IRR
- 24.1%
- Equity multiple
- 7.27×
- Total profit
- $526,306
- Equity at exit
- $582,815
Cash invested: $83,997 (down + closing). Projections, not guarantees.
Landlord ↔ Tenant lean methodology
- Overall (STATE)
- 15 Strongly Tenant-Friendly
- State New York
- 15 Strongly Tenant-Friendly · D+10
- County
- — inherits STATE
- City
- — inherits STATE
ZIP-level market 11951
- Home prices YoY
- 4.3%
- Active inventory
- 133
- Price-to-rent
- 8.4×
Monthly cashflow live
- Estimated rent
- $2,988 medium interval (Pro) →
- Mortgage (P&I)
- −$1,573
- Tax from tax record
- −$334 /mo · $4,010/yr
- Insurance
- −$125
- HOA
- −$0
- Vacancy / Maint / Mgmt
- −$627
- Net cashflow
- $328
Break-even live
UW: 25.0% down · 7.5% · 30yr · 1.5% tax · 5.0% vac · 8.0% maint · 8.0% mgmt
Financing live
Cash to close
- Down payment
- $74,998
- Closing costs
- $9,000
- Reserves months
- —
- Total cash needed
- —
Loan-product check · same deal, 3 products live
Conventional
25% down · 7.5% · 30yr
- Down + closing
- —
- Monthly P&I
- —
- Monthly cashflow
- —
- DSCR
- —
- Eligible?
- —
Personal DTI + credit; lowest rate.
DSCR
20% down · 8.5% · 30yr
- Down + closing
- —
- Monthly P&I
- —
- Monthly cashflow
- —
- DSCR
- —
- Eligible?
- —
No personal income docs; deal must DSCR.
Hard money
10% down · 12.0% · 12mo
- Down + closing
- —
- Monthly P&I
- —
- Monthly cashflow
- —
- DSCR
- —
- Eligible?
- —
Short-term bridge; refi at stabilization.
Rent comps 4 comps
| Address | Beds | Baths | Sqft | Rent | $/sqft | DOM | Units | Dist |
|---|---|---|---|---|---|---|---|---|
| 12 Hackensack Rd Mastic Beach, NY | 3.0 | 1.0 | 792 | $3,150 | $3.98 | 17d | 1 | 0.46mi |
| 79 Manor Dr Shirley, NY | 2.0 | 1.0 | 600 | $2,800 | $4.67 | 1d | 1 | 1.18mi |
| 67 Saint George Dr Shirley, NY | 2.0 | 1.0 | 714 | $2,750 | $3.85 | 44d | 1 | 1.29mi |
| 5 Cedar Rd E Mastic Beach, NY | 3.0 | 1.0 | 740 | $2,900 | $3.92 | 1d | 1 | 1.32mi |
Listing history 26 events
-
2026-06-18days on market $299,990 Active 93 DOM
-
2026-06-17days on market $299,990 Active 92 DOM
-
2026-06-16days on market $299,990 Active 91 DOM
-
2026-06-15days on market $299,990 Active 90 DOM
-
2026-06-13days on market $299,990 Active 88 DOM
-
2026-06-13days on market $299,990 Active 87 DOM
-
2026-06-09days on market $299,990 Active 84 DOM
-
2026-06-08days on market $299,990 Active 83 DOM
-
2026-06-07days on market $299,990 Active 82 DOM
-
2026-06-04days on market $299,990 Active 79 DOM
-
2026-06-03days on market $299,990 Active 78 DOM
-
2026-06-02days on market $299,990 Active 77 DOM
-
2026-06-01days on market $299,990 Active 76 DOM
-
2026-05-31days on market $299,990 Active 75 DOM
-
2026-03-16$299,990 Active 167-char remark
Show marketing remark (167 chars)
Calling All investors ! Low taxes! Contemporary style home with long term tenants who would like to stay! Can be part of a package deal with 5 other homes! Be the 1st!
-
2022-05-24soldstatus $200,000
-
2019-06-19soldstatus $126,500
-
2019-05-02soldstatus $126,500 Closed 184-char remark
Show marketing remark (184 chars)
Calling All Investors !! Contemporary Style With New Roof -Tenant Occupied-Nice Condition -Low Taxes !! Great Tenants !, Additional information: Appearance:Nice,Interior Features:Lr/Dr
-
2019-02-07status Under Contract 184-char remark
Show marketing remark (184 chars)
Calling All Investors !! Contemporary Style With New Roof -Tenant Occupied-Nice Condition -Low Taxes !! Great Tenants !, Additional information: Appearance:Nice,Interior Features:Lr/Dr
-
2018-12-15price $129,990 184-char remark
Show marketing remark (184 chars)
Calling All Investors !! Contemporary Style With New Roof -Tenant Occupied-Nice Condition -Low Taxes !! Great Tenants !, Additional information: Appearance:Nice,Interior Features:Lr/Dr
-
2018-10-10price $134,990 184-char remark
Show marketing remark (184 chars)
Calling All Investors !! Contemporary Style With New Roof -Tenant Occupied-Nice Condition -Low Taxes !! Great Tenants !, Additional information: Appearance:Nice,Interior Features:Lr/Dr
-
2018-03-13price $135,000 184-char remark
Show marketing remark (184 chars)
Calling All Investors !! Contemporary Style With New Roof -Tenant Occupied-Nice Condition -Low Taxes !! Great Tenants !, Additional information: Appearance:Nice,Interior Features:Lr/Dr
-
2018-01-31price $139,990 184-char remark
Show marketing remark (184 chars)
Calling All Investors !! Contemporary Style With New Roof -Tenant Occupied-Nice Condition -Low Taxes !! Great Tenants !, Additional information: Appearance:Nice,Interior Features:Lr/Dr
-
2017-11-22$149,990 New 184-char remark
Show marketing remark (184 chars)
Calling All Investors !! Contemporary Style With New Roof -Tenant Occupied-Nice Condition -Low Taxes !! Great Tenants !, Additional information: Appearance:Nice,Interior Features:Lr/Dr
-
2007-08-09soldstatus $95,000
-
2007-04-02soldstatus $27,440
ⓘ Source: listings_history table (triggers on properties + properties_extension) + one-shot
backfill from property_details.listing_events for pre-trigger history.
Tax reassessment forecast NY · Partial reset (capped growth)
- Current annual tax
- $4,010 · $334/mo
- Projected year-2 tax
- $4,540 · $378/mo
- Expected delta
- +$530/yr (+$44/mo · 13.2%)
ⓘ Screening estimate from a state-policy table — verify with the county assessor before closing.
Climate risk First Street
- Flood 1/10 Low FEMA zone X (unshaded) · 0% chance over 30 yrs
- Wildfire 1/10 Low
- Heat 4/10 Moderate 7 d/yr ≥92°F today · 20 d/yr by 30 yrs out
- Wind 8/10 Severe 80% chance of damaging wind over 30 yrs
- Air quality 4/10 Moderate 3 unhealthy d/yr today · 5 by 30 yrs out
Nearby sold comps map
Loading sold comps map…
Walkable amenities ~0.75 mi
Loading nearby amenities…
Taxation est. · year 1
- Rental income
- $35,851
- − Mortgage interest
- −$16,804
- − Property taxes
- −$4,010
- − Insurance
- −$1,500
- − Repairs & maintenance
- −$2,868
- − Management
- −$2,868
- − Depreciation
- −$8,727
- Taxable loss
- −$926
- Est. tax savings @ 24.0%
- +$222
- After-tax cash flow
- $4,157/yr
For passive investors: Depreciation is non-cash, so a rental often shows a tax loss while cash-flowing — sheltering income. Rental losses are passive: they offset passive income freely, and up to $25,000/yr can offset ordinary (W-2) income if you actively participate and your MAGI is under $100k (phasing out to $0 by $150k); unused losses carry forward. On sale, claimed depreciation is recaptured at up to 25%, and gains may owe capital-gains tax (a 1031 exchange can defer both). Figures are a year-1 estimate at your 24.0% rate — not tax advice; consult a CPA.
Schools (NCES district)
- District
- William Floyd Union Free School District
- NCES district ID
- 3618690
- Math proficiency
- 48% ▲ 3.00%
- Reading proficiency
- 57% ▲ 11.00%
- Median HH income
- $70,564
- Composite
- 46.79/100
- National rank
- #2383
- State rank
- #309 of 590 in NY
Livability — Mastic Beach
- Score
- 61/100
- State rank
- #936
- US rank
- #18216
Category grades
Schools grade is shown separately in the Schools card above.
Census & demographics
- Census place
- Mastic Beach, NY
- City population
- 15,830
- Population (ZIP)
- 15,830
Population outlook (Suffolk County) Hauer SSP2
- Today (2025)
- 1,505,262 people
- By 2030
- 1,498,318 · -0.5%
- By 2040
- 1,471,101 · -2.3%
- By 2050
- 1,424,848 · -5.3%
- By 2075
- 1,337,157 · -11.2%
- By 2100
- 1,217,720 · -19.1%
Race, ethnicity, and origin ACS 2023
- Neighborhood character
- Predominantly White (68%)
- Race & ethnicity
- White 68% Hispanic / Latino 17% Two or more races 9% Black 6% Asian 2%
- Hispanic origin (detail)
- Mexican 1% Puerto Rican 6% Cuban 2%
- Common ancestry
- Lithuanian 3% Romanian 2% Italian 2%
- Foreign-born
- 7% · Canada, Vietnam
- Languages at home
- 84% English-only · Spanish 10% Other Indo-European 3% Chinese 1%
Political lean MEDSL · Suffolk
- 2024 margin
- Lean R (+10.0) · D 45.0% · R 55.0%
- 2008→2024 swing
- -16.0pp toward R · 2008: 6.0pp · 2024: -10.0pp
- All cycles
- 2024: R+10.0 2020: R+0.0 2016: R+8.2 2012: D+2.9 2008: D+6.0
Not yet ingested
- Civics
- —
Market trends
- HPI YoY
- ▲ 34.46%
- Current HPI
- 829.86
- Rent YoY
- —
- Metro
- —
- State GDP YoY
- ▲ 2.60%
- F500 in state
- 92
Industry mix (Fortune 500 HQ in NY)
| Industry | F500 HQs | Revenue |
|---|---|---|
| Financial Services | 10 | $950B |
|
||
| Consumer Goods | 9 | $162B |
|
||
| Insurance | 4 | $225B |
|
||
| Telecommunications | 2 | $144B |
|
||
| Pharmaceuticals | 2 | $112B |
|
||
| Media / Entertainment | 2 | $69B |
|
||
Price history
+993.3% since first listed12 events — show timeline
- 2026-03-16 Listed $299,990 OneKey® MLS as Distributed by MLS Grid
- 2022-05-24 Sold (Public Records) $200,000 Public Records
- 2019-06-19 Sold (Public Records) $126,500 Public Records
- 2019-05-02 Sold (MLS) $126,500 OneKey® MLS as Distributed by MLS Grid
- 2019-02-07 Pending — OneKey® MLS as Distributed by MLS Grid
- 2018-12-15 Price Changed $129,990 OneKey® MLS as Distributed by MLS Grid
- 2018-10-10 Price Changed $134,990 OneKey® MLS as Distributed by MLS Grid
- 2018-03-13 Price Changed $135,000 OneKey® MLS as Distributed by MLS Grid
- 2018-01-31 Price Changed $139,990 OneKey® MLS as Distributed by MLS Grid
- 2017-11-22 Listed $149,990 OneKey® MLS as Distributed by MLS Grid
- 2007-08-09 Sold (Public Records) $95,000 Public Records
- 2007-04-02 Sold (Public Records) $27,440 Public Records
Property tax history
+1.3%/yrLatest (2025): $4,010 · +0.0% YoY. Source: county tax records.
Cash-flow waterfall
monthlySold comps — $/sqft
last 12 mo · ≤1 miLoading sold comps…