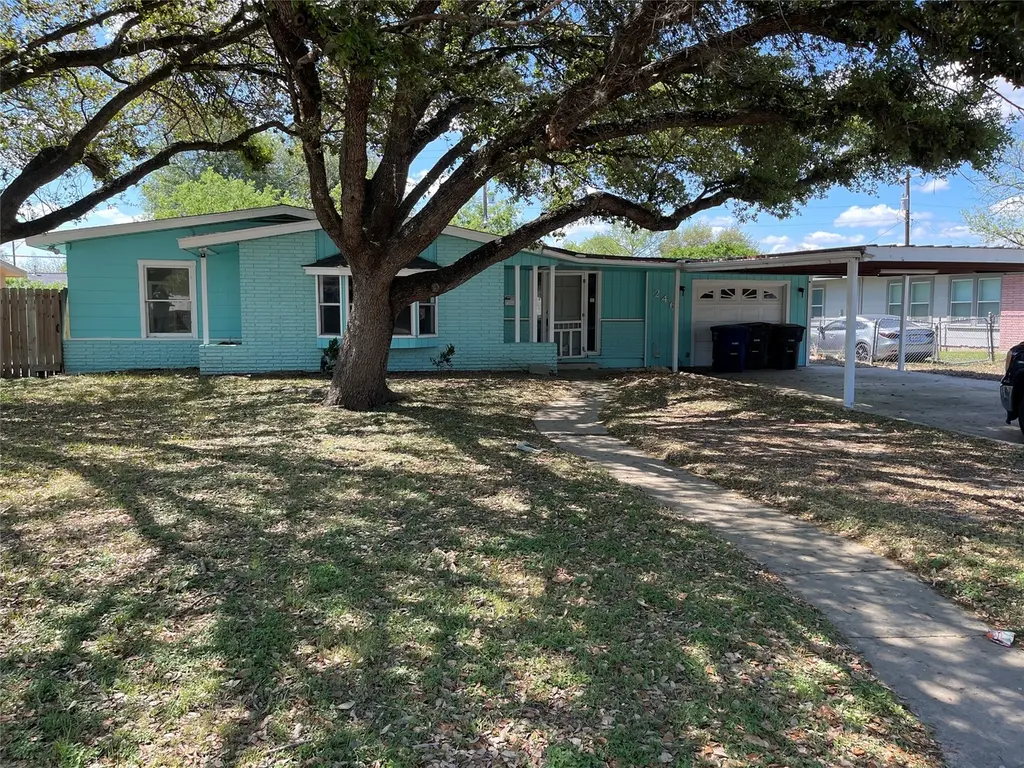
246 Nash Blvd · San Antonio, TX
Flood risk 5/10 · Moderate
- FEMA flood zone
- X (unshaded)
- Chance of flooding over 30 yrs
- 0.66%
- Est. flood insurance / yr
- $507 – $1,088
Fire risk 4/10 · Minor
- Est. fire insurance / yr
- $1,222 – $2,270
Heat risk 8/10 · Major
- Hot days now (above 109°F)
- 7 days/yr
- Hot days in 30 yrs
- 22 days/yr
Wind risk 8/10 · Major
- Chance of severe wind over 30 yrs
- 80.0%
Air-quality risk 2/10 · Minimal
- Unhealthy air days now
- 0 days/yr
- Unhealthy air days in 30 yrs
- 2 days/yr
Risk factors via First Street. Map © Google.
Why this score? — see what drove the C grade
The composite is a weighted blend of 9 inputs, each scored 0–100. Each bar is that input's sub-score; the figure is the points it added to the 100-point composite (weight × sub-score).
- Cash flow +17.7/30.0
- ARV discount +15.0/15.0
- 1% rule +7.3/10.0
- DSCR +5.5/10.0
- Livability +4.0/5.0
- Condition / age +2.5/5.0
- Rent growth +1.7/5.0
- Schools +1.4/10.0
- Appreciation +0.0/10.0
$135,000
🖨 Deal sheet 📄 Offer letter ✓ Due diligence
Listing remarks MLS
Don’t miss this incredible opportunity in a growing San Antonio neighborhood! This home at 246 Nash Blvd offers great potential with a flexible floor plan, generous yard space, and a location that puts you minutes from everything you need. Whether you’re a first-time buyer, investor, or looking to add your personal touch, this property is full of possibilities. Easy access to major roadways, shopping, and local amenities makes this one a must-see!
Key facts
- Flexible floor plan
- Generous yard space
- 8,394 sq ft lot
Tags
Neighborhood map
What this means for you Summary
Snapshot
- This is a 3-bed/1.5-bath single-family listed at $135k.
Deal economics
- At list price, monthly cash flow is $109 ($1k/yr) — positive.
- The deal already cash-flows at list — no discount required.
- Meets the 1% rule at list price ($2k rent vs $135k).
- Recommended offer: $127k (6.0% below list) — sets the bar for market timing.
- Cap rate 7.3% vs local median 3.8% in San Antonio — top-decile yield for the area; either an underpriced asset or a hidden risk that comps aren't pricing in. Stress-test before assuming the spread holds.
Location & tenants
- Location reads 80/100 on livability (#31 in TX, #1,616 nationally) — a professional / high-income tenant draw. Strengths: amenities A+, commute A+, cost of living A+; Watch: schools C-, crime F.
- San Antonio ISD (urban): math 12% / reading 22% proficiency, ranked #805 of 826 in TX (top 98%) — low school quality limits family demand, transient renter base, plan for 1-2y turnover; 80% free/reduced lunch — lower-income household profile, screen leases tightly.
- Market conditions: Rents falling (-3.4%/yr); 325 active listings in the ZIP; 19 comparable units currently listed for rent nearby; rentals at typical pace (median 18d on market — plan ~3-4 weeks tenant-placement turnaround); 8,308 units permitted in Bexar County in 2024 (2,506 in 5+ unit buildings).
- This rent runs 38% of the median local income ($52k/yr) — at the standard rent-burdened threshold; future hikes will face affordability resistance.
Forward outlook
- Local home prices are declining (-3.0%/yr); year-one equity from $933 of loan paydown is wiped out by about $4k of value loss. Plan a longer hold.
- Bexar County population projected at +50% by 2050 — long-run rental-demand tailwind backs the buy-and-hold thesis.
Negotiation context
- It's been on market 69 days — a 6% lower offer ($127k) is reasonable based on typical stale-listing flexibility.
- 7 sale attempts since 12y ago; this cycle's ask has dropped $20k (13%) from the opening price — seller is motivated, your offer sets the floor, not the list.
Risks & watch-outs
- Watch-outs: property tax is 3.9% of price; built in 1955 — expect roof / HVAC / electrical / plumbing capex.
- Climate carrying-cost: moderate flood risk; severe wind risk, 80% chance of damaging wind over 30y; extreme-heat days projected 7→22/yr by 2055 (HVAC capex compounding) — expect insurance premiums to compound above CPI over the hold.
Questions for the listing agent
- It's been on market 69 days. Have you received any prior offers? Is the seller open to a 6% concession, seller financing, or rate buy-down credit?
- Built in 1955 — when were the roof, HVAC, electrical panel, plumbing, and water heater last replaced?
- Property tax is high relative to price — has the assessment been appealed recently, and will the sale trigger a re-assessment?
- Why hasn't it sold? Are there any deal-killer items the seller is aware of (foundation, flood, title, zoning, code violations)?
- Is there a deadline driving the sale (1031 exchange, divorce, estate, relocation)? That informs how much negotiation room exists.
- Crime grade is F in this area — have there been break-ins, vandalism, or insurance claims at this property in the last 3 years? What carrier currently insures it and at what premium?
- What's the average days-on-market for RENTAL listings here right now (not sales)? A rising rental-DOM trend means longer vacancies and softer asking-rent achievability than the comps imply.
- What's the recent tenant-quality profile in this submarket — average credit score on applications, eviction rate, late-payment / NSF rate, and stable-employment percentage? A property-management company in the area should have these aggregated.
- How much new for-sale + rental construction is in the pipeline within 1–3 miles? Heavy new supply typically softens prices + rents 12–24 months out; constrained supply supports both.
Investment metrics
- 1% rule
- 1.23% ✓
- Cap rate
- 7.26%
- Cash-on-cash
- 3.47%
- DSCR
- 1.15
- GRM
- 6.8
CMA / ARV
- ARV (median comp)
- $196,411
- List price
- $135,000
- Delta
- -31.27%
- Verdict
- UNDERPRICED
- Comps
- 20 within 1.0 mi
Show comp detail 12 sales within ~0.75 mi
| Address | Dist | Beds/Ba | Sqft | Sold | Price | $/sf | Match |
|---|---|---|---|---|---|---|---|
| 203 Hatcher | 0.10mi | 3/3.0 | 1,909 (+6%) | 1mo | $310,000 | $162 | 78 |
| 322 Kate Schenck | 0.21mi | 3/2.0 | 1,752 (-2%) | 10mo | $124,900 | $71 | 76 |
| 283 Hatcher | 0.33mi | 4/1.5 (+1) | 1,814 (+1%) | 3mo | $185,000 | $102 | 75 |
| 8630 Utopia Gdns | 0.34mi | 3/2.0 | 1,904 (+6%) | 0mo | $235,999 | $124 | 72 |
| 271 Hatcher | 0.30mi | 4/2.0 (+1) | 1,880 (+5%) | 6mo | $224,500 | $119 | 66 |
| 346 Nash Blvd | 0.24mi | 3/2.0 | 1,578 (-12%) | 1mo | $180,000 | $114 | 66 |
| 3714 Portsmouth | 0.64mi | 3/2.0 | 1,749 (-3%) | 6mo | $122,500 | $70 | 59 |
| 311 Ryan | 0.68mi | 4/2.0 (+1) | 1,805 (+0%) | 3mo | $180,600 | $100 | 58 |
| 434 Kate Schenck Ave | 0.49mi | 4/2.0 (+1) | 1,658 (-8%) | 4mo | $174,900 | $105 | 53 |
| 3403 Bob Billa | 0.60mi | 3/2.0 | 2,034 (+13%) | 2mo | $120,840 | $59 | 47 |
| 3807 E Palfrey St | 0.67mi | 4/2.0 (+1) | 1,641 (-9%) | 3mo | $199,500 | $122 | 45 |
| 5624 Jasper Pl | 0.67mi | 4/2.0 (+1) | 1,600 (-11%) | 6mo | $219,999 | $137 | 39 |
Match score weights: distance 35% · size 25% · config 20% · recency 20%. Top-matched comps best support the ARV.
Projected returns pro-forma
-3.0% appreciation · 0.0% rent growth · sell at horizon
- IRR
- -15.0%
- Equity multiple
- 0.48×
- Total profit
- $-19,573
- Equity at exit
- $20,129
- IRR
- -14.5%
- Equity multiple
- 0.31×
- Total profit
- $-26,050
- Equity at exit
- $11,672
Cash invested: $37,800 (down + closing). Projections, not guarantees.
Landlord ↔ Tenant lean methodology
- Overall (STATE)
- 87 Strongly Landlord-Friendly
- State Texas
- 87 Strongly Landlord-Friendly · R+5
- County
- — inherits STATE
- City
- — inherits STATE
ZIP-level market 78223
- Home prices YoY
- -16.4%
- Rents YoY
- -3.4%
- Active inventory
- 325
- Price-to-rent
- 6.8×
Monthly cashflow live
- Estimated rent
- $1,654 high interval (Pro) →
- Mortgage (P&I)
- −$708
- Tax from tax record
- −$433 /mo · $5,198/yr
- Insurance
- −$56
- HOA
- −$0
- Vacancy / Maint / Mgmt
- −$347
- Net cashflow
- $109
Break-even live
UW: 25.0% down · 7.5% · 30yr · 1.5% tax · 5.0% vac · 8.0% maint · 8.0% mgmt
Financing live
Cash to close
- Down payment
- $33,750
- Closing costs
- $4,050
- Reserves months
- —
- Total cash needed
- —
Loan-product check · same deal, 3 products live
Conventional
25% down · 7.5% · 30yr
- Down + closing
- —
- Monthly P&I
- —
- Monthly cashflow
- —
- DSCR
- —
- Eligible?
- —
Personal DTI + credit; lowest rate.
DSCR
20% down · 8.5% · 30yr
- Down + closing
- —
- Monthly P&I
- —
- Monthly cashflow
- —
- DSCR
- —
- Eligible?
- —
No personal income docs; deal must DSCR.
Hard money
10% down · 12.0% · 12mo
- Down + closing
- —
- Monthly P&I
- —
- Monthly cashflow
- —
- DSCR
- —
- Eligible?
- —
Short-term bridge; refi at stabilization.
Rent comps 19 comps
| Address | Beds | Baths | Sqft | Rent | $/sqft | DOM | Units | Dist |
|---|---|---|---|---|---|---|---|---|
| 271 Kate Schenck Ave San Antonio, TX | 3.0 | 2.0 | 1250 | $1,450 | $1.16 | 20d | 1 | 0.12mi |
| 7035 Pickwell Dr San Antonio, TX | 1.0–3.0 | 1.0–2.0 | 953 | $1,769 | $1.86 | 3d | 32 | 0.66mi |
| 311 Ryan Dr San Antonio, TX | 4.0 | 2.0 | 1800 | $1,900 | $1.06 | 17d | 1 | 0.66mi |
| 3814 Gayle Ave San Antonio, TX | 4.0 | 2.0 | 1686 | $2,100 | $1.25 | 17d | 1 | 0.70mi |
| 4011 Anton Dr San Antonio, TX | 3.0 | 2.0 | 1269 | $1,500 | $1.18 | 43d | 1 | 0.92mi |
| 4515 Golf View Dr San Antonio, TX | 3.0 | 2.5 | 1781 | $1,799 | $1.01 | 14d | 1 | 1.15mi |
| 4155 Freestone St San Antonio, TX | 4.0 | 2.0 | 1259 | $1,495 | $1.19 | 23d | 1 | 1.22mi |
| 4155 Freestone St San Antonio, TX | 4.0 | 2.0 | 1259 | $1,495 | $1.19 | 4d | 1 | 1.22mi |
| 7818 Shetland Dr San Antonio, TX | 3.0 | 2.5 | 1380 | $1,475 | $1.07 | 43d | 2 | 1.26mi |
| 7818 Shetland Dr Unit 101 San Antonio, TX | 3.0 | 2.5 | 1225 | $1,475 | $1.20 | 43d | 1 | 1.26mi |
| 7818 Shetland Dr Unit 102 San Antonio, TX | 3.0 | 2.5 | 1225 | $1,395 | $1.14 | 21d | 1 | 1.26mi |
| 7818 Shetland Dr San Antonio, TX | 3.0 | 2.5 | 1380 | $1,550 | $1.12 | 23d | 2 | 1.26mi |
| 4011 Bear Oak Path San Antonio, TX | 3.0 | 2.5 | 2214 | $1,940 | $0.88 | 4d | 1 | 1.27mi |
| 7910 S New Braunfels Ave San Antonio, TX | 1.0–3.0 | 1.0–2.0 | 1187 | $2,640 | $2.22 | 1d | 48 | 1.32mi |
| 4007 Dunn Oak Dr San Antonio, TX | 3.0 | 2.5 | 2500 | $1,995 | $0.80 | 10d | 1 | 1.38mi |
| 4407 Grassland Pass San Antonio, TX | 4.0 | 2.0 | 1500 | $1,597 | $1.06 | 4d | 1 | 1.44mi |
| 4419 Meadowland Pl San Antonio, TX | 4.0 | 3.0 | 1910 | $1,806 | $0.95 | 43d | 1 | 1.47mi |
| 6222 S New Braunfels Ave San Antonio, TX | 1.0–4.0 | 1.0–2.0 | 1258 | $1,359 | $1.08 | 10d | 12 | 1.49mi |
| 4442 Grassland Pass San Antonio, TX | 4.0 | 2.0 | 1492 | $1,685 | $1.13 | 4d | 1 | 1.49mi |
Listing history 38 events
-
2026-06-18days on market $135,000 Active 69 DOM
-
2026-06-17days on market $135,000 Active 68 DOM
-
2026-06-16days on market $135,000 Active 67 DOM
-
2026-06-15days on market $135,000 Active 66 DOM
-
2026-06-13days on market $135,000 Active 64 DOM
-
2026-06-09days on market $135,000 Active 60 DOM
-
2026-06-08days on market $135,000 Active 59 DOM
-
2026-06-07days on market $135,000 Active 58 DOM
-
2026-06-04days on market $135,000 Active 55 DOM
-
2026-06-03days on market $135,000 Active 54 DOM
-
2026-06-02days on market $135,000 Active 53 DOM
-
2026-06-02price $135,000 Active 52 DOM
-
2026-06-01days on market $140,000 Active 52 DOM
-
2026-05-31days on market $140,000 Active 51 DOM
-
2026-05-13price $140,000 463-char remark
Show marketing remark (463 chars)
Don’t miss this incredible opportunity in a growing San Antonio neighborhood! This home at 246 Nash Blvd offers great potential with a flexible floor plan, generous yard space, and a location that puts you minutes from everything you need. Whether you’re a first-time buyer, investor, or looking to add your personal touch, this property is full of possibilities. Easy access to major roadways, shopping, and local amenities makes this one a must-see!
-
2026-05-04price $145,000 463-char remark
Show marketing remark (463 chars)
Don’t miss this incredible opportunity in a growing San Antonio neighborhood! This home at 246 Nash Blvd offers great potential with a flexible floor plan, generous yard space, and a location that puts you minutes from everything you need. Whether you’re a first-time buyer, investor, or looking to add your personal touch, this property is full of possibilities. Easy access to major roadways, shopping, and local amenities makes this one a must-see!
-
2026-04-24price $150,000 463-char remark
Show marketing remark (463 chars)
Don’t miss this incredible opportunity in a growing San Antonio neighborhood! This home at 246 Nash Blvd offers great potential with a flexible floor plan, generous yard space, and a location that puts you minutes from everything you need. Whether you’re a first-time buyer, investor, or looking to add your personal touch, this property is full of possibilities. Easy access to major roadways, shopping, and local amenities makes this one a must-see!
-
2026-04-10$155,000 Active 463-char remark
Show marketing remark (463 chars)
Don’t miss this incredible opportunity in a growing San Antonio neighborhood! This home at 246 Nash Blvd offers great potential with a flexible floor plan, generous yard space, and a location that puts you minutes from everything you need. Whether you’re a first-time buyer, investor, or looking to add your personal touch, this property is full of possibilities. Easy access to major roadways, shopping, and local amenities makes this one a must-see!
-
2026-02-04historical
-
2026-01-06status Back on Market
-
2025-10-28status Pending
-
2025-09-11price $159,000
-
2025-07-30$165,000 New
-
2022-06-01historical
-
2022-05-17status Back on Market
-
2022-05-04historical Active Option
-
2022-03-26$205,000 New
-
2022-02-16price $1,495
-
2015-01-23soldstatus
-
2015-01-22soldstatus Sold
-
2015-01-14status Pending
-
2015-01-04historical Active Option
-
2014-12-19status Back on Market
-
2014-12-09historical Active Option
-
2014-12-04price $74,900
-
2014-11-09$78,000 New
-
2004-09-14soldstatus
-
2000-11-02soldstatus
ⓘ Source: listings_history table (triggers on properties + properties_extension) + one-shot
backfill from property_details.listing_events for pre-trigger history.
Tax reassessment forecast TX · Resets to sale price
- Current annual tax
- $5,198 · $433/mo
- Projected year-2 tax
- $5,198 · $433/mo
- Expected delta
- $0/yr ($0/mo · 0.0%)
ⓘ Screening estimate from a state-policy table — verify with the county assessor before closing.
Climate risk First Street
- Flood 5/10 Major FEMA zone X (unshaded) · 66% chance over 30 yrs
- Wildfire 4/10 Moderate
- Heat 8/10 Severe 7 d/yr ≥109°F today · 22 d/yr by 30 yrs out
- Wind 8/10 Severe 80% chance of damaging wind over 30 yrs
- Air quality 2/10 Low 0 unhealthy d/yr today · 2 by 30 yrs out
Nearby sold comps map
Loading sold comps map…
Walkable amenities ~0.75 mi
Loading nearby amenities…
Taxation est. · year 1
- Rental income
- $19,849
- − Mortgage interest
- −$7,562
- − Property taxes
- −$5,198
- − Insurance
- −$675
- − Repairs & maintenance
- −$1,588
- − Management
- −$1,588
- − Depreciation
- −$3,927
- Taxable loss
- −$690
- Est. tax savings @ 24.0%
- +$166
- After-tax cash flow
- $1,477/yr
For passive investors: Depreciation is non-cash, so a rental often shows a tax loss while cash-flowing — sheltering income. Rental losses are passive: they offset passive income freely, and up to $25,000/yr can offset ordinary (W-2) income if you actively participate and your MAGI is under $100k (phasing out to $0 by $150k); unused losses carry forward. On sale, claimed depreciation is recaptured at up to 25%, and gains may owe capital-gains tax (a 1031 exchange can defer both). Figures are a year-1 estimate at your 24.0% rate — not tax advice; consult a CPA.
Schools (NCES district)
- District
- San Antonio ISD
- NCES district ID
- 4838730
- Math proficiency
- 12% ▼ -21.00%
- Reading proficiency
- 22% ▼ -7.00%
- Median HH income
- $30,952
- Composite
- 13.57/100
- National rank
- #9512
- State rank
- #805 of 826 in TX
Livability — San Antonio
- Score
- 80/100
- State rank
- #31
- US rank
- #1616
Category grades
Schools grade is shown separately in the Schools card above.
Census & demographics
- Census place
- San Antonio, TX
- County
- Bexar County · 1,990,555 people
- City population
- 1,806,925
- Metro
- San Antonio-New Braunfels, TX
- Population (ZIP)
- 58,983
- Household income
- $52,088
- Rent vs Own
- Severe rent burden
- 2809.0
Population outlook (Bexar County) Hauer SSP2
- Today (2025)
- 2,336,851 people
- By 2030
- 2,560,728 · +9.6%
- By 2040
- 3,020,569 · +29.3%
- By 2050
- 3,493,522 · +49.5%
- By 2075
- 4,668,459 · +99.8%
- By 2100
- 5,533,242 · +136.8%
Race, ethnicity, and origin ACS 2023
- Neighborhood character
- Predominantly Hispanic (76%)
- Race & ethnicity
- Hispanic / Latino 76% Two or more races 28% White 16% Black 5% Asian 2% Native American 1%
- Hispanic origin (detail)
- Mexican 67%
- Common ancestry
- Lithuanian 2% Romanian 1% Slovak 1%
- Foreign-born
- 10% · Canada, Vietnam
- Languages at home
- 63% English-only · Spanish 36%
Political lean MEDSL · Bexar
- 2024 margin
- Lean D (+9.8) · D 54.3% · R 44.6% · Other 1.1%
- 2008→2024 swing
- +4.2pp toward D · 2008: 5.6pp · 2024: 9.8pp
- All cycles
- 2024: D+9.8 2020: D+18.2 2016: D+13.5 2012: D+4.6 2008: D+5.6
Not yet ingested
- Civics
- —
Market trends
- HPI YoY
- ▼ -52.06%
- Current HPI
- 265.2235
- Rent YoY
- ▼ -3.36%
- Metro
- San Antonio-New Braunfels, TX
- State GDP YoY
- ▲ 3.95%
- F500 in state
- 110
Industry mix (Fortune 500 HQ in TX)
| Industry | F500 HQs | Revenue |
|---|---|---|
| Energy | 16 | $1,198B |
|
||
| Technology | 5 | $198B |
|
||
| Engineering / Construction | 4 | $72B |
|
||
| Energy Services | 3 | $60B |
|
||
| Utilities | 3 | $41B |
|
||
| Healthcare | 2 | $330B |
|
||
Price history
+79.5% since first listed24 events — show timeline
- 2026-05-13 Price Changed $140,000 HARMLS
- 2026-05-04 Price Changed $145,000 HARMLS
- 2026-04-24 Price Changed $150,000 HARMLS
- 2026-04-10 Listed $155,000 HARMLS
- 2026-02-04 Listing Removed — LERA
- 2026-01-06 Relisted — LERA
- 2025-10-28 Pending — LERA
- 2025-09-11 Price Changed $159,000 LERA
- 2025-07-30 Listed $165,000 LERA
- 2022-06-01 Listing Removed — LERA
- 2022-05-17 Relisted — LERA
- 2022-05-04 Contingent — LERA
- 2022-03-26 Listed $205,000 LERA
- 2022-02-16 Price Changed $1,495 RENT.
- 2015-01-23 Sold (Public Records) — Public Records
- 2015-01-22 Sold (MLS) — LERA
- 2015-01-14 Pending — LERA
- 2015-01-04 Contingent — LERA
- 2014-12-19 Relisted — LERA
- 2014-12-09 Contingent — LERA
- 2014-12-04 Price Changed $74,900 LERA
- 2014-11-09 Listed $78,000 LERA
- 2004-09-14 Sold (Public Records) — Public Records
- 2000-11-02 Sold (Public Records) — Public Records
Property tax history
+5.4%/yrLatest (2025): $5,198 · +0.0% YoY. Source: county tax records.
Cash-flow waterfall
monthlySold comps — $/sqft
last 12 mo · ≤1 miLoading sold comps…