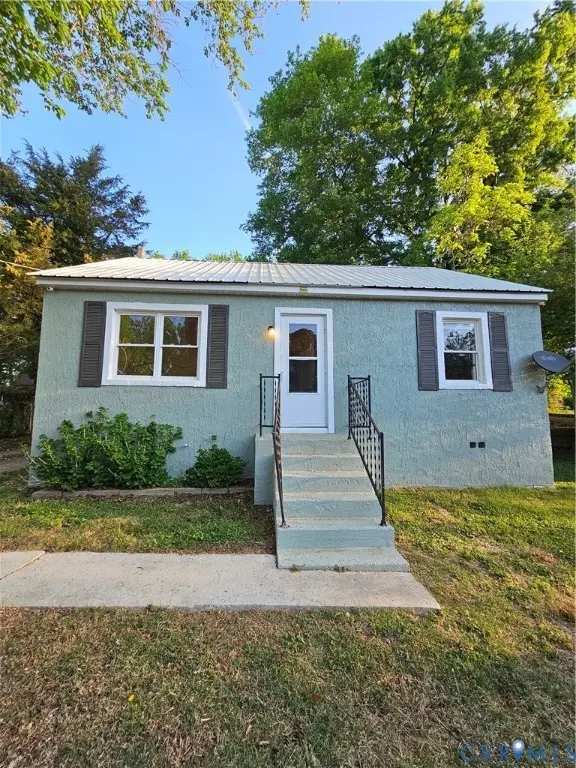
2702 Milhorn St · Chester, VA
Flood risk 1/10 · Minimal
- FEMA flood zone
- X (unshaded)
- Chance of flooding over 30 yrs
- 0.0%
- Est. flood insurance / yr
- $507 – $1,088
Fire risk 4/10 · Minor
- Est. fire insurance / yr
- $666 – $1,236
Heat risk 8/10 · Major
- Hot days now (above 108°F)
- 7 days/yr
- Hot days in 30 yrs
- 16 days/yr
Wind risk 6/10 · Moderate
- Chance of severe wind over 30 yrs
- 40.0%
Air-quality risk 2/10 · Minimal
- Unhealthy air days now
- 0 days/yr
- Unhealthy air days in 30 yrs
- 1 days/yr
Risk factors via First Street. Map © Google.
Why this score? — see what drove the C- grade
The composite is a weighted blend of 9 inputs, each scored 0–100. Each bar is that input's sub-score; the figure is the points it added to the 100-point composite (weight × sub-score).
- ARV discount +15.0/15.0
- Cash flow +13.8/30.0
- Schools +5.2/10.0
- Rent growth +4.4/5.0
- DSCR +4.2/10.0
- Livability +3.7/5.0
- 1% rule +3.1/10.0
- Condition / age +2.5/5.0
- Appreciation +0.0/10.0
$235,000
🖨 Deal sheet (PDF) 📄 Offer letter ✓ Due diligence
Listing remarks MLS
Charming newly renovated Cape Cod-style home in a great location! Situated on over a quarter of an acre, this property offers a peaceful setting with spacious front and back yards perfect for relaxing, entertaining, or enjoying nature. Inside, you'll find inviting living spaces filled with character and warmth, plus a finished attic that adds versatile bonus space for a bedroom, office, playroom, or retreat. A wonderful opportunity to enjoy comfort, charm, and convenience all in one. Ask about a package deal with another home in Chesterfield! * Seller financing available.
Key facts
- Cape cod-style home
- Finished attic
- Peaceful setting
Tags
Neighborhood map
What this means for you Summary
Snapshot
- This is a 3-bed/1.5-bath single-family listed at $235k.
Deal economics
- At list price, monthly cash flow is $21 ($250/yr) — positive.
- The deal already cash-flows at list — no discount required.
- To meet the 1% rule (rent ≥ 1% of price), the offer needs to be $190k (19.2% below list).
- Recommended offer: $190k (19.2% below list) — sets the bar for 1% rule.
- Cap rate 6.4% vs local median 3.6% in Chester — top-decile yield for the area; either an underpriced asset or a hidden risk that comps aren't pricing in. Stress-test before assuming the spread holds.
Location & tenants
- Location reads 73/100 on livability (#170 in VA) — a middle-class / working-renter tenant base. Strengths: housing A+, health & safety A+, schools A-; Watch: amenities F, commute F.
- Chesterfield County Public School District (suburban): math 52% / reading 64% proficiency, ranked #57 of 131 in VA (top 44%) — acceptable for families but not a draw, mixed tenant base, ~2y average lease.
- Market conditions: Rents rising fast (+7.5%/yr); 125 active listings in the ZIP; 2 comparable units currently listed for rent nearby; solid renter incomes; 2,307 units permitted in Chesterfield County in 2024 (462 in 5+ unit buildings).
Forward outlook
- Local home prices are declining (-3.0%/yr); year-one equity from $2k of loan paydown is wiped out by about $7k of value loss. Plan a longer hold.
- Chesterfield County population projected at +20% by 2050 — long-run rental-demand tailwind backs the buy-and-hold thesis.
Negotiation context
- It's been on market 17 days — a 2% lower offer ($231k) is reasonable based on typical stale-listing flexibility.
- 3 sale attempts since 21y ago; this cycle's ask is 18% above the opening price — seller raised mid-cycle; expect resistance to lowballs.
- Current owner paid $96k; list at $235k implies a 146% gain — meaningful room to come down on a strong offer.
Risks & watch-outs
- Watch-outs: built in 1957 — expect roof / HVAC / electrical / plumbing capex.
- Climate carrying-cost: major wind risk, 40% chance of damaging wind over 30y; extreme-heat days projected 7→16/yr by 2055 (HVAC capex compounding) — expect insurance premiums to compound above CPI over the hold.
Questions for the listing agent
- Built in 1957 — when were the roof, HVAC, electrical panel, plumbing, and water heater last replaced?
- Is there a deadline driving the sale (1031 exchange, divorce, estate, relocation)? That informs how much negotiation room exists.
- Schools are A-rated — typically a magnet for longer-tenancy family renters. What's the average tenant stay here, and is there a school-zone premium baked into asking?
- What's the average days-on-market for RENTAL listings here right now (not sales)? A rising rental-DOM trend means longer vacancies and softer asking-rent achievability than the comps imply.
- What's the recent tenant-quality profile in this submarket — average credit score on applications, eviction rate, late-payment / NSF rate, and stable-employment percentage? A property-management company in the area should have these aggregated.
- How much new for-sale + rental construction is in the pipeline within 1–3 miles? Heavy new supply typically softens prices + rents 12–24 months out; constrained supply supports both.
Investment metrics
- 1% rule
- 0.81% ✗
- Cap rate
- 6.40%
- Cash-on-cash
- 0.38%
- DSCR
- 1.02
- GRM
- 10.3
CMA / ARV
- ARV (median comp)
- $299,077
- List price
- $235,000
- Delta
- -21.42%
- Verdict
- UNDERPRICED
- Comps
- 20 within 1.0 mi
Show comp detail 12 sales within ~0.75 mi
| Address | Dist | Beds/Ba | Sqft | Sold | Price | $/sf | Match |
|---|---|---|---|---|---|---|---|
| 2702 Milhorn St | 0.00mi | 3/1.0 | 1,410 (0%) | 1mo | $227,000 | $161 | 98 |
| 2708 Tinstree Dr | 0.28mi | 3/2.0 | 1,368 (-3%) | 6mo | $262,000 | $192 | 75 |
| 15806 Roland View Dr | 0.36mi | 3/2.0 | 1,444 (+2%) | 9mo | $255,000 | $177 | 70 |
| 16117 Tipton Ct | 0.22mi | 4/2.0 (+1) | 1,320 (-6%) | 6mo | $312,000 | $236 | 67 |
| 15910 Gary Ave | 0.51mi | 4/2.0 (+1) | 1,436 (+2%) | 1mo | $307,000 | $214 | 65 |
| 15910 Hill St | 0.18mi | 4/2.5 (+1) | 1,568 (+11%) | 4mo | $352,000 | $224 | 61 |
| 3200 Sylvania Pl | 0.40mi | 4/2.0 (+1) | 1,512 (+7%) | 2mo | $340,000 | $225 | 61 |
| 15720 Timberline Dr | 0.17mi | 4/2.0 (+1) | 1,588 (+13%) | 4mo | $249,500 | $157 | 60 |
| 3105 Lalonde Dr | 0.39mi | 3/1.5 | 1,200 (-15%) | 8mo | $290,000 | $242 | 50 |
| 16100 Gary Ave | 0.56mi | 3/1.5 | 1,248 (-12%) | 10mo | $257,000 | $206 | 47 |
| 3043 Amherst Ridge Way | 0.73mi | 3/2.0 | 1,300 (-8%) | 11mo | $298,000 | $229 | 42 |
| 15601 Meridian Ave | 0.66mi | 3/2.0 | 1,592 (+13%) | 10mo | $325,989 | $205 | 38 |
Match score weights: distance 35% · size 25% · config 20% · recency 20%. Top-matched comps best support the ARV.
Projected returns pro-forma
-3.0% appreciation · 7.5% rent growth · sell at horizon
- IRR
- -11.2%
- Equity multiple
- 0.58×
- Total profit
- $-27,821
- Equity at exit
- $35,039
- IRR
- 3.2%
- Equity multiple
- 1.27×
- Total profit
- $17,736
- Equity at exit
- $20,319
Cash invested: $65,800 (down + closing). Projections, not guarantees.
Landlord ↔ Tenant lean methodology
- Overall (STATE)
- 55 Moderately Landlord-Leaning
- State Virginia
- 55 Moderately Landlord-Leaning · D+2
- County
- — inherits STATE
- City
- — inherits STATE
ZIP-level market 23834
- Rents YoY
- 7.5%
- Active inventory
- 125
- Price-to-rent
- 10.3×
Monthly cashflow live
- Estimated rent
- $1,900 medium interval (Pro) →
- Mortgage (P&I)
- −$1,232
- Tax from tax record
- −$150 /mo · $1,797/yr
- Insurance
- −$98
- HOA
- −$0
- Vacancy / Maint / Mgmt
- −$399
- Net cashflow
- $21
Break-even live
Sensitivity live
| Price | -10% $154 | -5% $87 | +0% $21 | +5% $-46 | +10% $-112 |
|---|---|---|---|---|---|
| Rent | -10% $-129 | -5% $-54 | +0% $21 | +5% $96 | +10% $171 |
| Rate | -1.0pp $139 | -0.5pp $81 | base $21 | +0.5pp $-40 | +1.0pp $-102 |
UW: 25.0% down · 7.5% · 30yr · 1.5% tax · 5.0% vac · 8.0% maint · 8.0% mgmt
Financing live
Cash to close
- Down payment
- $58,750
- Closing costs
- $7,050
- Reserves months
- —
- Total cash needed
- —
Loan-product check · same deal, 3 products live
Conventional
25% down · 7.5% · 30yr
- Down + closing
- —
- Monthly P&I
- —
- Monthly cashflow
- —
- DSCR
- —
- Eligible?
- —
Personal DTI + credit; lowest rate.
DSCR
20% down · 8.5% · 30yr
- Down + closing
- —
- Monthly P&I
- —
- Monthly cashflow
- —
- DSCR
- —
- Eligible?
- —
No personal income docs; deal must DSCR.
Hard money
10% down · 12.0% · 12mo
- Down + closing
- —
- Monthly P&I
- —
- Monthly cashflow
- —
- DSCR
- —
- Eligible?
- —
Short-term bridge; refi at stabilization.
Rent comps 2 comps
| Address | Beds | Baths | Sqft | Rent | $/sqft | DOM | Units | Dist |
|---|---|---|---|---|---|---|---|---|
| 16208 Pauline Ave Chester, VA | 4.0 | 2.0 | 1496 | $2,195 | $1.47 | 45d | 1 | 0.62mi |
| 15151 Timsberry Cir Chester, VA | 3.0–4.0 | 2.5 | 1586 | $1,598 | $1.01 | 3d | 30 | 0.90mi |
Listing history 9 events
-
2026-05-07status Pending 580-char remark
Show marketing remark (580 chars)
Charming newly renovated Cape Cod-style home in a great location! Situated on over a quarter of an acre, this property offers a peaceful setting with spacious front and back yards perfect for relaxing, entertaining, or enjoying nature. Inside, you'll find inviting living spaces filled with character and warmth, plus a finished attic that adds versatile bonus space for a bedroom, office, playroom, or retreat. A wonderful opportunity to enjoy comfort, charm, and convenience all in one. Ask about a package deal with another home in Chesterfield! * Seller financing available.
-
2026-04-24price $235,000 580-char remark
Show marketing remark (580 chars)
Charming newly renovated Cape Cod-style home in a great location! Situated on over a quarter of an acre, this property offers a peaceful setting with spacious front and back yards perfect for relaxing, entertaining, or enjoying nature. Inside, you'll find inviting living spaces filled with character and warmth, plus a finished attic that adds versatile bonus space for a bedroom, office, playroom, or retreat. A wonderful opportunity to enjoy comfort, charm, and convenience all in one. Ask about a package deal with another home in Chesterfield! * Seller financing available.
-
2026-04-20$199,950 Active 580-char remark
Show marketing remark (580 chars)
Charming newly renovated Cape Cod-style home in a great location! Situated on over a quarter of an acre, this property offers a peaceful setting with spacious front and back yards perfect for relaxing, entertaining, or enjoying nature. Inside, you'll find inviting living spaces filled with character and warmth, plus a finished attic that adds versatile bonus space for a bedroom, office, playroom, or retreat. A wonderful opportunity to enjoy comfort, charm, and convenience all in one. Ask about a package deal with another home in Chesterfield! * Seller financing available.
-
2005-02-18soldstatus $95,500
-
2005-02-17soldstatus $95,500 42-char remark
Show marketing remark (42 chars)
totally renovated. entered in MLS as comp.
-
2005-02-17soldstatus $95,500
Show marketing remark (42 chars)
totally renovated. entered in MLS as comp.
-
2005-01-10$95,500 42-char remark
Show marketing remark (42 chars)
totally renovated. entered in MLS as comp.
-
2005-01-10$95,500
Show marketing remark (42 chars)
totally renovated. entered in MLS as comp.
-
2004-04-01soldstatus $55,000
ⓘ Source: listings_history table (triggers on properties + properties_extension) + one-shot
backfill from property_details.listing_events for pre-trigger history.
Tax reassessment forecast VA · Resets to sale price
- Current annual tax
- $1,797 · $150/mo
- Projected year-2 tax
- $1,927 · $161/mo
- Expected delta
- +$130/yr (+$11/mo · 7.2%)
ⓘ Screening estimate from a state-policy table — verify with the county assessor before closing.
Climate risk First Street
- Flood 1/10 Low FEMA zone X (unshaded) · 0% chance over 30 yrs
- Wildfire 4/10 Moderate
- Heat 8/10 Severe 7 d/yr ≥108°F today · 16 d/yr by 30 yrs out
- Wind 6/10 Major 40% chance of damaging wind over 30 yrs
- Air quality 2/10 Low 0 unhealthy d/yr today · 1 by 30 yrs out
Nearby sold comps map
Loading sold comps map…
Walkable amenities ~0.75 mi
Loading nearby amenities…
Taxation est. · year 1
- Rental income
- $22,798
- − Mortgage interest
- −$13,164
- − Property taxes
- −$1,797
- − Insurance
- −$1,175
- − Repairs & maintenance
- −$1,824
- − Management
- −$1,824
- − Depreciation
- −$6,836
- Taxable loss
- −$3,822
- Est. tax savings @ 24.0%
- +$917
- After-tax cash flow
- $1,167/yr
For passive investors: Depreciation is non-cash, so a rental often shows a tax loss while cash-flowing — sheltering income. Rental losses are passive: they offset passive income freely, and up to $25,000/yr can offset ordinary (W-2) income if you actively participate and your MAGI is under $100k (phasing out to $0 by $150k); unused losses carry forward. On sale, claimed depreciation is recaptured at up to 25%, and gains may owe capital-gains tax (a 1031 exchange can defer both). Figures are a year-1 estimate at your 24.0% rate — not tax advice; consult a CPA.
Schools (NCES district)
- District
- Chesterfield County Public School District
- NCES district ID
- 5100840
- Math proficiency
- 52% ▼ -30.00%
- Reading proficiency
- 64% ▼ -15.00%
- Median HH income
- $72,821
- Composite
- 51.56/100
- National rank
- #1712
- State rank
- #57 of 131 in VA
Livability — Chester
- Score
- 73/100
- State rank
- #170
- US rank
- #5369
Category grades
Schools grade is shown separately in the Schools card above.
Census & demographics
- County
- Chesterfield County · 406,988 people
- City population
- 54,827
- Metro
- Richmond, VA
- Population (ZIP)
- 26,628
- Household income
- $84,338
- Rent vs Own
- Severe rent burden
- 814.0
Population outlook (Chesterfield County) Hauer SSP2
- Today (2025)
- 377,190 people
- By 2030
- 395,710 · +4.9%
- By 2040
- 427,694 · +13.4%
- By 2050
- 452,706 · +20.0%
- By 2075
- 505,533 · +34.0%
- By 2100
- 521,282 · +38.2%
Race, ethnicity, and origin ACS 2023
- Neighborhood character
- Majority White (63%)
- Race & ethnicity
- White 63% Black 22% Hispanic / Latino 8% Two or more races 5% Asian 3%
- Hispanic origin (detail)
- Mexican 3% Puerto Rican 3%
- Common ancestry
- Serbian 2% Slovak 2% Lithuanian 2%
- Foreign-born
- 7% · Canada, China, South Korea
- Languages at home
- 91% English-only · Spanish 5% Other Indo-European 2% Korean 1%
Political lean MEDSL · Chesterfield
- 2024 margin
- Lean D (+9.0) · D 53.8% · R 44.8% · Other 1.4%
- 2008→2024 swing
- +16.4pp toward D · 2008: -7.5pp · 2024: 9.0pp
- All cycles
- 2024: D+9.0 2020: D+6.7 2016: R+2.2 2012: R+7.1 2008: R+7.5
Not yet ingested
- Civics
- —
Market trends
- HPI YoY
- ▼ -212.28%
- Current HPI
- 294.4478
- Rent YoY
- ▲ 7.50%
- Metro
- Richmond, VA
- State GDP YoY
- ▲ 2.40%
- F500 in state
- 50
Industry mix (Fortune 500 HQ in VA)
| Industry | F500 HQs | Revenue |
|---|---|---|
| Aerospace / Defense | 4 | $236B |
|
||
| Technology / Defense | 3 | $32B |
|
||
| Financial Services | 2 | $176B |
|
||
| Utilities | 2 | $27B |
|
||
| Insurance | 2 | $25B |
|
||
| Technology | 2 | $15B |
|
||
Price history
+327.3% since first listed9 events — show timeline
- 2026-05-07 Pending — CVRMLS
- 2026-04-24 Price Changed $235,000 CVRMLS
- 2026-04-20 Listed $199,950 CVRMLS
- 2005-02-18 Sold (Public Records) $95,500 Public Records
- 2005-02-17 Sold (MLS) $95,500 CVRMLS
- 2005-02-17 Sold (MLS) $95,500 CVRMLS
- 2005-01-10 Listed $95,500 CVRMLS
- 2005-01-10 Listed $95,500 CVRMLS
- 2004-04-01 Sold (Public Records) $55,000 Public Records
Property tax history
+4.6%/yrLatest (2025): $1,797 · +0.4% YoY. Source: county tax records.
Cash-flow waterfall
monthlySold comps — $/sqft
last 12 mo · ≤1 miLoading sold comps…