 Fourplex
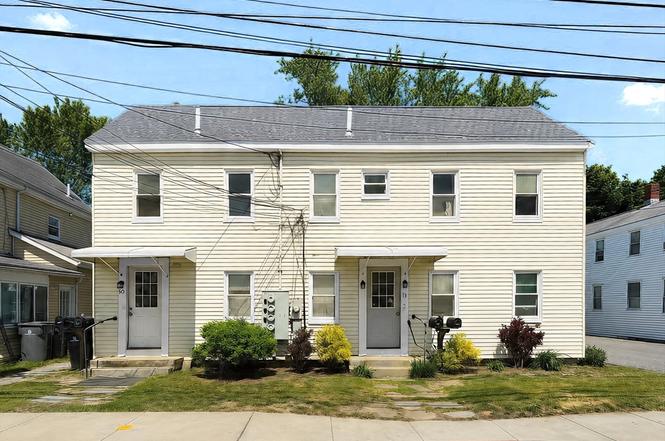
10 Learned St · Framingham, MA
Flood risk 1/10 · Minimal
- FEMA flood zone
- X (unshaded)
- Chance of flooding over 30 yrs
- 0.0%
- Est. flood insurance / yr
- $473 – $860
Fire risk 1/10 · Minimal
- Est. fire insurance / yr
- $915 – $1,699
Heat risk 5/10 · Moderate
- Hot days now (above 98°F)
- 7 days/yr
- Hot days in 30 yrs
- 15 days/yr
Wind risk 6/10 · Moderate
- Chance of severe wind over 30 yrs
- 51.0%
Air-quality risk 2/10 · Minimal
- Unhealthy air days now
- 1 days/yr
- Unhealthy air days in 30 yrs
- 2 days/yr
Risk factors via First Street. Map © Google.
Why this score? — see what drove the B- grade
The composite is a weighted blend of 9 inputs, each scored 0–100. Each bar is that input's sub-score; the figure is the points it added to the 100-point composite (weight × sub-score).
- Cash flow +30.0/30.0
- DSCR +10.0/10.0
- 1% rule +9.4/10.0
- ARV discount +7.5/15.0
- Livability +3.8/5.0
- Schools +3.0/10.0
- Condition / age +2.5/5.0
- Rent growth +2.0/5.0
- Appreciation +0.0/10.0
$899,000
🖨 Deal sheet 📄 Offer letter ✓ Due diligence
Multi-family units
County records classify this as Multi-Family (5+ Unit). Listing-text estimate: 4 units. estimate disagrees with records
5+ unit building — per-unit beds/baths from public records are typically unavailable; the breakdown below (if shown) is an estimate from the listing text.
Listing remarks MLS
Fabulous 4 family with a water view! Quiet street, yet walk to Metrowest Medical Center and Physician's offices, downtown T station, schools and more. Updated roof and windows. All tenants at will. Rents could be higher. Brokers, please do your due diligence.
Key facts
- Behind learned pond
- South north facing
- 4,356 sq ft lot
Tags
Property features AI
Finance
- HOA & community: Access to public transportation, shopping, walk/jog trails, medical facility, laundromat, conservation area, and T-Station
Exterior
- Parking: Open parking for 2 vehicles; Paved drive; Shared driveway; Off-street parking; Tandem parking; On-street parking
- Utilities: Public water; Public sewer; 200+ amp electric service
- Home design: 4-family building (4 side-by-side units); 4 stories
- Construction: Frame construction; Stone foundation; Shingle roof; Approximately built (year per public records)
- Exterior features: Enclosed patio/porch; Garden; Waterfront location with waterview; Public road frontage
Interior
- Kitchen: Range; Refrigerator; Freezer
- Flooring: Carpet; Hardwood; Wood
- Bathrooms: 4 full bathrooms
- Heating & cooling: Baseboard heating (natural gas); Window air conditioning units
- Interior features: Pantry; Bathroom with tub and shower; Living room; Kitchen; Office/Den; Dining room; Total of 21 rooms
Neighborhood map
What this means for you Summary
Snapshot
- This is a 4 × 5-bed/4.0-bath units multifamily listed at $899k.
Deal economics
- At list price, monthly cash flow is $4k ($52k/yr) — positive. Per door: $1k/mo.
- The deal already cash-flows at list — no discount required.
- Meets the 1% rule at list price ($13k rent vs $899k).
- Cap rate 12.1% vs local median 2.6% in Framingham — top-decile yield for the area; either an underpriced asset or a hidden risk that comps aren't pricing in. Stress-test before assuming the spread holds.
Location & tenants
- Location reads 76/100 on livability (#62 in MA, #3,443 nationally) — a middle-class / working-renter tenant base. Strengths: commute A+, employment A+, health & safety A+; Watch: schools C-, amenities F, cost of living F.
- Framingham (urban): math 26% / reading 38% proficiency, ranked #242 of 302 in MA (top 80%) — families likely to look elsewhere, expect single-tenant / working-renter base with shorter leases.
- Market conditions: Rents soft (-2.1%/yr); 41 active listings in the ZIP; solid renter incomes; 3,670 units permitted in Middlesex County in 2024 (2,611 in 5+ unit buildings).
- At $12,982/mo this rent would consume 189% of the median local household income ($82k/yr) (locally 2393% of renters already pay >50% of income on rent) — very limited rent-growth headroom before tenants either downsize or default.
Forward outlook
- Local home prices are declining (-3.0%/yr); year-one equity from $6k of loan paydown is wiped out by about $27k of value loss. Plan a longer hold.
- Middlesex County population projected at +20% by 2050 — long-run rental-demand tailwind backs the buy-and-hold thesis.
- At projected returns (-3.0% appreciation + 0.0% rent growth), your $252k cash investment doubles in ~8 years — after that, you're playing with house money.
Negotiation context
- Only 8 days on market — expect competitive offers; lowballing is unlikely to land.
- 2 sale attempts since 12y ago with the ask held roughly flat each time — persistent listings suggest the price (not the market) is what's stuck; bring a comps-based counter.
- Current owner paid $462k; list at $899k implies a 94% gain — meaningful room to come down on a strong offer.
Risks & watch-outs
- Watch-outs: built in 1867 — expect roof / HVAC / electrical / plumbing capex.
- Climate carrying-cost: major wind risk, 51% chance of damaging wind over 30y; extreme-heat days projected 7→15/yr by 2055 (HVAC capex compounding) — expect insurance premiums to compound above CPI over the hold.
Questions for the listing agent
- Can we see the unit-by-unit rent roll, current vacancy, and any below-market leases? What's the average tenancy length?
- What capital expenditures (roof, boiler, parking lot, exteriors) have been made in the last 5 years, and what's planned in the next 2?
- Built in 1867 — when were the roof, HVAC, electrical panel, plumbing, and water heater last replaced?
- Is there a deadline driving the sale (1031 exchange, divorce, estate, relocation)? That informs how much negotiation room exists.
- What's the average days-on-market for RENTAL listings here right now (not sales)? A rising rental-DOM trend means longer vacancies and softer asking-rent achievability than the comps imply.
- What's the recent tenant-quality profile in this submarket — average credit score on applications, eviction rate, late-payment / NSF rate, and stable-employment percentage? A property-management company in the area should have these aggregated.
- How much new apartment / multifamily construction is in the pipeline within 1–3 miles? Heavy new supply (>2% of stock underway) typically softens rents 12–24 months out; light construction supports rent growth.
Investment metrics
- 1% rule
- 1.44% ✓
- Cap rate
- 12.07%
- Cash-on-cash
- 20.65%
- DSCR
- 1.92
- GRM
- 5.8
CMA / ARV
No comps found within radius.
Projected returns pro-forma
-3.0% appreciation · 0.0% rent growth · sell at horizon
- IRR
- 9.6%
- Equity multiple
- 1.37×
- Total profit
- $92,135
- Equity at exit
- $134,044
- IRR
- 16.2%
- Equity multiple
- 2.15×
- Total profit
- $288,462
- Equity at exit
- $77,729
Cash invested: $251,720 (down + closing). Projections, not guarantees.
Landlord ↔ Tenant lean methodology
- Overall (STATE)
- 20 Strongly Tenant-Friendly
- State Massachusetts
- 20 Strongly Tenant-Friendly · D+15
- County
- — inherits STATE
- City
- — inherits STATE
ZIP-level market 01702
- Home prices YoY
- -29.8%
- Rents YoY
- -2.1%
- Active inventory
- 41
- Price-to-rent
- 23.1×
Monthly cashflow live
- Estimated rent
- $12,982 medium interval (Pro) →
- Mortgage (P&I)
- −$4,714
- Tax from tax record
- −$836 /mo · $10,030/yr
- Insurance
- −$375
- HOA
- −$0
- Vacancy / Maint / Mgmt
- −$2,726
- Net cashflow
- $4,331
Break-even live
4-unit breakdown (identical units grouped — click to expand)
| Units | Beds | Baths | Est. rent |
|---|---|---|---|
| 4× units | 5 | 4 | $12,980 |
| #1 | 5 | 4 | $3,245 |
| #2 | 5 | 4 | $3,245 |
| #3 | 5 | 4 | $3,245 |
| #4 | 5 | 4 | $3,245 |
| Total (4 units) | $12,982 | ||
UW: 25.0% down · 7.5% · 30yr · 1.5% tax · 5.0% vac · 8.0% maint · 8.0% mgmt
Financing live
Cash to close
- Down payment
- $224,750
- Closing costs
- $26,970
- Reserves months
- —
- Total cash needed
- —
Loan-product check · same deal, 3 products live
Conventional
25% down · 7.5% · 30yr
- Down + closing
- —
- Monthly P&I
- —
- Monthly cashflow
- —
- DSCR
- —
- Eligible?
- —
Personal DTI + credit; lowest rate.
DSCR
20% down · 8.5% · 30yr
- Down + closing
- —
- Monthly P&I
- —
- Monthly cashflow
- —
- DSCR
- —
- Eligible?
- —
No personal income docs; deal must DSCR.
Hard money
10% down · 12.0% · 12mo
- Down + closing
- —
- Monthly P&I
- —
- Monthly cashflow
- —
- DSCR
- —
- Eligible?
- —
Short-term bridge; refi at stabilization.
Listing history 7 events
-
2026-06-18days on market $899,000 Active 8 DOM
-
2026-06-17days on market $899,000 Active 7 DOM
-
2026-06-16days on market $899,000 Active 6 DOM
-
2026-06-15statusdays on market $899,000 Active 5 DOM
-
2026-06-13days on market $899,000 New 3 DOM
-
2026-06-13remarks 699-char remark
-
2026-06-13$899,000 New 2 DOM
ⓘ Source: listings_history table (triggers on properties + properties_extension) + one-shot
backfill from property_details.listing_events for pre-trigger history.
Tax reassessment forecast MA · Partial reset (capped growth)
- Current annual tax
- $10,030 · $836/mo
- Projected year-2 tax
- $10,544 · $879/mo
- Expected delta
- +$514/yr (+$43/mo · 5.1%)
ⓘ Screening estimate from a state-policy table — verify with the county assessor before closing.
Climate risk First Street
- Flood 1/10 Low FEMA zone X (unshaded) · 0% chance over 30 yrs
- Wildfire 1/10 Low
- Heat 5/10 Major 7 d/yr ≥98°F today · 15 d/yr by 30 yrs out
- Wind 6/10 Major 51% chance of damaging wind over 30 yrs
- Air quality 2/10 Low 1 unhealthy d/yr today · 2 by 30 yrs out
Nearby sold comps map
Loading sold comps map…
Walkable amenities ~0.75 mi
Loading nearby amenities…
Taxation est. · year 1
- Rental income
- $155,784
- − Mortgage interest
- −$50,358
- − Property taxes
- −$10,030
- − Insurance
- −$4,495
- − Repairs & maintenance
- −$12,463
- − Management
- −$12,463
- − Depreciation
- −$26,153
- Taxable income
- $39,823
- Est. tax owed @ 24.0%
- −$9,557
- After-tax cash flow
- $42,413/yr
For passive investors: Depreciation is non-cash, so a rental often shows a tax loss while cash-flowing — sheltering income. Rental losses are passive: they offset passive income freely, and up to $25,000/yr can offset ordinary (W-2) income if you actively participate and your MAGI is under $100k (phasing out to $0 by $150k); unused losses carry forward. On sale, claimed depreciation is recaptured at up to 25%, and gains may owe capital-gains tax (a 1031 exchange can defer both). Figures are a year-1 estimate at your 24.0% rate — not tax advice; consult a CPA.
Schools (NCES district)
- District
- Framingham
- NCES district ID
- 2504980
- Math proficiency
- 26% ▼ -14.00%
- Reading proficiency
- 38% ▼ -4.00%
- Median HH income
- $68,594
- Composite
- 29.59/100
- National rank
- #6481
- State rank
- #242 of 302 in MA
Livability — Framingham
- Score
- 76/100
- State rank
- #62
- US rank
- #3443
Category grades
Schools grade is shown separately in the Schools card above.
Census & demographics
- Census place
- Framingham, MA
- County
- Middlesex County · 1,437,704 people
- City population
- 72,407
- Metro
- Boston-Cambridge-Newton, MA-NH
- Population (ZIP)
- 39,789
- Household income
- $82,496
- Rent vs Own
- Severe rent burden
- 2393.0
Population outlook (Middlesex County) Hauer SSP2
- Today (2025)
- 1,740,269 people
- By 2030
- 1,817,187 · +4.4%
- By 2040
- 1,963,195 · +12.8%
- By 2050
- 2,087,461 · +20.0%
- By 2075
- 2,344,036 · +34.7%
- By 2100
- 2,383,776 · +37.0%
Race, ethnicity, and origin ACS 2023
- Neighborhood character
- Highly diverse neighborhood (Simpson 0.77)
- Race & ethnicity
- White 39% Hispanic / Latino 25% Two or more races 22% Black 8% Asian 6%
- Hispanic origin (detail)
- Puerto Rican 7% Dominican 3%
- Common ancestry
- Estonian 20% Lithuanian 2% Romanian 2%
- Foreign-born
- 41% · Canada, China, Jamaica
- Languages at home
- 43% English-only · Other Indo-European 26% Spanish 23% French/Haitian/Cajun 2%
Political lean MEDSL · Middlesex
- 2024 margin
- Solid D (+39.5) · D 68.5% · R 29.0% · Other 2.5%
- 2008→2024 swing
- +9.3pp toward D · 2008: 30.1pp · 2024: 39.5pp
- All cycles
- 2024: D+39.5 2020: D+45.2 2016: D+38.1 2012: D+26.9 2008: D+30.1
Not yet ingested
- Civics
- —
Market trends
- HPI YoY
- ▼ -165.85%
- Current HPI
- 391.2673
- Rent YoY
- ▼ -2.07%
- Metro
- Boston-Cambridge-Newton, MA-NH
- State GDP YoY
- ▲ 2.28%
- F500 in state
- 38
Industry mix (Fortune 500 HQ in MA)
| Industry | F500 HQs | Revenue |
|---|---|---|
| Technology | 3 | $17B |
|
||
| Insurance | 2 | $84B |
|
||
| Retail | 2 | $76B |
|
||
| Life Sciences | 1 | $43B |
|
||
| Energy Technology | 1 | $31B |
|
||
| Aerospace / Defense | 1 | $18B |
|
||
Price history
+49.9% since first listed5 events — show timeline
- 2026-06-10 Listed $899,000 MLS PIN
- 2015-02-11 Sold (MLS) $462,500 MLS PIN
- 2014-12-23 Contingent — MLS PIN
- 2014-12-17 Price Changed $499,900 MLS PIN
- 2014-10-18 Listed $599,900 MLS PIN
Property tax history
+5.1%/yrLatest (2025): $10,030 · +9.2% YoY. Source: county tax records.
Cash-flow waterfall
monthlySold comps — $/sqft
last 12 mo · ≤1 miLoading sold comps…