1500 S Diamondhead Blvd #134 · Crosby, TX
Flood risk 1/10 · Minimal
- FEMA flood zone
- X (unshaded)
- Chance of flooding over 30 yrs
- 0.0%
- Est. flood insurance / yr
- $507 – $1,088
Fire risk 3/10 · Minor
- Est. fire insurance / yr
- $1,222 – $2,270
Heat risk 9/10 · Severe
- Hot days now (above 110°F)
- 7 days/yr
- Hot days in 30 yrs
- 25 days/yr
Wind risk 9/10 · Severe
- Chance of severe wind over 30 yrs
- 99.0%
Air-quality risk 2/10 · Minimal
- Unhealthy air days now
- 2 days/yr
- Unhealthy air days in 30 yrs
- 2 days/yr
Risk factors via First Street. Map © Google.
Why this score? — see what drove the C grade
The composite is a weighted blend of 9 inputs, each scored 0–100. Each bar is that input's sub-score; the figure is the points it added to the 100-point composite (weight × sub-score).
- Cash flow +22.7/30.0
- 1% rule +10.0/10.0
- DSCR +7.3/10.0
- ARV discount +5.3/15.0
- Schools +3.5/10.0
- Livability +3.0/5.0
- Rent growth +2.9/5.0
- Condition / age +2.5/5.0
- Appreciation +0.0/10.0
$95,000
🖨 Deal sheet (PDF) 📄 Offer letter ✓ Due diligence
Listing remarks
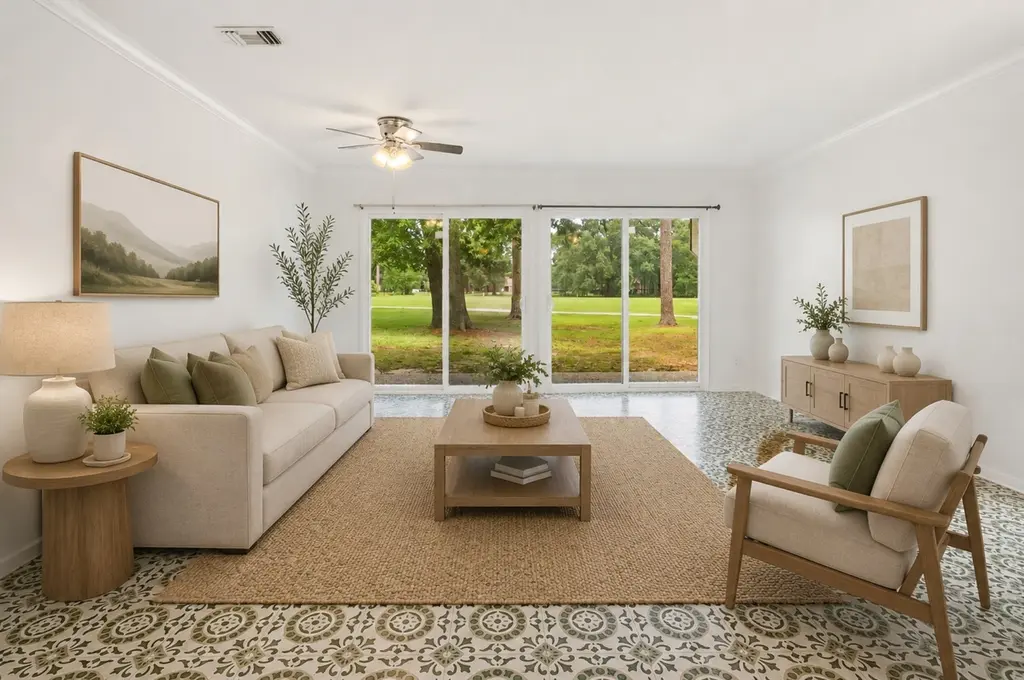
Welcome to this charming 2-bedroom, 2-bath condo located in the highly sought-after Newport golf course community in Crosby! Backing to the beautiful 18-hole golf course, this low-maintenance home offers peaceful views, a spacious layout, abundant natural light, and a unique brick accent wall that adds character to the living space. The primary suite features its own private en-suite bathroom for added comfort and convenience. Residents of Newport enjoy an active lifestyle with access to incredible amenities including parks, walking and hiking trails, lake and river access, tennis courts, splash pads, a fitness center, pool, and optional Country Club gym membership. Conveniently located nea
Key facts
- Brick accent wall
- Tennis courts
- Splash pads
Tags
Property features AI
Finance
- HOA & community: Newport HOA / Fairway Port POA; Monthly association fee; Association amenities include clubhouse, recreation facilities, golf course, and tennis courts
Exterior
- Parking: Additional parking; Assigned parking
- Utilities: Public water; Public sewer
- Home design: Residential property; Single-story; Entry level: First floor
- Construction: Built in 1974; Wood siding; Composition roof; Slab foundation
- Exterior features: Private yard; Lot measured in square feet
Interior
- Kitchen: Electric oven; Gas cooktop; Refrigerator
- Bedrooms: Primary bedroom on the first floor (approx. 14 x 11); Second bedroom on the first floor (approx. 11 x 11)
- Flooring: Laminate flooring; Tile flooring
- Bathrooms: 2 full bathrooms
- Heating & cooling: Central heating (electric and gas); Central air conditioning (electric and gas)
- Interior features: Common-area laundry access; Electric dryer hookup; Dryer; Washer
- Laundry & utility: Shared laundry area; Washer and dryer included
Neighborhood map
What this means for you Summary
Snapshot
- This is a 2-bed/2.0-bath condo listed at $95k.
Deal economics
- At list price, monthly cash flow is $163 ($2k/yr) — positive.
- The deal already cash-flows at list — no discount required.
- Meets the 1% rule at list price ($1k rent vs $95k).
- Recommended offer: $94k (1.5% below list) — sets the bar for market timing.
- Cap rate 8.4% vs local median 4.8% in Crosby — top-decile yield for the area; either an underpriced asset or a hidden risk that comps aren't pricing in. Stress-test before assuming the spread holds.
Location & tenants
- Location reads 59/100 on livability (#1,121 in TX) — a working-class tenant base; expect higher turnover. Strengths: cost of living A+, crime A, housing A; Watch: amenities F, commute F, employment F.
- Crosby ISD (rural): math 39% / reading 40% proficiency, ranked #369 of 826 in TX (top 45%) — families likely to look elsewhere, expect single-tenant / working-renter base with shorter leases.
- Zoned schools: Crosby Middle (math 36% / reading 37%, grade F, #786 of 1,662 statewide, top 48%, 1,549 students, 60% FRL); Highpoint School East (Crosby) (20 students, 80% FRL) — zoned schools average 70% FRL vs 50% district-wide (20 pts higher); higher-poverty schools than district average — tighter screening recommended.
- Market conditions: Rents rising (+1.5%/yr); 1172 active listings in the ZIP; 1 comparable units currently listed for rent nearby; solid renter incomes; 29,883 units permitted in Harris County in 2024 (8,621 in 5+ unit buildings).
Forward outlook
- Local home prices are declining (-3.0%/yr); year-one equity from $657 of loan paydown is wiped out by about $3k of value loss. Plan a longer hold.
- Harris County population projected at +47% by 2050 — long-run rental-demand tailwind backs the buy-and-hold thesis.
Negotiation context
- It's been on market 16 days — a 2% lower offer ($94k) is reasonable based on typical stale-listing flexibility.
- 11 sale attempts since 4y ago with the ask held roughly flat each time — persistent listings suggest the price (not the market) is what's stuck; bring a comps-based counter.
Risks & watch-outs
- Watch-outs: property tax is 2.5% of price.
- Climate carrying-cost: severe wind risk, 99% chance of damaging wind over 30y; extreme-heat days projected 7→25/yr by 2055 (HVAC capex compounding) — expect insurance premiums to compound above CPI over the hold.
Questions for the listing agent
- Built in 1974 — when were the roof, HVAC, electrical panel, plumbing, and water heater last replaced?
- Property tax is high relative to price — has the assessment been appealed recently, and will the sale trigger a re-assessment?
- What does the HOA fee cover, when was the last increase, and are there any pending special assessments or reserve-fund shortfalls?
- Any open or pending special assessments — roof, HVAC, plumbing, elevator, façade? What's the per-unit balance and payoff schedule, and is the seller paying it off at close or rolling it to the buyer?
- Is there a deadline driving the sale (1031 exchange, divorce, estate, relocation)? That informs how much negotiation room exists.
- Schools are D-rated, which usually means shorter tenancies and higher turnover. Who's the typical renter profile here, and what's been the actual vacancy rate?
- What's the average days-on-market for RENTAL listings here right now (not sales)? A rising rental-DOM trend means longer vacancies and softer asking-rent achievability than the comps imply.
- What's the recent tenant-quality profile in this submarket — average credit score on applications, eviction rate, late-payment / NSF rate, and stable-employment percentage? A property-management company in the area should have these aggregated.
- How much new apartment / multifamily construction is in the pipeline within 1–3 miles? Heavy new supply (>2% of stock underway) typically softens rents 12–24 months out; light construction supports rent growth.
Investment metrics
- 1% rule
- 1.56% ✓
- Cap rate
- 8.35%
- Cash-on-cash
- 7.35%
- DSCR
- 1.33
- GRM
- 5.3
CMA / ARV
- ARV (median comp)
- $90,662
- List price
- $95,000
- Delta
- 21.33%
- Verdict
- OVERPRICED
- Comps
- 8 within 1.0 mi
Projected returns pro-forma
-3.0% appreciation · 1.48% rent growth · sell at horizon
- IRR
- -7.3%
- Equity multiple
- 0.74×
- Total profit
- $-7,010
- Equity at exit
- $14,165
- IRR
- -0.4%
- Equity multiple
- 0.98×
- Total profit
- $-654
- Equity at exit
- $8,214
Cash invested: $26,600 (down + closing). Projections, not guarantees.
Landlord ↔ Tenant lean methodology
- Overall (STATE)
- 87 Strongly Landlord-Friendly
- State Texas
- 87 Strongly Landlord-Friendly · R+5
- County
- — inherits STATE
- City
- — inherits STATE
ZIP-level market 77532
- Home prices YoY
- -28.6%
- Rents YoY
- 1.5%
- Active inventory
- 1172
- Price-to-rent
- 5.3×
Monthly cashflow live
- Estimated rent
- $1,480 medium interval (Pro) →
- Mortgage (P&I)
- −$498
- Tax from tax record
- −$201 /mo · $2,407/yr
- Insurance
- −$40
- HOA
- −$268
- Vacancy / Maint / Mgmt
- −$311
- Net cashflow
- $163
Break-even live
Sensitivity live
| Price | -10% $217 | -5% $190 | +0% $163 | +5% $136 | +10% $109 |
|---|---|---|---|---|---|
| Rent | -10% $46 | -5% $104 | +0% $163 | +5% $221 | +10% $280 |
| Rate | -1.0pp $211 | -0.5pp $187 | base $163 | +0.5pp $138 | +1.0pp $113 |
UW: 25.0% down · 7.5% · 30yr · 1.5% tax · 5.0% vac · 8.0% maint · 8.0% mgmt
Financing live
Cash to close
- Down payment
- $23,750
- Closing costs
- $2,850
- Reserves months
- —
- Total cash needed
- —
Loan-product check · same deal, 3 products live
Conventional
25% down · 7.5% · 30yr
- Down + closing
- —
- Monthly P&I
- —
- Monthly cashflow
- —
- DSCR
- —
- Eligible?
- —
Personal DTI + credit; lowest rate.
DSCR
20% down · 8.5% · 30yr
- Down + closing
- —
- Monthly P&I
- —
- Monthly cashflow
- —
- DSCR
- —
- Eligible?
- —
No personal income docs; deal must DSCR.
Hard money
10% down · 12.0% · 12mo
- Down + closing
- —
- Monthly P&I
- —
- Monthly cashflow
- —
- DSCR
- —
- Eligible?
- —
Short-term bridge; refi at stabilization.
Rent comps 1 comps
| Address | Beds | Baths | Sqft | Rent | $/sqft | DOM | Units | Dist |
|---|---|---|---|---|---|---|---|---|
| 16700 Golf Club Dr Crosby, TX | 1.0–2.0 | 1.0–2.0 | 780 | $1,275 | $1.63 | 2d | 12 | 1.01mi |
HOA detail condo
- Monthly dues
- $268 · $3,216/yr
- Likely covers
- poolgym
- Assessments
- None detected in remarks — confirm with the listing agent.
Listing history 47 events
-
2026-06-18days on market $95,000 Active 16 DOM
-
2026-06-17days on market $95,000 Active 15 DOM
-
2026-06-16days on market $95,000 Active 14 DOM
-
2026-06-15days on market $95,000 Active 13 DOM
-
2026-06-13days on market $95,000 Active 11 DOM
-
2026-06-09days on market $95,000 Active 7 DOM
-
2026-06-08days on market $95,000 Active 6 DOM
-
2026-06-07days on market $95,000 Active 5 DOM
-
2026-06-04days on market $95,000 Active 2 DOM
-
2026-06-02pricedays on market $95,000 Active 1 DOM
-
2026-06-01days on market $110,000 Active 24 DOM
-
2026-05-31days on market $110,000 Active 23 DOM
-
2026-05-08$110,000 Active 855-char remark
-
2026-02-05historical
-
2025-09-26price $95,000
-
2025-08-14$115,000 Active
-
2025-07-18historical
-
2025-07-10price $124,500
-
2025-05-29price $125,000
-
2025-05-16price $127,000
-
2025-04-09price $128,500
-
2025-03-01$128,900 Active
-
2025-01-14historical
-
2025-01-13historical $1,650
-
2024-11-28$1,650
-
2024-11-28historical $1,500
-
2024-11-18price $121,000
-
2024-11-14price $124,900
-
2024-11-14status Active
-
2024-11-13$1,500
-
2024-11-06historical $1,500
-
2024-10-31historical
-
2024-10-29$1,500
-
2024-10-12$129,900 Active
-
2024-10-11historical
-
2023-05-15soldstatus
-
2023-05-09soldstatus Sold
-
2023-05-04status Pending, Continue to Show
-
2023-04-05status Pending
-
2023-03-31status Option Pending
-
2023-03-07$140,000 Active
-
2022-08-27historical
-
2022-08-02price $147,000
-
2022-07-18$157,000 Active
-
2021-06-08soldstatus
-
2012-12-17soldstatus
-
1989-08-02soldstatus
ⓘ Source: listings_history table (triggers on properties + properties_extension) + one-shot
backfill from property_details.listing_events for pre-trigger history.
Tax reassessment forecast TX · Resets to sale price
- Current annual tax
- $2,407 · $201/mo
- Projected year-2 tax
- $2,407 · $201/mo
- Expected delta
- $0/yr ($0/mo · 0.0%)
ⓘ Screening estimate from a state-policy table — verify with the county assessor before closing.
Climate risk First Street
- Flood 1/10 Low FEMA zone X (unshaded) · 0% chance over 30 yrs
- Wildfire 3/10 Moderate
- Heat 9/10 Extreme 7 d/yr ≥110°F today · 25 d/yr by 30 yrs out
- Wind 9/10 Extreme 99% chance of damaging wind over 30 yrs
- Air quality 2/10 Low 2 unhealthy d/yr today · 2 by 30 yrs out
Nearby sold comps map
Loading sold comps map…
Walkable amenities ~0.75 mi
Loading nearby amenities…
Taxation est. · year 1
- Rental income
- $17,761
- − Mortgage interest
- −$5,321
- − Property taxes
- −$2,407
- − Insurance
- −$475
- − Repairs & maintenance
- −$1,421
- − Management
- −$1,421
- − HOA
- −$3,216
- − Depreciation
- −$2,764
- Taxable income
- $736
- Est. tax owed @ 24.0%
- −$177
- After-tax cash flow
- $1,778/yr
For passive investors: Depreciation is non-cash, so a rental often shows a tax loss while cash-flowing — sheltering income. Rental losses are passive: they offset passive income freely, and up to $25,000/yr can offset ordinary (W-2) income if you actively participate and your MAGI is under $100k (phasing out to $0 by $150k); unused losses carry forward. On sale, claimed depreciation is recaptured at up to 25%, and gains may owe capital-gains tax (a 1031 exchange can defer both). Figures are a year-1 estimate at your 24.0% rate — not tax advice; consult a CPA.
Schools (NCES district)
- District
- Crosby ISD
- NCES district ID
- 4815750
- Math proficiency
- 39% ▼ -13.00%
- Reading proficiency
- 40% ▼ -5.00%
- Median HH income
- $61,079
- Composite
- 35.14/100
- National rank
- #5012
- State rank
- #369 of 826 in TX
Livability — Crosby
- Score
- 59/100
- State rank
- #1121
- US rank
- #19783
Category grades
Schools grade is shown separately in the Schools card above.
Census & demographics
- County
- Harris County · 4,702,590 people
- City population
- 33,780
- Metro
- Houston-The Woodlands-Sugar Land, TX
- Population (ZIP)
- 33,780
- Household income
- $92,201
- Rent vs Own
- Severe rent burden
- 382.0
Population outlook (Harris County) Hauer SSP2
- Today (2025)
- 5,571,493 people
- By 2030
- 6,089,821 · +9.3%
- By 2040
- 7,142,806 · +28.2%
- By 2050
- 8,185,864 · +46.9%
- By 2075
- 10,574,329 · +89.8%
- By 2100
- 12,109,958 · +117.4%
Race, ethnicity, and origin ACS 2023
- Neighborhood character
- Diverse neighborhood (Simpson 0.60)
- Race & ethnicity
- White 54% Hispanic / Latino 31% Two or more races 16% Black 9%
- Hispanic origin (detail)
- Mexican 24%
- Common ancestry
- Lithuanian 4% Romanian 3% Italian 2%
- Foreign-born
- 10% · Canada
- Languages at home
- 78% English-only · Spanish 21%
Political lean MEDSL · Harris
- 2024 margin
- Lean D (+5.5) · D 52.0% · R 46.4% · Other 1.6%
- 2008→2024 swing
- +3.9pp toward D · 2008: 1.6pp · 2024: 5.5pp
- All cycles
- 2024: D+5.5 2020: D+13.3 2016: D+12.4 2012: D+0.1 2008: D+1.6
Not yet ingested
- Civics
- —
Market trends
- HPI YoY
- ▼ -105.63%
- Current HPI
- 264.0126
- Rent YoY
- ▲ 1.48%
- Metro
- Houston-The Woodlands-Sugar Land, TX
- State GDP YoY
- ▲ 3.95%
- F500 in state
- 110
Industry mix (Fortune 500 HQ in TX)
| Industry | F500 HQs | Revenue |
|---|---|---|
| Energy | 16 | $1,198B |
|
||
| Technology | 5 | $198B |
|
||
| Engineering / Construction | 4 | $72B |
|
||
| Energy Services | 3 | $60B |
|
||
| Utilities | 3 | $41B |
|
||
| Healthcare | 2 | $330B |
|
||
Price history
-39.5% since first listed37 events — show timeline
- 2026-06-02 Listing Removed — HARMLS
- 2026-06-02 Listed $95,000 HARMLS
- 2026-05-08 Listed $110,000 HARMLS
- 2026-02-05 Listing Removed — HARMLS
- 2025-09-26 Price Changed $95,000 HARMLS
- 2025-08-14 Listed $115,000 HARMLS
- 2025-07-18 Listing Removed — HARMLS
- 2025-07-10 Price Changed $124,500 HARMLS
- 2025-05-29 Price Changed $125,000 HARMLS
- 2025-05-16 Price Changed $127,000 HARMLS
- 2025-04-09 Price Changed $128,500 HARMLS
- 2025-03-01 Listed $128,900 HARMLS
- 2025-01-14 Listing Removed — HARMLS
- 2025-01-13 Rental Removed $1,650 HARMLS
- 2024-11-28 Listed for Rent $1,650 HARMLS
- 2024-11-28 Rental Removed $1,500 RENTSPREE
- 2024-11-18 Price Changed $121,000 HARMLS
- 2024-11-14 Price Changed $124,900 HARMLS
- 2024-11-14 Relisted — HARMLS
- 2024-11-13 Listed for Rent $1,500 RENTSPREE
- 2024-11-06 Rental Removed $1,500 RENTSPREE
- 2024-10-31 Listing Removed — HARMLS
- 2024-10-29 Listed for Rent $1,500 RENTSPREE
- 2024-10-12 Listed $129,900 HARMLS
- 2024-10-11 Coming Soon — HARMLS
- 2023-05-15 Sold (Public Records) — Public Records
- 2023-05-09 Sold (MLS) — HARMLS
- 2023-05-04 Pending — HARMLS
- 2023-04-05 Pending — HARMLS
- 2023-03-31 Pending — HARMLS
- 2023-03-07 Listed $140,000 HARMLS
- 2022-08-27 Listing Removed — HARMLS
- 2022-08-02 Price Changed $147,000 HARMLS
- 2022-07-18 Listed $157,000 HARMLS
- 2021-06-08 Sold (Public Records) — Public Records
- 2012-12-17 Sold (Public Records) — Public Records
- 1989-08-02 Sold (Public Records) — Public Records
Property tax history
+8.2%/yrLatest (2025): $2,407 · -5.2% YoY. Source: county tax records.
Cash-flow waterfall
monthlySold comps — $/sqft
last 12 mo · ≤1 miLoading sold comps…