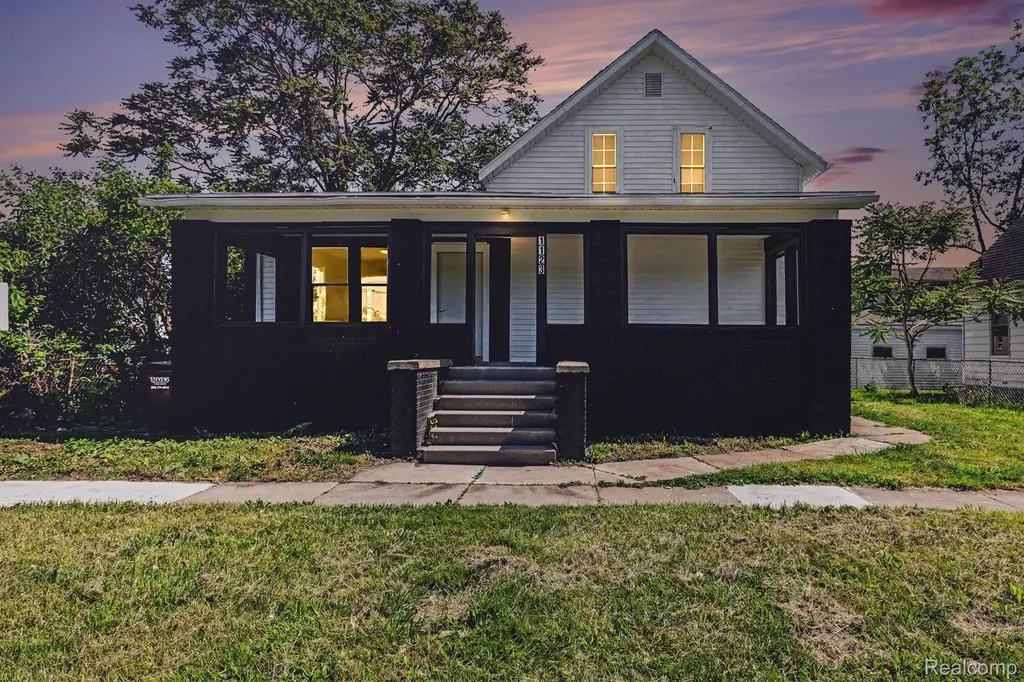
1123 E 1st St · Monroe, MI
Flood risk 1/10 · Minimal
- FEMA flood zone
- X (unshaded)
- Chance of flooding over 30 yrs
- 0.0%
- Est. flood insurance / yr
- $473 – $860
Fire risk 1/10 · Minimal
- Est. fire insurance / yr
- $784 – $1,456
Heat risk 3/10 · Minor
- Hot days now (above 101°F)
- 7 days/yr
- Hot days in 30 yrs
- 15 days/yr
Wind risk 2/10 · Minimal
- Chance of severe wind over 30 yrs
- —
Air-quality risk 4/10 · Minor
- Unhealthy air days now
- 3 days/yr
- Unhealthy air days in 30 yrs
- 6 days/yr
Risk factors via First Street. Map © Google.
Why this score? — see what drove the B- grade
The composite is a weighted blend of 9 inputs, each scored 0–100. Each bar is that input's sub-score; the figure is the points it added to the 100-point composite (weight × sub-score).
- Cash flow +26.0/30.0
- ARV discount +15.0/15.0
- DSCR +8.7/10.0
- 1% rule +5.9/10.0
- Livability +4.2/5.0
- Schools +3.0/10.0
- Rent growth +2.5/5.0
- Condition / age +2.5/5.0
- Appreciation +0.0/10.0
$155,000
🖨 Deal sheet (PDF) 📄 Offer letter ✓ Due diligence
Listing remarks MLS
Completely Remodeled & Move-In Ready! Welcome to 1123 E. 1st Street in Monroe, where timeless character meets modern updates. This spacious 4-bedroom, 2-bath home offers over 1,500 square feet of beautifully refreshed living space, blending the charm of a classic 1893 home with the comfort and style today's buyers demand. The striking exterior showcases a freshly updated enclosed front porch, creating outstanding curb appeal and a welcoming first impression. Inside, you'll find an open and inviting layout featuring generous living and dining areas, a large updated kitchen with abundant workspace, and four spacious bedrooms, including an expansive upper-level primary suite complete with its own full bath. The versatile floor plan provides flexibility for growing families, multi-generational living, home office needs, or guests. Recent renovations throughout the home create a truly turnkey opportunity, allowing the next owner to move in and immediately enjoy. Large windows fill the home with natural light, while the thoughtful updates enhance both functionality and style. The basement offers additional storage space, and the detached garage provides convenient parking and workshop potential. Located close to downtown Monroe, parks, schools, shopping, dining, and major commuter routes, this home delivers exceptional value with the space, updates, and character rarely found at this price point. A fantastic opportunity to own a completely remodeled 4-bedroom, 2-bath home that combines historic charm with modern living.
Key facts
- Versatile floor plan
- Detached garage
- 3,920 sq ft lot
Tags
Property features AI
Finance
- Other: Lot approximately 0.09 acres (54.5 x 75); Subdivision: STEWART AKA STUART
Exterior
- Parking: Detached 1-car garage
- Utilities: Public water; Public sewer
- Home design: Single-family residence; One and one-half stories; Ground-level entry with steps; Brick and vinyl siding exterior
- Construction: Asphalt roof; Block foundation; Built with brick and vinyl siding
- Exterior features: Covered patio/porch; Deck; Porch; Paved road access
Interior
- Bedrooms: One and one-half story layout (bedroom levels vary)
- Bathrooms: 2 full bathrooms
- Heating & cooling: Central air conditioning; Forced air heating; Natural gas heating
- Interior features: Unfinished basement; 7 total rooms
Neighborhood map
What this means for you Summary
Snapshot
- This is a 4-bed/2.0-bath single-family listed at $155k.
Deal economics
- At list price, monthly cash flow is $384 ($5k/yr) — positive.
- The deal already cash-flows at list — no discount required.
- Meets the 1% rule at list price ($2k rent vs $155k).
- Recommended offer: $153k (1.5% below list) — sets the bar for market timing.
- Cap rate 9.3% vs local median 4.0% in Monroe — top-decile yield for the area; either an underpriced asset or a hidden risk that comps aren't pricing in. Stress-test before assuming the spread holds.
Location & tenants
- Location reads 83/100 on livability (#51 in MI, #1,034 nationally) — a professional / high-income tenant draw. Strengths: commute A+, cost of living A+, housing A+; Watch: employment C-, crime D+, amenities D+.
- Monroe Public Schools (suburban): math 24% / reading 47% proficiency, ranked #278 of 540 in MI (top 52%) — families likely to look elsewhere, expect single-tenant / working-renter base with shorter leases.
- Market conditions: 142 active listings in the ZIP; 1 comparable units currently listed for rent nearby; 264 units permitted in Monroe County in 2024 (40 in 5+ unit buildings).
- This rent runs 30% of the median local income ($67k/yr) — at the standard rent-burdened threshold; future hikes will face affordability resistance.
Forward outlook
- Local home prices are declining (-3.0%/yr); year-one equity from $1k of loan paydown is wiped out by about $5k of value loss. Plan a longer hold.
- Monroe County population projected at -20% by 2050 — secular population decline; favor cash flow + early exit over multi-decade hold.
Negotiation context
- It's been on market 16 days — a 2% lower offer ($153k) is reasonable based on typical stale-listing flexibility.
- 8 sale attempts since 15y ago; this cycle's ask has dropped $25k (14%) from the opening price — seller is motivated, your offer sets the floor, not the list.
- Current owner paid $12k; list at $155k implies a 1181% gain — meaningful room to come down on a strong offer.
Risks & watch-outs
- Watch-outs: built in 1893 — expect roof / HVAC / electrical / plumbing capex.
Questions for the listing agent
- Built in 1893 — when were the roof, HVAC, electrical panel, plumbing, and water heater last replaced?
- Is there a deadline driving the sale (1031 exchange, divorce, estate, relocation)? That informs how much negotiation room exists.
- Schools are D-rated, which usually means shorter tenancies and higher turnover. Who's the typical renter profile here, and what's been the actual vacancy rate?
- Crime grade is D in this area — have there been break-ins, vandalism, or insurance claims at this property in the last 3 years? What carrier currently insures it and at what premium?
- What's the average days-on-market for RENTAL listings here right now (not sales)? A rising rental-DOM trend means longer vacancies and softer asking-rent achievability than the comps imply.
- What's the recent tenant-quality profile in this submarket — average credit score on applications, eviction rate, late-payment / NSF rate, and stable-employment percentage? A property-management company in the area should have these aggregated.
- How much new for-sale + rental construction is in the pipeline within 1–3 miles? Heavy new supply typically softens prices + rents 12–24 months out; constrained supply supports both.
Investment metrics
- 1% rule
- 1.09% ✓
- Cap rate
- 9.27%
- Cash-on-cash
- 10.62%
- DSCR
- 1.47
- GRM
- 7.6
CMA / ARV
- ARV (on-the-fly)
- $202,692
- Comps found
- 12
Show comp detail 12 sales within ~0.75 mi
| Address | Dist | Beds/Ba | Sqft | Sold | Price | $/sf | Match |
|---|---|---|---|---|---|---|---|
| 57 Navarre St | 0.42mi | 4/2.0 | 1,556 (+2%) | 6mo | $124,900 | $80 | 72 |
| 312 Navarre St | 0.47mi | 4/2.0 | 1,456 (-4%) | 4mo | $189,900 | $130 | 67 |
| 403 E 2nd St | 0.56mi | 5/2.0 (+1) | 1,504 (-1%) | 8mo | $200,000 | $133 | 61 |
| 405 E 5th St | 0.61mi | 3/1.5 (-1) | 1,515 (-1%) | 4mo | $125,000 | $83 | 60 |
| 438 Mason Run Blvd | 0.67mi | 3/2.0 (-1) | 1,528 (+0%) | 8mo | $262,909 | $172 | 57 |
| 419 Mason Run Blvd | 0.67mi | 3/2.0 (-1) | 1,528 (+0%) | 10mo | $277,288 | $181 | 55 |
| 480 Mason Run Blvd | 0.59mi | 3/2.5 (-1) | 1,572 (+3%) | 6mo | $263,135 | $167 | 55 |
| 422 E 1st St | 0.52mi | 4/2.0 | 1,728 (+13%) | 2mo | $179,900 | $104 | 51 |
| 515 E Elm St | 0.53mi | 3/1.5 (-1) | 1,651 (+8%) | 6mo | $132,000 | $80 | 49 |
| 116 Maple Blvd | 0.48mi | 3/1.5 (-1) | 1,300 (-15%) | 1mo | $246,000 | $189 | 46 |
| 323 Maple Blvd | 0.65mi | 3/1.0 (-1) | 1,422 (-7%) | 9mo | $191,000 | $134 | 42 |
| 934 Cherry St | 0.72mi | 5/2.0 (+1) | 1,700 (+12%) | 6mo | $165,000 | $97 | 37 |
Match score weights: distance 35% · size 25% · config 20% · recency 20%. Top-matched comps best support the ARV.
Projected returns pro-forma
-3.0% appreciation · 3.0% rent growth · sell at horizon
- IRR
- -0.4%
- Equity multiple
- 0.98×
- Total profit
- $-706
- Equity at exit
- $23,111
- IRR
- 9.2%
- Equity multiple
- 1.71×
- Total profit
- $30,690
- Equity at exit
- $13,402
Cash invested: $43,400 (down + closing). Projections, not guarantees.
Landlord ↔ Tenant lean methodology
- Overall (STATE)
- 62 Landlord-Friendly
- State Michigan
- 62 Landlord-Friendly · EVEN
- County
- — inherits STATE
- City
- — inherits STATE
ZIP-level market 48161
- Active inventory
- 142
- Price-to-rent
- 7.6×
Monthly cashflow live
- Estimated rent
- $1,694 medium interval (Pro) →
- Mortgage (P&I)
- −$813
- Tax from tax record
- −$77 /mo · $922/yr
- Insurance
- −$65
- HOA
- −$0
- Vacancy / Maint / Mgmt
- −$356
- Net cashflow
- $384
Break-even live
Sensitivity live
| Price | -10% $472 | -5% $428 | +0% $384 | +5% $340 | +10% $296 |
|---|---|---|---|---|---|
| Rent | -10% $250 | -5% $317 | +0% $384 | +5% $451 | +10% $518 |
| Rate | -1.0pp $462 | -0.5pp $423 | base $384 | +0.5pp $344 | +1.0pp $303 |
UW: 25.0% down · 7.5% · 30yr · 1.5% tax · 5.0% vac · 8.0% maint · 8.0% mgmt
Financing live
Cash to close
- Down payment
- $38,750
- Closing costs
- $4,650
- Reserves months
- —
- Total cash needed
- —
Loan-product check · same deal, 3 products live
Conventional
25% down · 7.5% · 30yr
- Down + closing
- —
- Monthly P&I
- —
- Monthly cashflow
- —
- DSCR
- —
- Eligible?
- —
Personal DTI + credit; lowest rate.
DSCR
20% down · 8.5% · 30yr
- Down + closing
- —
- Monthly P&I
- —
- Monthly cashflow
- —
- DSCR
- —
- Eligible?
- —
No personal income docs; deal must DSCR.
Hard money
10% down · 12.0% · 12mo
- Down + closing
- —
- Monthly P&I
- —
- Monthly cashflow
- —
- DSCR
- —
- Eligible?
- —
Short-term bridge; refi at stabilization.
Rent comps 1 comps
| Address | Beds | Baths | Sqft | Rent | $/sqft | DOM | Units | Dist |
|---|---|---|---|---|---|---|---|---|
| 505 Harrison St Monroe, MI | 3.0 | 2.0 | 1188 | $1,600 | $1.35 | 44d | 1 | 1.04mi |
Listing history 12 events
-
2026-06-19days on market $155,000 Active 16 DOM
-
2026-06-18days on market $155,000 Active 15 DOM
-
2026-06-17days on market $155,000 Active 14 DOM
-
2026-06-16days on market $155,000 Active 13 DOM
-
2026-06-15pricedays on market $155,000 Active 12 DOM
-
2026-06-14days on market $169,900 Active 10 DOM
-
2026-06-12days on market $169,900 Active 9 DOM
-
2026-06-09days on market $169,900 Active 6 DOM
-
2026-06-08days on market $169,900 Active 5 DOM
-
2026-06-07pricedays on market $169,900 Active 4 DOM
-
2026-06-05remarks 695-char remark
-
2026-06-05$179,900 Active 1 DOM
ⓘ Source: listings_history table (triggers on properties + properties_extension) + one-shot
backfill from property_details.listing_events for pre-trigger history.
Tax reassessment forecast MI · Partial reset (capped growth)
- Current annual tax
- $922 · $77/mo
- Projected year-2 tax
- $1,654 · $138/mo
- Expected delta
- +$733/yr (+$61/mo · 79.5%)
ⓘ Screening estimate from a state-policy table — verify with the county assessor before closing.
Climate risk First Street
- Flood 1/10 Low FEMA zone X (unshaded) · 0% chance over 30 yrs
- Wildfire 1/10 Low
- Heat 3/10 Moderate 7 d/yr ≥101°F today · 15 d/yr by 30 yrs out
- Wind 2/10 Low
- Air quality 4/10 Moderate 3 unhealthy d/yr today · 6 by 30 yrs out
Nearby sold comps map
Loading sold comps map…
Walkable amenities ~0.75 mi
Loading nearby amenities…
Taxation est. · year 1
- Rental income
- $20,328
- − Mortgage interest
- −$8,682
- − Property taxes
- −$922
- − Insurance
- −$775
- − Repairs & maintenance
- −$1,626
- − Management
- −$1,626
- − Depreciation
- −$4,509
- Taxable income
- $2,187
- Est. tax owed @ 24.0%
- −$525
- After-tax cash flow
- $4,083/yr
For passive investors: Depreciation is non-cash, so a rental often shows a tax loss while cash-flowing — sheltering income. Rental losses are passive: they offset passive income freely, and up to $25,000/yr can offset ordinary (W-2) income if you actively participate and your MAGI is under $100k (phasing out to $0 by $150k); unused losses carry forward. On sale, claimed depreciation is recaptured at up to 25%, and gains may owe capital-gains tax (a 1031 exchange can defer both). Figures are a year-1 estimate at your 24.0% rate — not tax advice; consult a CPA.
Schools (NCES district)
- District
- Monroe Public Schools
- NCES district ID
- 2624150
- Math proficiency
- 24% ▲ 3.00%
- Reading proficiency
- 47% ▲ 12.00%
- Median HH income
- $46,437
- Composite
- 30.33/100
- National rank
- #6269
- State rank
- #278 of 540 in MI
Livability — Monroe
- Score
- 83/100
- State rank
- #51
- US rank
- #1034
Category grades
Schools grade is shown separately in the Schools card above.
Census & demographics
- Census place
- Monroe, MI
- County
- Monroe County · 54,460 people
- City population
- 54,460
- Metro
- Monroe, MI
- Population (ZIP)
- 26,304
- Household income
- $67,414
- Rent vs Own
- Severe rent burden
- 733.0
Population outlook (Monroe County) Hauer SSP2
- Today (2025)
- 144,439 people
- By 2030
- 140,033 · -3.1%
- By 2040
- 128,408 · -11.1%
- By 2050
- 115,024 · -20.4%
- By 2075
- 87,273 · -39.6%
- By 2100
- 63,110 · -56.3%
Race, ethnicity, and origin ACS 2023
- Neighborhood character
- Predominantly White (85%)
- Race & ethnicity
- White 85% Two or more races 7% Black 5% Hispanic / Latino 5%
- Common ancestry
- Lithuanian 10% Romanian 8% Italian 2%
- Foreign-born
- 3% · Canada, Jamaica
- Languages at home
- 96% English-only · Spanish 2% Other Indo-European 1% Arabic 1%
Political lean MEDSL · Monroe
- 2024 margin
- Strong R (+27.1) · D 35.7% · R 62.9% · Other 1.4%
- 2008→2024 swing
- -31.5pp toward R · 2008: 4.3pp · 2024: -27.1pp
- All cycles
- 2024: R+27.1 2020: R+22.6 2016: R+22.1 2012: D+1.0 2008: D+4.3
Not yet ingested
- Civics
- —
Market trends
- HPI YoY
- ▼ -178.99%
- Current HPI
- 126.2638
- Rent YoY
- —
- Metro
- Monroe, MI
- State GDP YoY
- ▲ 1.37%
- F500 in state
- 28
Industry mix (Fortune 500 HQ in MI)
| Industry | F500 HQs | Revenue |
|---|---|---|
| Automotive Parts | 3 | $48B |
|
||
| Automotive | 2 | $372B |
|
||
| Chemicals | 1 | $45B |
|
||
| Automotive Retail | 1 | $29B |
|
||
| Healthcare / Medical Devices | 1 | $23B |
|
||
| Automotive Technology | 1 | $20B |
|
||
Price history
+350.9% since first listed15 events — show timeline
- 2026-06-03 Listed $179,900 REALCOMP
- 2026-06-03 Listed $179,900 MiRealSource-MiMLS
- 2012-10-01 Listing Removed — REALCOMP
- 2012-10-01 Listing Removed — MiRealSource-MiMLS
- 2012-08-21 Listed $39,900 REALCOMP
- 2012-08-21 Listed $39,900 MiRealSource-MiMLS
- 2012-05-09 Sold (MLS) $12,100 MiRealSource-MiMLS
- 2012-05-09 Sold (MLS) $12,100 REALCOMP
- 2012-04-20 Listing Removed — MiRealSource-MiMLS
- 2011-08-24 Listing Removed — REALCOMP
- 2011-08-24 Listing Removed — MiRealSource-MiMLS
- 2011-07-06 Listed $39,900 REALCOMP
- 2011-07-06 Listed $39,900 MiRealSource-MiMLS
- 2011-07-06 Listed $39,900 MiRealSource-MiMLS
- 2011-07-06 Listed — REALCOMP
Property tax history
+3.4%/yrLatest (2025): $922 · -34.5% YoY. Source: county tax records.
Cash-flow waterfall
monthlySold comps — $/sqft
last 12 mo · ≤1 miLoading sold comps…