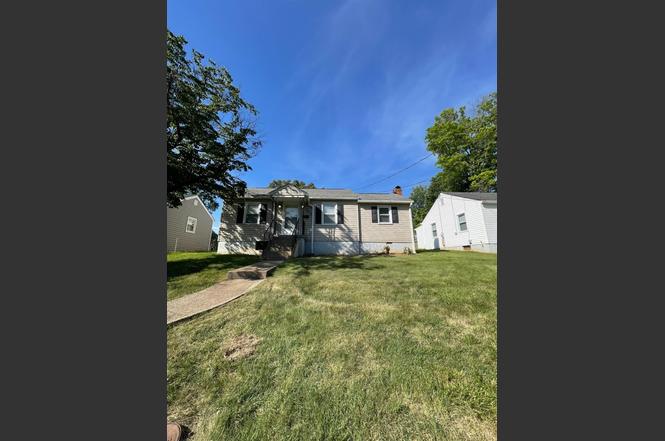
207 College Dr · Lynchburg, VA
Flood risk 1/10 · Minimal
- FEMA flood zone
- X (unshaded)
- Chance of flooding over 30 yrs
- 0.0%
- Est. flood insurance / yr
- $473 – $860
Fire risk 2/10 · Minimal
- Est. fire insurance / yr
- $666 – $1,236
Heat risk 6/10 · Moderate
- Hot days now (above 102°F)
- 7 days/yr
- Hot days in 30 yrs
- 18 days/yr
Wind risk 2/10 · Minimal
- Chance of severe wind over 30 yrs
- 3.0%
Air-quality risk 2/10 · Minimal
- Unhealthy air days now
- 0 days/yr
- Unhealthy air days in 30 yrs
- 1 days/yr
Risk factors via First Street. Map © Google.
Why this score? — see what drove the C- grade
The composite is a weighted blend of 9 inputs, each scored 0–100. Each bar is that input's sub-score; the figure is the points it added to the 100-point composite (weight × sub-score).
- ARV discount +15.0/15.0
- Cash flow +13.1/30.0
- Livability +4.5/5.0
- Schools +4.0/10.0
- DSCR +3.9/10.0
- Condition / age +3.8/5.0
- 1% rule +3.7/10.0
- Rent growth +2.8/5.0
- Appreciation +0.0/10.0
$134,900
🖨 Deal sheet (PDF) 📄 Offer letter ✓ Due diligence
Listing remarks
Welcome to 207 College Drive! A nicely updated home in a great location! This home features two bedroom and one bath, with an extra room that could be used as a third bedroom. This would make a great starter home, or a rental opportunity. Call today to schedule your showing!
Key facts
- 6,251 sq ft lot
- Built 1946
- Listed 6 days
Property features AI
Finance
- Other: Lot size about 0.1435 acres; Zoning: R2
Exterior
- Parking: Off-street parking
- Utilities: Public water; Public sewer
- Home design: Single-family residence; 1 story; Residential property
- Construction: Vinyl siding
- Exterior features: Shingle roof
Interior
- Kitchen: Electric range; Refrigerator
- Flooring: Vinyl flooring
- Bathrooms: 1 full bathroom
- Heating & cooling: Heat pump; Has heating
- Interior features: Fireplace in the living room; Partial basement
- Laundry & utility: Main level laundry room; Electric water heater
Neighborhood map
What this means for you Summary
Snapshot
- This is a 2-bed/1.0-bath single-family listed at $135k. Condition is rated good.
Deal economics
- At list price, monthly cash flow is $-5 ($-62/yr) — negative.
- To cash-flow at today's rent, offer at most $134k (0.6% below list).
- To meet the 1% rule (rent ≥ 1% of price), the offer needs to be $117k (13.0% below list).
- Recommended offer: $117k (13.0% below list) — sets the bar for 1% rule.
- Cap rate 6.2% vs local median 4.0% in Lynchburg — top-decile yield for the area; either an underpriced asset or a hidden risk that comps aren't pricing in. Stress-test before assuming the spread holds.
Location & tenants
- Location reads 91/100 on livability (#1 in VA, #58 nationally) — a professional / high-income tenant draw. Strengths: amenities A+, commute A+, cost of living A+; Watch: crime C-, employment D+.
- Lynchburg City Public School District (urban): math 36% / reading 61% proficiency, ranked #104 of 131 in VA (top 79%) — families likely to look elsewhere, expect single-tenant / working-renter base with shorter leases; 61% free/reduced lunch — lower-income household profile, screen leases tightly.
- Zoned schools: Perrymont Elementary (math 27% / reading 42%, grade F, #966 of 1,108 statewide, top 89%, 337 students, 95% FRL); Paul Laurence Dunbar Middle For Innovation (math 37% / reading 66%, grade C, #222 of 342 statewide, top 65%, 531 students, 95% FRL); E.C. Glass High (math 42% / reading 84%, grade B-, #223 of 319 statewide, top 70%, 1,325 students, 92% FRL) — zoned schools average 94% FRL vs 61% district-wide (33 pts higher); higher-poverty schools than district average — tighter screening recommended.
- Market conditions: Rents rising (+1.1%/yr); 221 active listings in the ZIP; 27 comparable units currently listed for rent nearby; rentals at typical pace (median 23d on market — plan ~3-4 weeks tenant-placement turnaround); 41% of comp listings sitting > 30 days — soft ceiling on asking rent; lower-income renter base — watch delinquency; 472 units permitted in Lynchburg city in 2024 (240 in 5+ unit buildings).
- This rent runs 33% of the median local income ($42k/yr) — at the standard rent-burdened threshold; future hikes will face affordability resistance.
Forward outlook
- Local home prices are declining (-3.0%/yr); year-one equity from $933 of loan paydown is wiped out by about $4k of value loss. Plan a longer hold.
- Lynchburg County population projected at +37% by 2050 — long-run rental-demand tailwind backs the buy-and-hold thesis.
Negotiation context
- Only 6 days on market — expect competitive offers; lowballing is unlikely to land.
Risks & watch-outs
- Watch-outs: built in 1946 — expect roof / HVAC / electrical / plumbing capex.
- Climate carrying-cost: extreme-heat days projected 7→18/yr by 2055 (HVAC capex compounding) — expect insurance premiums to compound above CPI over the hold.
Questions for the listing agent
- What do current leases actually rent for vs. the listed asking? Can we see a recent rent roll and the last 12 months of T-12 income?
- Built in 1946 — when were the roof, HVAC, electrical panel, plumbing, and water heater last replaced?
- Is there a deadline driving the sale (1031 exchange, divorce, estate, relocation)? That informs how much negotiation room exists.
- Schools are A-rated — typically a magnet for longer-tenancy family renters. What's the average tenant stay here, and is there a school-zone premium baked into asking?
- What's the average days-on-market for RENTAL listings here right now (not sales)? A rising rental-DOM trend means longer vacancies and softer asking-rent achievability than the comps imply.
- What's the recent tenant-quality profile in this submarket — average credit score on applications, eviction rate, late-payment / NSF rate, and stable-employment percentage? A property-management company in the area should have these aggregated.
- How much new for-sale + rental construction is in the pipeline within 1–3 miles? Heavy new supply typically softens prices + rents 12–24 months out; constrained supply supports both.
Investment metrics
- 1% rule
- 0.87% ✗
- Cap rate
- 6.25%
- Cash-on-cash
- -0.17%
- DSCR
- 0.99
- GRM
- 9.6
CMA / ARV
- ARV (on-the-fly)
- $177,282
- Comps found
- 12
Show comp detail 12 sales within ~0.75 mi
| Address | Dist | Beds/Ba | Sqft | Sold | Price | $/sf | Match |
|---|---|---|---|---|---|---|---|
| 209 College Dr | 0.01mi | 3/1.0 (+1) | 853 (-3%) | 3mo | $154,900 | $182 | 86 |
| 3400 College Dr | 0.15mi | 2/1.0 | 802 (-9%) | 6mo | $169,900 | $212 | 73 |
| 490 Oakley Ave | 0.44mi | 2/1.0 | 896 (+2%) | 7mo | $155,000 | $173 | 71 |
| 411 Newberne St | 0.42mi | 2/2.0 | 927 (+5%) | 2mo | $200,000 | $216 | 66 |
| 3428 Richmond St. St | 0.33mi | 2/1.0 | 986 (+12%) | 1mo | $161,800 | $164 | 64 |
| 3211 Richmond St | 0.30mi | 2/1.0 | 755 (-14%) | 2mo | $179,900 | $238 | 60 |
| 1012 N Grand Ave | 0.74mi | 2/1.0 | 884 (+0%) | 8mo | $149,900 | $170 | 59 |
| 1200 Brandon Rd | 0.68mi | 2/1.0 | 846 (-4%) | 6mo | $169,900 | $201 | 57 |
| 3508 Joel St | 0.47mi | 2/1.0 | 786 (-11%) | 8mo | $190,000 | $242 | 53 |
| 701 Mansfield Ave | 0.72mi | 3/2.0 (+1) | 910 (+3%) | 5mo | $182,000 | $200 | 48 |
| 612 Sussex St St | 0.63mi | 3/1.0 (+1) | 989 (+12%) | 2mo | $189,900 | $192 | 44 |
| 1715 Moormans Rd | 0.66mi | 2/1.5 | 986 (+12%) | 7mo | $199,900 | $203 | 42 |
Match score weights: distance 35% · size 25% · config 20% · recency 20%. Top-matched comps best support the ARV.
Projected returns pro-forma
-3.0% appreciation · 1.15% rent growth · sell at horizon
- IRR
- -18.7%
- Equity multiple
- 0.36×
- Total profit
- $-24,318
- Equity at exit
- $20,114
- IRR
- -15.3%
- Equity multiple
- 0.21×
- Total profit
- $-30,011
- Equity at exit
- $11,664
Cash invested: $37,772 (down + closing). Projections, not guarantees.
Landlord ↔ Tenant lean methodology
- Overall (STATE)
- 55 Moderately Landlord-Leaning
- State Virginia
- 55 Moderately Landlord-Leaning · D+2
- County
- — inherits STATE
- City
- — inherits STATE
ZIP-level market 24501
- Rents YoY
- 1.1%
- Active inventory
- 221
- Price-to-rent
- 9.6×
Monthly cashflow live
- Estimated rent
- $1,173 high interval (Pro) →
- Mortgage (P&I)
- −$707
- Tax est. 1.5%
- −$169 /mo · $2,024/yr
- Insurance
- −$56
- HOA
- −$0
- Vacancy / Maint / Mgmt
- −$246
- Net cashflow
- $-5
Break-even live
Sensitivity live
| Price | -10% $88 | -5% $41 | +0% $-5 | +5% $-52 | +10% $-98 |
|---|---|---|---|---|---|
| Rent | -10% $-98 | -5% $-52 | +0% $-5 | +5% $41 | +10% $87 |
| Rate | -1.0pp $63 | -0.5pp $29 | base $-5 | +0.5pp $-40 | +1.0pp $-76 |
UW: 25.0% down · 7.5% · 30yr · 1.5% tax · 5.0% vac · 8.0% maint · 8.0% mgmt
Financing live
Cash to close
- Down payment
- $33,725
- Closing costs
- $4,047
- Reserves months
- —
- Total cash needed
- —
Loan-product check · same deal, 3 products live
Conventional
25% down · 7.5% · 30yr
- Down + closing
- —
- Monthly P&I
- —
- Monthly cashflow
- —
- DSCR
- —
- Eligible?
- —
Personal DTI + credit; lowest rate.
DSCR
20% down · 8.5% · 30yr
- Down + closing
- —
- Monthly P&I
- —
- Monthly cashflow
- —
- DSCR
- —
- Eligible?
- —
No personal income docs; deal must DSCR.
Hard money
10% down · 12.0% · 12mo
- Down + closing
- —
- Monthly P&I
- —
- Monthly cashflow
- —
- DSCR
- —
- Eligible?
- —
Short-term bridge; refi at stabilization.
Rent comps 27 comps
| Address | Beds | Baths | Sqft | Rent | $/sqft | DOM | Units | Dist |
|---|---|---|---|---|---|---|---|---|
| 202 Macon St Lynchburg, VA | 2.0 | 1.0 | 645 | $1,195 | $1.85 | 45d | 1 | 0.12mi |
| 540 Monticello Ave Unit B Lynchburg, VA | 2.0 | 1.0 | 900 | $995 | $1.11 | 23d | 1 | 0.26mi |
| 106 Yeardley Ave Unit B Lynchburg, VA | 3.0 | 1.0 | 1060 | $895 | $0.84 | 23d | 1 | 0.54mi |
| 1218 Shirley Rd Lynchburg, VA | 2.0 | 1.0 | 742 | $950 | $1.28 | 23d | 1 | 0.62mi |
| 803 Mansfield Ave Lynchburg, VA | 2.0 | 1.0 | 900 | $1,300 | $1.44 | 23d | 1 | 0.69mi |
| 216 Kenyon St Lynchburg, VA | 2.0 | 1.0 | 1114 | $995 | $0.89 | 45d | 1 | 0.74mi |
| 2121 Langhorne Rd Unit 1103756SF 1BR/1BA Lynchburg, VA | 1.0 | 1.0 | 756 | $1,225 | $1.62 | 23d | 1 | 0.75mi |
| 2121 Langhorne Rd Unit 11041092SF 2BR/2BA Lynchburg, VA | 2.0 | 2.0 | 1092 | $1,495 | $1.37 | 23d | 1 | 0.75mi |
| 2245 Landover Pl Lynchburg, VA | 1.0–3.0 | 1.0–1.5 | 925 | $870 | $0.94 | 45d | 2 | 0.77mi |
| 2121 Langhorne Rd Lynchburg, VA | 1.0 | 1.0 | 983 | $1,475 | $1.50 | 45d | 1 | 0.78mi |
| 905 Centerdale St Lynchburg, VA | 2.0 | 1.0 | 780 | $895 | $1.15 | 15d | 1 | 0.86mi |
| 318 Wadsworth St Lynchburg, VA | 3.0 | 1.0 | 943 | $995 | $1.06 | 23d | 1 | 0.89mi |
| 317 Grove St Unit A Lynchburg, VA | 2.0 | 1.0 | 900 | $895 | $0.99 | 45d | 1 | 0.91mi |
| 2734 Fort Ave Lynchburg, VA | 1.0–2.0 | 1.0–2.0 | 875 | $1,450 | $1.66 | 45d | 1 | 0.96mi |
| 4067 Fort Ave Unit 3 Lynchburg, VA | 2.0 | 1.0 | 950 | $995 | $1.05 | 23d | 1 | 0.98mi |
| 4300 Tremont St Lynchburg, VA | 3.0 | 1.0 | 1122 | $1,200 | $1.07 | 45d | 1 | 1.02mi |
| 4647 Ferncliff Dr Lynchburg, VA | 2.0 | 2.0 | 1034 | $1,800 | $1.74 | 45d | 1 | 1.02mi |
| 2107 Park Ave Unit 4 Lynchburg, VA | 2.0 | 1.0 | 800 | $785 | $0.98 | 15d | 1 | 1.03mi |
| 2021 Rose Ln Lynchburg, VA | 2.0 | 1.0 | 836 | $1,095 | $1.31 | 23d | 1 | 1.07mi |
| 4607 Fairmont Ave Lynchburg, VA | 3.0 | 1.0 | 1001 | $1,650 | $1.65 | 23d | 1 | 1.07mi |
| 1625 Shaffer St Lynchburg, VA | 2.0 | 1.0 | 895 | $850 | $0.95 | 45d | 1 | 1.19mi |
| 1320 Saint Cloud Ave Lynchburg, VA | 3.0 | 1.0 | 960 | $1,550 | $1.61 | 46d | 1 | 1.19mi |
| 1400 Weeping Willow Dr Apt A Lynchburg, VA | 1.0–3.0 | 1.0–2.0 | 1003 | $1,286 | $1.28 | 15d | 12 | 1.22mi |
| 1705 1st St Unit A Lynchburg, VA | 2.0 | 1.0 | 1100 | $1,395 | $1.27 | 23d | 1 | 1.25mi |
| 2336 Aragon St Lynchburg, VA | 2.0 | 1.0 | 1042 | $995 | $0.95 | 15d | 1 | 1.31mi |
| 1401 Kemper St Lynchburg, VA | 2.0–3.0 | 2.0 | 1118 | $707 | $0.63 | 23d | 6 | 1.42mi |
| 1009 Lindsay St Lynchburg, VA | 3.0 | 2.0 | 1050 | $1,800 | $1.71 | 45d | 1 | 1.43mi |
Listing history 6 events
-
2026-06-21days on market $134,900 Active 6 DOM
-
2026-06-19days on market $134,900 Active 4 DOM
-
2026-06-18days on market $134,900 Active 3 DOM
-
2026-06-17days on market $134,900 Active 2 DOM
-
2026-06-15remarks 275-char remark
-
2026-06-15$134,900 Active 1 DOM
ⓘ Source: listings_history table (triggers on properties + properties_extension) + one-shot
backfill from property_details.listing_events for pre-trigger history.
Climate risk First Street
- Flood 1/10 Low FEMA zone X (unshaded) · 0% chance over 30 yrs
- Wildfire 2/10 Low
- Heat 6/10 Major 7 d/yr ≥102°F today · 18 d/yr by 30 yrs out
- Wind 2/10 Low 3% chance of damaging wind over 30 yrs
- Air quality 2/10 Low 0 unhealthy d/yr today · 1 by 30 yrs out
Nearby sold comps map
Loading sold comps map…
Walkable amenities ~0.75 mi
Loading nearby amenities…
Taxation est. · year 1
- Rental income
- $14,082
- − Mortgage interest
- −$7,556
- − Property taxes
- −$2,024
- − Insurance
- −$674
- − Repairs & maintenance
- −$1,127
- − Management
- −$1,127
- − Depreciation
- −$3,924
- Taxable loss
- −$2,350
- Est. tax savings @ 24.0%
- +$564
- After-tax cash flow
- $502/yr
For passive investors: Depreciation is non-cash, so a rental often shows a tax loss while cash-flowing — sheltering income. Rental losses are passive: they offset passive income freely, and up to $25,000/yr can offset ordinary (W-2) income if you actively participate and your MAGI is under $100k (phasing out to $0 by $150k); unused losses carry forward. On sale, claimed depreciation is recaptured at up to 25%, and gains may owe capital-gains tax (a 1031 exchange can defer both). Figures are a year-1 estimate at your 24.0% rate — not tax advice; consult a CPA.
Condition & rehab AI · 12 photos
This updated single-family home in Lynchburg, VA is in good condition with recent updates to the kitchen and bathroom. It's move-in ready with a good curb appeal and minimal maintenance required.
Value-add opportunities
- Both Paint exterior trim — Enhances curb appeal and value
- Both Replace or clean gutters — Improves drainage and prevents water damage
Renovation cost estimate screening
Value-add ROI direction
- Both Paint exterior trim — Enhances curb appeal and value ↑
- Both Replace or clean gutters — Improves drainage and prevents water damage ↑
ⓘ Cost ranges are severity-bucket heuristics (US national rule-of-thumb). Get contractor quotes + a written scope before underwriting a rehab budget.
Schools (NCES district)
- District
- Lynchburg City Public School District
- NCES district ID
- 5102340
- Math proficiency
- 36% ▼ -38.00%
- Reading proficiency
- 61% ▼ -8.00%
- Median HH income
- $39,097
- Composite
- 40.4/100
- National rank
- #3730
- State rank
- #104 of 131 in VA
Livability — Lynchburg
- Score
- 91/100
- State rank
- #1
- US rank
- #58
Category grades
Schools grade is shown separately in the Schools card above.
Census & demographics
- Census place
- Lynchburg, VA
- County
- Lynchburg City · 97,036 people
- City population
- 97,036
- Metro
- Lynchburg, VA
- Population (ZIP)
- 25,006
- Household income
- $42,222
- Rent vs Own
- Severe rent burden
- 1717.0
Population outlook (Lynchburg County) Hauer SSP2
- Today (2025)
- 87,977 people
- By 2030
- 93,626 · +6.4%
- By 2040
- 106,145 · +20.7%
- By 2050
- 120,783 · +37.3%
- By 2075
- 162,249 · +84.4%
- By 2100
- 191,358 · +117.5%
Race, ethnicity, and origin ACS 2023
- Neighborhood character
- Diverse neighborhood (Simpson 0.55)
- Race & ethnicity
- White 58% Black 34% Two or more races 4% Hispanic / Latino 3%
- Common ancestry
- Slovak 1% Italian 1% Serbian 1%
- Foreign-born
- 3% · Canada
- Languages at home
- 96% English-only · Spanish 2%
Political lean MEDSL · Lynchburg
- 2024 margin
- Lean R (+7.9) · D 45.4% · R 53.3% · Other 1.3%
- 2008→2024 swing
- -3.9pp toward R · 2008: -4.0pp · 2024: -7.9pp
- All cycles
- 2024: R+7.9 2020: D+2.6 2016: R+9.0 2012: R+10.6 2008: R+4.0
Not yet ingested
- Civics
- —
Market trends
- HPI YoY
- ▼ -131.06%
- Current HPI
- 223.6839
- Rent YoY
- ▲ 1.15%
- Metro
- Lynchburg, VA
- State GDP YoY
- ▲ 2.40%
- F500 in state
- 50
Industry mix (Fortune 500 HQ in VA)
| Industry | F500 HQs | Revenue |
|---|---|---|
| Aerospace / Defense | 4 | $236B |
|
||
| Technology / Defense | 3 | $32B |
|
||
| Financial Services | 2 | $176B |
|
||
| Utilities | 2 | $27B |
|
||
| Insurance | 2 | $25B |
|
||
| Technology | 2 | $15B |
|
||
Price history
1 event — show timeline
- 2026-06-15 Listed $134,900 LMLS
Cash-flow waterfall
monthlySold comps — $/sqft
last 12 mo · ≤1 miLoading sold comps…