 Multi-family
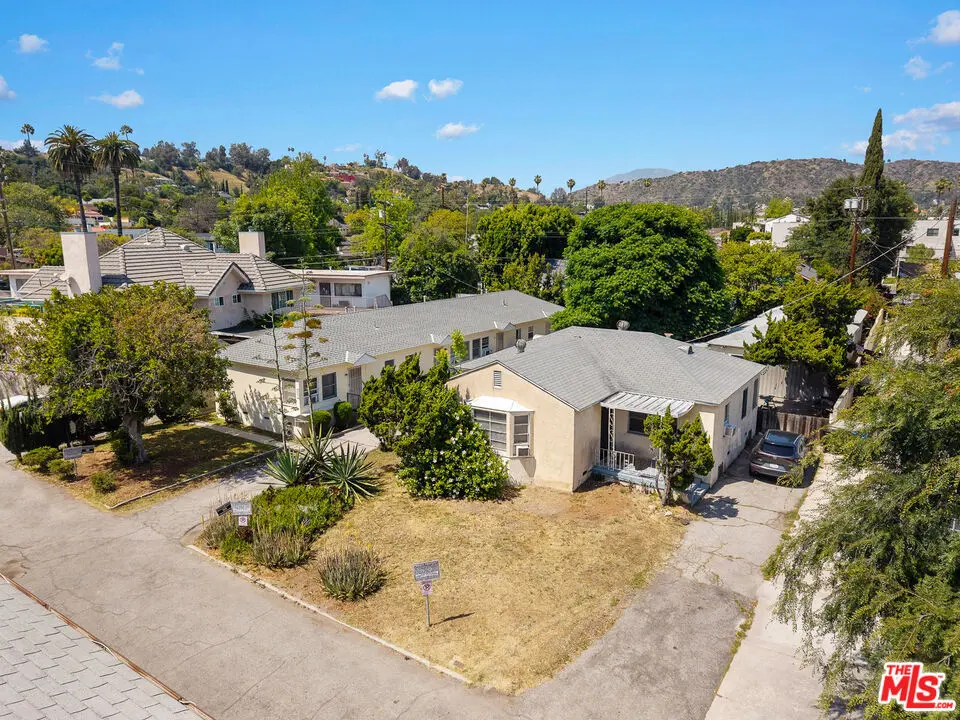
4401 Westdale Ave · Los Angeles, CA
Flood risk 4/10 · Minor
- FEMA flood zone
- X (unshaded)
- Chance of flooding over 30 yrs
- 0.22%
- Est. flood insurance / yr
- $507 – $1,088
Fire risk 5/10 · Moderate
- Est. fire insurance / yr
- $659 – $1,223
Heat risk 6/10 · Moderate
- Hot days now (above 97°F)
- 7 days/yr
- Hot days in 30 yrs
- 22 days/yr
Wind risk 1/10 · Minimal
- Chance of severe wind over 30 yrs
- —
Air-quality risk 6/10 · Moderate
- Unhealthy air days now
- 11 days/yr
- Unhealthy air days in 30 yrs
- 12 days/yr
Risk factors via First Street. Map © Google.
Why this score? — see what drove the B+ grade
The composite is a weighted blend of 9 inputs, each scored 0–100. Each bar is that input's sub-score; the figure is the points it added to the 100-point composite (weight × sub-score).
- Cash flow +30.0/30.0
- ARV discount +15.0/15.0
- DSCR +10.0/10.0
- 1% rule +8.4/10.0
- Schools +3.6/10.0
- Livability +3.4/5.0
- Rent growth +2.8/5.0
- Condition / age +2.5/5.0
- Appreciation +0.0/10.0
$995,000
🖨 Deal sheet (PDF) 📄 Offer letter ✓ Due diligence
Multi-family units
County records classify this as Multi-Family (5+ Unit). Listing-text estimate: 1 unit. estimate disagrees with records
5+ unit building — per-unit beds/baths from public records are typically unavailable; the breakdown below (if shown) is an estimate from the listing text.
Listing remarks
* * DO NOT DISTURB TENANTS OR WALK ON PROPERTY - DRIVE BY ONLY * * We are proud to present a rare 5-unit investment opportunity situated on an expansive 15,360 SF lot in Eagle Rock, one of Los Angeles' most sought-after and supply-constrained submarkets. Located at 44014403 Westdale Avenue, the property is comprised of a four-unit single-story structure featuring one-bedroom/one-bathroom units, along with a detached three-bedroom/one-bathroom single-family residence complete with its own private backyard and covered garage. All five units are single-story, a highly desirable configuration rarely found in Eagle Rock. The property spans 2,947 SF of improvements on a large RD2-1 zoned parc
Key facts
- Expansive lot
- Private backyard
- Covered garage
Tags
Property features AI
Finance
- Financial info: Gross operating income: $93,840; Net operating income: $60,460; Total annual expenses: $33,380; Gross income shown as 93,840; Gross rent multiplier: 10.6; Rent control: yes; Unit rents (actual): 1-bed units shown at $5,420 total (four like units), 3-bed unit actual rent $2,400; Projected rents listed for units
- HOA & community: Five total units in the complex; Three buildings on the lot
Exterior
- Parking: Driveway parking; Above-street-level parking; Twelve total parking spaces
- Utilities: Zoned LARD2
- Home design: Residential income property; One level
- Exterior features: Other on-site structures
Interior
- Kitchen: Kitchens in each unit
- Bedrooms: Four 1-bedroom units; One 3-bedroom unit
- Bathrooms: Four 1-bath units; One 1-bath unit (3-bed unit)
- Heating & cooling: Other heating; Other cooling
- Interior features: Units are apartments; As-is condition
- Laundry & utility: Laundry in unit
Neighborhood map
What this means for you Summary
Snapshot
- This is a 3-bed/1.0-bath multifamily listed at $995k.
Deal economics
- At list price, monthly cash flow is $4k ($50k/yr) — positive.
- The deal already cash-flows at list — no discount required.
- Meets the 1% rule at list price ($13k rent vs $995k).
- Recommended offer: $980k (1.5% below list) — sets the bar for market timing.
- Cap rate 11.4% vs local median 2.1% in Los Angeles — top-decile yield for the area; either an underpriced asset or a hidden risk that comps aren't pricing in. Stress-test before assuming the spread holds.
Location & tenants
- Location reads 68/100 on livability (#273 in CA) — a middle-class / working-renter tenant base. Strengths: amenities A+, commute A+, employment B; Watch: health & safety C-, crime F, cost of living F.
- Los Angeles Unified (urban): math 29% / reading 54% proficiency, ranked #223 of 517 in CA (top 43%) — families likely to look elsewhere, expect single-tenant / working-renter base with shorter leases; 67% free/reduced lunch — lower-income household profile, screen leases tightly.
- Zoned schools: Eagle Rock Elementary (756 students, 34% FRL); Eagle Rock High (math 47% / reading 62%, grade C-, #256 of 1,170 statewide, top 24%, 2,069 students, 48% FRL) — zoned schools average 41% FRL vs 67% district-wide (26 pts lower); this property's tenant base skews higher-income than the district average.
- Zoned-school proficiency averages 54% at this address vs 42% district-wide (+13 pts) — the actual schools serving this property are materially stronger than the Los Angeles Unified average implies; a family-tenant draw the district grade alone would hide.
- Market conditions: Rents rising (+1.2%/yr); 61 active listings in the ZIP; 40 comparable units currently listed for rent nearby; rentals at typical pace (median 20d on market — plan ~3-4 weeks tenant-placement turnaround); high-income renter base; 19,697 units permitted in Los Angeles County in 2024 (9,426 in 5+ unit buildings).
Forward outlook
- Local home prices are declining (-3.0%/yr); year-one equity from $7k of loan paydown is wiped out by about $30k of value loss. Plan a longer hold.
- Los Angeles County population projected at +9% by 2050 — modest demand growth; plan on rents tracking national, not racing it.
- At projected returns (-3.0% appreciation + 1.2% rent growth), your $279k cash investment doubles in ~8 years — after that, you're playing with house money.
Negotiation context
- It's been on market 23 days — a 2% lower offer ($980k) is reasonable based on typical stale-listing flexibility.
- 20 sale attempts since 22y ago with the ask held roughly flat each time — persistent listings suggest the price (not the market) is what's stuck; bring a comps-based counter.
Risks & watch-outs
- Watch-outs: built in 1947 — expect roof / HVAC / electrical / plumbing capex.
- Climate carrying-cost: moderate wildfire risk; extreme-heat days projected 7→22/yr by 2055 (HVAC capex compounding) — expect insurance premiums to compound above CPI over the hold.
Questions for the listing agent
- Built in 1947 — when were the roof, HVAC, electrical panel, plumbing, and water heater last replaced?
- Is there a deadline driving the sale (1031 exchange, divorce, estate, relocation)? That informs how much negotiation room exists.
- Schools are D-rated, which usually means shorter tenancies and higher turnover. Who's the typical renter profile here, and what's been the actual vacancy rate?
- Crime grade is F in this area — have there been break-ins, vandalism, or insurance claims at this property in the last 3 years? What carrier currently insures it and at what premium?
- What's the average days-on-market for RENTAL listings here right now (not sales)? A rising rental-DOM trend means longer vacancies and softer asking-rent achievability than the comps imply.
- What's the recent tenant-quality profile in this submarket — average credit score on applications, eviction rate, late-payment / NSF rate, and stable-employment percentage? A property-management company in the area should have these aggregated.
- How much new apartment / multifamily construction is in the pipeline within 1–3 miles? Heavy new supply (>2% of stock underway) typically softens rents 12–24 months out; light construction supports rent growth.
Investment metrics
- 1% rule
- 1.34% ✓
- Cap rate
- 11.36%
- Cash-on-cash
- 18.10%
- DSCR
- 1.81
- GRM
- 6.2
CMA / ARV
- ARV (median comp)
- $1,232,797
- List price
- $995,000
- Delta
- -19.29%
- Verdict
- UNDERPRICED
- Comps
- 20 within 1.0 mi
Show comp detail 1 sale within ~0.75 mi
| Address | Dist | Beds/Ba | Sqft | Sold | Price | $/sf | Match |
|---|---|---|---|---|---|---|---|
| 3838 W Avenue 41 | 0.74mi | 2/2.0 (-1) | 1,264 (+13%) | 21mo | $1,125,000 | $890 | 17 |
Match score weights: distance 35% · size 25% · config 20% · recency 20%. Top-matched comps best support the ARV.
Projected returns pro-forma
-3.0% appreciation · 1.22% rent growth · sell at horizon
- IRR
- 7.7%
- Equity multiple
- 1.30×
- Total profit
- $82,776
- Equity at exit
- $148,358
- IRR
- 15.5%
- Equity multiple
- 2.16×
- Total profit
- $323,305
- Equity at exit
- $86,029
Cash invested: $278,600 (down + closing). Projections, not guarantees.
Landlord ↔ Tenant lean methodology
- Overall (CITY)
- 0 Strongly Tenant-Friendly
- State California
- 18 Strongly Tenant-Friendly · D+13
- County
- — inherits STATE
- City Los Angeles
- 0 Strongly Tenant-Friendly · D+22
ZIP-level market 90041
- Rents YoY
- 1.2%
- Active inventory
- 61
- Price-to-rent
- 33.1×
Monthly cashflow live
- Estimated rent
- $13,309 high interval (Pro) →
- Mortgage (P&I)
- −$5,218
- Tax from tax record
- −$680 /mo · $8,165/yr
- Insurance
- −$415
- HOA
- −$0
- Vacancy / Maint / Mgmt
- −$2,795
- Net cashflow
- $4,201
Break-even live
Sensitivity live
| Price | -10% $4,764 | -5% $4,483 | +0% $4,201 | +5% $3,920 | +10% $3,638 |
|---|---|---|---|---|---|
| Rent | -10% $3,150 | -5% $3,675 | +0% $4,201 | +5% $4,727 | +10% $5,253 |
| Rate | -1.0pp $4,702 | -0.5pp $4,454 | base $4,201 | +0.5pp $3,943 | +1.0pp $3,681 |
5-unit breakdown (identical units grouped — click to expand)
| Units | Beds | Baths | Est. rent |
|---|---|---|---|
| 4× units | 1 | 1 | $10,032 |
| #1 | 1 | 1 | $2,508 |
| #2 | 1 | 1 | $2,508 |
| #3 | 1 | 1 | $2,508 |
| #4 | 1 | 1 | $2,508 |
| 1× unit | 3 | 1 | $3,276 |
| Total (5 units) | $13,309 | ||
UW: 25.0% down · 7.5% · 30yr · 1.5% tax · 5.0% vac · 8.0% maint · 8.0% mgmt
Financing live
Cash to close
- Down payment
- $248,750
- Closing costs
- $29,850
- Reserves months
- —
- Total cash needed
- —
Loan-product check · same deal, 3 products live
Conventional
25% down · 7.5% · 30yr
- Down + closing
- —
- Monthly P&I
- —
- Monthly cashflow
- —
- DSCR
- —
- Eligible?
- —
Personal DTI + credit; lowest rate.
DSCR
20% down · 8.5% · 30yr
- Down + closing
- —
- Monthly P&I
- —
- Monthly cashflow
- —
- DSCR
- —
- Eligible?
- —
No personal income docs; deal must DSCR.
Hard money
10% down · 12.0% · 12mo
- Down + closing
- —
- Monthly P&I
- —
- Monthly cashflow
- —
- DSCR
- —
- Eligible?
- —
Short-term bridge; refi at stabilization.
Rent comps 40 comps
| Address | Beds | Baths | Sqft | Rent | $/sqft | DOM | Units | Dist |
|---|---|---|---|---|---|---|---|---|
| 4609 Ellenwood Dr Unit 201 Eagle Rock, CA | 2.0 | 1.0 | 848 | $2,300 | $2.71 | 9d | 1 | 0.09mi |
| 4547 Eagle Rock Blvd Los Angeles, CA | 2.0 | 2.0–2.5 | 1054 | $3,425 | $3.25 | 19d | 4 | 0.18mi |
| 4526 Eagle Rock Blvd #4 Los Angeles, CA | 3.0 | 2.5 | 1272 | $3,350 | $2.63 | 20d | 1 | 0.24mi |
| 1720 North Avenue 45 Los Angeles, CA | 2.0 | 1.0 | 800 | $3,200 | $4.00 | 17d | 1 | 0.25mi |
| 2057 Norwalk Ave Los Angeles, CA | 2.0 | 2.0 | 823 | $3,000 | $3.65 | 26d | 1 | 0.32mi |
| 4441 Alumni Ave Los Angeles, CA | 3.0 | 2.0 | 1360 | $7,250 | $5.33 | 9d | 1 | 0.36mi |
| 1561 Hazelwood Ave Los Angeles, CA | 2.0 | 1.0 | 1220 | $3,800 | $3.11 | 26d | 1 | 0.40mi |
| 4307 York Blvd Los Angeles, CA | 2.0 | 2.0 | 1443 | $6,000 | $4.16 | 9d | 1 | 0.51mi |
| 2734 Lytelle Pl Los Angeles, CA | 2.0 | 1.0 | 702 | $2,700 | $3.85 | 45d | 1 | 0.52mi |
| 4139 W Avenue 42 Los Angeles, CA | 3.0 | 2.0 | 1064 | $4,500 | $4.23 | 45d | 1 | 0.56mi |
| 4353 Toland Way Los Angeles, CA | 2.0 | 2.0 | 1000 | $2,995 | $3.00 | 45d | 1 | 0.56mi |
| 3821 W Avenue 43 Los Angeles, CA | 1.0–2.0 | 1.5–2.0 | 840 | $3,250 | $3.87 | 5d | 2 | 0.58mi |
| 4958 N Maywood Ave Los Angeles, CA | 2.0 | 1.0 | 850 | $2,595 | $3.05 | 9d | 1 | 0.59mi |
| 4309 Toland Way Los Angeles, CA | 3.0 | 2.0 | 1081 | $4,795 | $4.44 | 4d | 1 | 0.63mi |
| 4313 Toland Way Eagle Rock, CA | 2.0 | 1.0 | 780 | $2,300 | $2.95 | 45d | 1 | 0.63mi |
| 4310 Toland Way Los Angeles, CA | 2.0 | 1.0 | 744 | $3,395 | $4.56 | 6d | 1 | 0.65mi |
| 1829 Fair Park Ave Los Angeles, CA | 2.0 | 1.0 | 1064 | $3,995 | $3.75 | 16d | 1 | 0.69mi |
| 5144 Rockland Ave Los Angeles, CA | 3.0 | 2.0 | 1400 | $4,995 | $3.57 | 45d | 1 | 0.76mi |
| 3014 Sagamore Way Los Angeles, CA | 2.0 | 1.0 | 1022 | $5,500 | $5.38 | 5d | 1 | 0.77mi |
| 3014 Sagamore Way Los Angeles, CA | 2.0 | 1.0 | 1011 | $5,800 | $5.74 | 26d | 1 | 0.77mi |
| 5163 El Rio Ave Eagle Rock, CA | 2.0 | 1.0 | 768 | $3,750 | $4.88 | 22d | 1 | 0.80mi |
| 1223 North Avenue 45 Unit 3/4 Eagle Rock, CA | 2.0 | 2.5 | 1200 | $5,250 | $4.38 | 0d | 1 | 0.80mi |
| 2455 Colorado Blvd Los Angeles, CA | 2.0 | 1.0–2.0 | 790 | $3,800 | $4.81 | 1d | 2 | 0.80mi |
| 4921 La Roda Ave Unit 1 Eagle Rock, CA | 2.0 | 1.0 | 1000 | $3,599 | $3.60 | 26d | 1 | 0.83mi |
| 4221 Verdugo Rd Los Angeles, CA | 1.0–2.0 | 1.0 | 725 | $2,595 | $3.58 | 3d | 4 | 0.84mi |
| 1130 El Paso Dr Los Angeles, CA | 3.0 | 2.0 | 1292 | $6,500 | $5.03 | 45d | 1 | 0.86mi |
| 1523 E Windsor Rd Unit 105B Glendale, CA | 2.0 | 1.5 | 1079 | $2,950 | $2.73 | 15d | 1 | 0.88mi |
| 4819 Vincent Ave Los Angeles, CA | 2.0 | 1.0 | 800 | $3,500 | $4.38 | 45d | 1 | 0.90mi |
| 4826 Hub St Unit 1 Los Angeles, CA | 3.0 | 3.0 | 1460 | $5,000 | $3.42 | 26d | 1 | 0.90mi |
| 5046 La Roda Ave Unit 1 Los Angeles, CA | 3.0 | 2.0 | 1200 | $5,100 | $4.25 | 45d | 1 | 0.96mi |
| 4435 Caledonia Way Los Angeles, CA | 2.0 | 1.0 | 1136 | $4,500 | $3.96 | 45d | 1 | 0.99mi |
| 1416 E Windsor Rd Glendale, CA | 2.0 | 2.0 | 1100 | $2,995 | $2.72 | 26d | 1 | 1.00mi |
| 3928 Ackerman Dr Los Angeles, CA | 3.0 | 2.5 | 1364 | $4,895 | $3.59 | 26d | 1 | 1.01mi |
| 411 Lincoln Ave Glendale, CA | 2.0 | 2.0 | 900 | $2,662 | $2.96 | 14d | 2 | 1.03mi |
| 1522 Dixon St Unit 8 Glendale, CA | 2.0 | 2.0 | 800 | $3,150 | $3.94 | 3d | 1 | 1.05mi |
| 5206 Range View Ave Los Angeles, CA | 2.0 | 1.5 | 900 | $3,950 | $4.39 | 45d | 1 | 1.05mi |
| 1597 Grandola Ave Los Angeles, CA | 2.0 | 1.0 | 896 | $3,570 | $3.98 | 45d | 1 | 1.06mi |
| 5213 Meridian St Unit 5 Highland Park, CA | 2.0 | 1.0 | 850 | $2,500 | $2.94 | 9d | 1 | 1.09mi |
| 1377 E Windsor Rd Glendale, CA | 1.0–2.0 | 1.0 | 825 | $2,799 | $3.39 | 1d | 4 | 1.10mi |
| 5227 Eagle Dale Ave #2 Los Angeles, CA | 3.0 | 2.5 | 1400 | $4,195 | $3.00 | 9d | 1 | 1.12mi |
Listing history 38 events
-
2026-04-28$995,000 Active 2224-char remark
-
2021-02-01Active
-
2020-08-03status Active
-
2020-07-08Active
-
2020-07-07price
-
2020-02-12Active
-
2017-01-24historical Hold Do Not Show
-
2017-01-24historical
-
2016-10-20status Active
-
2016-10-20price $1,250,000
-
2016-10-13historical
-
2016-08-17$1,500,000 Active
-
2016-08-17$1,250,000
-
2016-05-31historical
-
2016-05-31historical
-
2016-01-27$1,249,900 Active
-
2016-01-27$1,249,900
-
2016-01-21historical
-
2016-01-21historical
-
2015-11-23price $1,249,900
-
2015-07-21$1,400,000 Active
-
2015-07-21$1,249,900
-
2014-04-21historical Hold
-
2014-01-13$985,000 Active
-
2014-01-12historical
-
2013-09-20$985,000 Active
-
2006-05-24historical
-
2006-03-06historical
-
2006-03-06historical
-
2006-02-24
-
2006-02-24$819,000
-
2006-02-24$819,000
-
2004-10-26historical
-
2004-09-22historical
-
2004-09-22historical
-
2004-02-25
-
2004-02-25$779,500
-
2004-02-25$779,500
ⓘ Source: listings_history table (triggers on properties + properties_extension) + one-shot
backfill from property_details.listing_events for pre-trigger history.
Tax reassessment forecast CA · Resets to sale price
- Current annual tax
- $8,165 · $680/mo
- Projected year-2 tax
- $8,165 · $680/mo
- Expected delta
- $0/yr ($0/mo · -0.0%)
ⓘ Screening estimate from a state-policy table — verify with the county assessor before closing.
Climate risk First Street
- Flood 4/10 Moderate FEMA zone X (unshaded) · 22% chance over 30 yrs
- Wildfire 5/10 Major
- Heat 6/10 Major 7 d/yr ≥97°F today · 22 d/yr by 30 yrs out
- Wind 1/10 Low
- Air quality 6/10 Major 11 unhealthy d/yr today · 12 by 30 yrs out
Nearby sold comps map
Loading sold comps map…
Walkable amenities ~0.75 mi
Loading nearby amenities…
Taxation est. · year 1
- Rental income
- $159,708
- − Mortgage interest
- −$55,735
- − Property taxes
- −$8,165
- − Insurance
- −$4,975
- − Repairs & maintenance
- −$12,777
- − Management
- −$12,777
- − Depreciation
- −$28,945
- Taxable income
- $36,333
- Est. tax owed @ 24.0%
- −$8,720
- After-tax cash flow
- $41,694/yr
For passive investors: Depreciation is non-cash, so a rental often shows a tax loss while cash-flowing — sheltering income. Rental losses are passive: they offset passive income freely, and up to $25,000/yr can offset ordinary (W-2) income if you actively participate and your MAGI is under $100k (phasing out to $0 by $150k); unused losses carry forward. On sale, claimed depreciation is recaptured at up to 25%, and gains may owe capital-gains tax (a 1031 exchange can defer both). Figures are a year-1 estimate at your 24.0% rate — not tax advice; consult a CPA.
Schools (NCES district)
- District
- Los Angeles Unified
- NCES district ID
- 0622710
- Math proficiency
- 29% ▼ -4.00%
- Reading proficiency
- 54% ▲ 10.00%
- Median HH income
- $50,403
- Composite
- 35.67/100
- National rank
- #4875
- State rank
- #223 of 517 in CA
Livability — Los Angeles
- Score
- 68/100
- State rank
- #273
- US rank
- #9237
Category grades
Schools grade is shown separately in the Schools card above.
Census & demographics
- Census place
- Los Angeles, CA
- County
- Los Angeles County · 9,444,647 people
- City population
- 3,838,149
- Metro
- Los Angeles-Long Beach-Anaheim, CA
- Population (ZIP)
- 27,920
- Household income
- $114,526
- Rent vs Own
- Severe rent burden
- 1107.0
Population outlook (Los Angeles County) Hauer SSP2
- Today (2025)
- 10,940,515 people
- By 2030
- 11,256,481 · +2.9%
- By 2040
- 11,729,929 · +7.2%
- By 2050
- 11,948,407 · +9.2%
- By 2075
- 11,818,114 · +8.0%
- By 2100
- 10,842,928 · -0.9%
Race, ethnicity, and origin ACS 2023
- Neighborhood character
- Highly diverse neighborhood (Simpson 0.72)
- Race & ethnicity
- Hispanic / Latino 33% White 33% Asian 25% Two or more races 17% Black 2% Native American 1%
- Hispanic origin (detail)
- Mexican 23%
- Common ancestry
- Lithuanian 2% Scotch-Irish 2% Romanian 2%
- Foreign-born
- 30% · Canada, China, South Korea
- Languages at home
- 57% English-only · Spanish 20% Tagalog/Filipino 14% Other Indo-European 4%
Political lean MEDSL · Los Angeles
- 2024 margin
- Solid D (+32.9) · D 64.8% · R 31.9% · Other 3.3%
- 2008→2024 swing
- -7.4pp toward R · 2008: 40.4pp · 2024: 32.9pp
- All cycles
- 2024: D+32.9 2020: D+44.2 2016: D+48.0 2012: D+40.0 2008: D+40.4
Not yet ingested
- Civics
- —
Market trends
- HPI YoY
- ▼ -906.86%
- Current HPI
- 521.7291
- Rent YoY
- ▲ 1.22%
- Metro
- Los Angeles-Long Beach-Anaheim, CA
- State GDP YoY
- ▲ 3.21%
- F500 in state
- 116
Industry mix (Fortune 500 HQ in CA)
| Industry | F500 HQs | Revenue |
|---|---|---|
| Technology | 27 | $1,492B |
|
||
| Financial Services | 3 | $174B |
|
||
| Retail | 3 | $44B |
|
||
| Insurance | 3 | $26B |
|
||
| Media / Entertainment | 2 | $115B |
|
||
| Pharmaceuticals / Biotech | 2 | $62B |
|
||
Price history
+39.2% since first listed41 events — show timeline
- 2026-06-01 Sold (Public Records) $1,085,000 Public Records
- 2026-06-01 Sold (MLS) $1,085,000 TheMLS
- 2026-05-21 Pending — TheMLS
- 2026-04-28 Listed $995,000 TheMLS
- 2021-02-01 Listed — TheMLS
- 2020-08-03 Relisted — TheMLS
- 2020-07-08 Listed — TheMLS
- 2020-07-07 Price Changed — TheMLS
- 2020-02-12 Listed — TheMLS
- 2017-01-24 Listing Removed — SDMLS
- 2017-01-24 Delisted — CRMLS
- 2016-10-20 Relisted — CRMLS
- 2016-10-20 Price Changed $1,250,000 CRMLS
- 2016-10-13 Listing Removed — CRMLS
- 2016-08-17 Listed $1,500,000 CRMLS
- 2016-08-17 Listed $1,250,000 SDMLS
- 2016-05-31 Listing Removed — SDMLS
- 2016-05-31 Listing Removed — CRMLS
- 2016-01-27 Listed $1,249,900 CRMLS
- 2016-01-27 Listed $1,249,900 SDMLS
- 2016-01-21 Listing Removed — SDMLS
- 2016-01-21 Listing Removed — CRMLS
- 2015-11-23 Price Changed $1,249,900 CRMLS
- 2015-07-21 Listed $1,400,000 CRMLS
- 2015-07-21 Listed $1,249,900 SDMLS
- 2014-04-21 Delisted — CRMLS
- 2014-01-13 Listed $985,000 CRMLS
- 2014-01-12 Listing Removed — CRMLS
- 2013-09-20 Listed $985,000 CRMLS
- 2006-05-24 Listing Removed — CRMLS
- 2006-03-06 Listing Removed — CRMLS
- 2006-03-06 Delisted — TheMLS
- 2006-02-24 Listed $819,000 CRMLS
- 2006-02-24 Listed $819,000 CRMLS
- 2006-02-24 Listed — TheMLS
- 2004-10-26 Listing Removed — CRMLS
- 2004-09-22 Listing Removed — CRMLS
- 2004-09-22 Delisted — TheMLS
- 2004-02-25 Listed $779,500 CRMLS
- 2004-02-25 Listed $779,500 CRMLS
- 2004-02-25 Listed — TheMLS
Property tax history
+1.8%/yrLatest (2025): $8,165 · +2.0% YoY. Source: county tax records.
Cash-flow waterfall
monthlySold comps — $/sqft
last 12 mo · ≤1 miLoading sold comps…