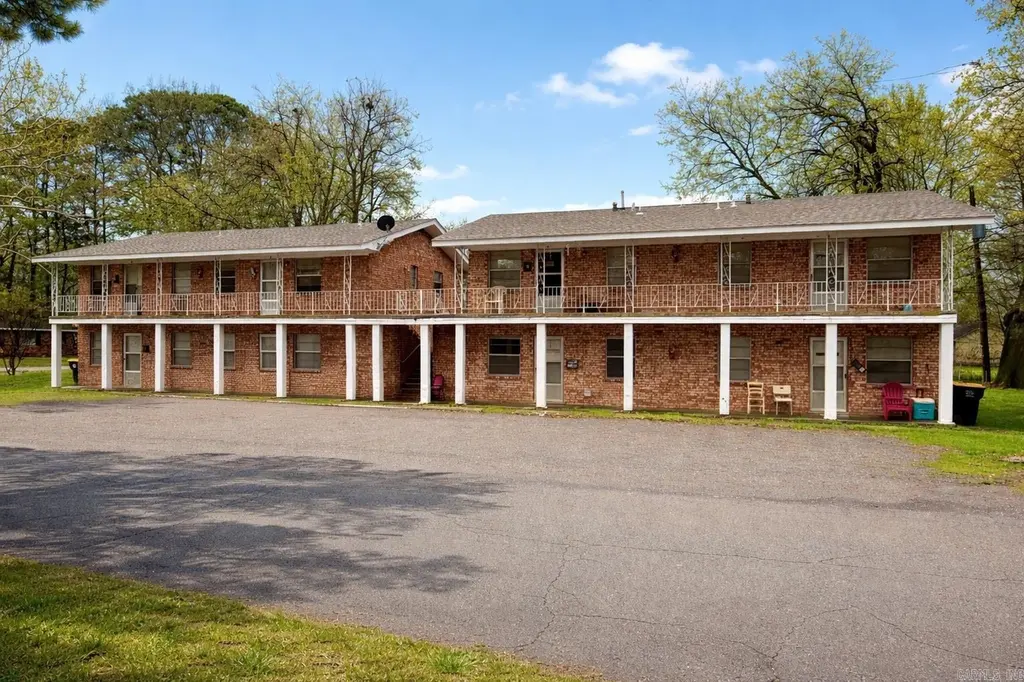
 8-Plex
318 E Purdon St · England, AR
Flood risk 1/10 · Minimal
- FEMA flood zone
- X (unshaded)
- Chance of flooding over 30 yrs
- 0.0%
- Est. flood insurance / yr
- $507 – $1,088
Fire risk 1/10 · Minimal
- Est. fire insurance / yr
- $1,499 – $2,785
Heat risk 6/10 · Moderate
- Hot days now (above 108°F)
- 7 days/yr
- Hot days in 30 yrs
- 19 days/yr
Wind risk 4/10 · Minor
- Chance of severe wind over 30 yrs
- 17.0%
Air-quality risk 2/10 · Minimal
- Unhealthy air days now
- 1 days/yr
- Unhealthy air days in 30 yrs
- 2 days/yr
Risk factors via First Street. Map © Google.
Why this score? — see what drove the B+ grade
The composite is a weighted blend of 9 inputs, each scored 0–100. Each bar is that input's sub-score; the figure is the points it added to the 100-point composite (weight × sub-score).
- Cash flow +30.0/30.0
- 1% rule +10.0/10.0
- DSCR +10.0/10.0
- Appreciation +10.0/10.0
- ARV discount +7.5/15.0
- Livability +3.4/5.0
- Rent growth +2.5/5.0
- Condition / age +2.5/5.0
- Schools +2.3/10.0
$400,000
🖨 Deal sheet (PDF) 📄 Offer letter ✓ Due diligence
Multi-family units
County records classify this as Multi-Family (5+ Unit). Listing-text estimate: 8 units. confirmed
5+ unit building — per-unit beds/baths from public records are typically unavailable; the breakdown below (if shown) is an estimate from the listing text.
Listing remarks MLS
Excellent opportunity to add an 8-unit multifamily complex to your portfolio for only $50,000 per unit! With high occupancy and loads up upside, this property is the perfect blend of stability and upside potential, all close to Little Rock. Reach out to Tyler Stoner to schedule your private tour today.
Key facts
- 0.24 acre lot
- Built 1988
- Listed 65 days
Neighborhood map
What this means for you Summary
Snapshot
- This is a 8 × 2-bed/1-bath units multifamily listed at $400k.
Deal economics
- At list price, monthly cash flow is $6k ($68k/yr) — positive. Per door: $705/mo.
- The deal already cash-flows at list — no discount required.
- Meets the 1% rule at list price ($10k rent vs $400k).
- Recommended offer: $376k (6.0% below list) — sets the bar for market timing.
Location & tenants
- Location reads 67/100 on livability (#96 in AR) — a middle-class / working-renter tenant base. Strengths: cost of living A+, housing A+, health & safety A+; Watch: schools F, crime D-, amenities F.
- England School District (town): math 27% / reading 28% proficiency, ranked #170 of 238 in AR (top 71%) — low school quality limits family demand, transient renter base, plan for 1-2y turnover; 66% free/reduced lunch — lower-income household profile, screen leases tightly.
- Market conditions: 50 active listings in the ZIP; 185 units permitted in Lonoke County in 2024 (0 in 5+ unit buildings).
Forward outlook
- In year one you build about $43k of equity ($3k loan paydown + $40k appreciation (10.0% local appreciation)).
- Lonoke County population projected at +12% by 2050 — modest demand growth; plan on rents tracking national, not racing it.
- At projected returns (10.0% appreciation + 3.0% rent growth), your $112k cash investment doubles in ~2 years — after that, you're playing with house money.
- By year 2, paydown + projected appreciation supports a ~$69k cash-out refi (75% LTV) — recoverable capital for the next deal without selling this one.
Negotiation context
- It's been on market 66 days — a 6% lower offer ($376k) is reasonable based on typical stale-listing flexibility.
- 4 sale attempts with the ask held roughly flat each time — persistent listings suggest the price (not the market) is what's stuck; bring a comps-based counter.
Risks & watch-outs
- Climate carrying-cost: extreme-heat days projected 7→19/yr by 2055 (HVAC capex compounding) — expect insurance premiums to compound above CPI over the hold.
Questions for the listing agent
- It's been on market 66 days. Have you received any prior offers? Is the seller open to a 6% concession, seller financing, or rate buy-down credit?
- Can we see the unit-by-unit rent roll, current vacancy, and any below-market leases? What's the average tenancy length?
- What capital expenditures (roof, boiler, parking lot, exteriors) have been made in the last 5 years, and what's planned in the next 2?
- Why hasn't it sold? Are there any deal-killer items the seller is aware of (foundation, flood, title, zoning, code violations)?
- Is there a deadline driving the sale (1031 exchange, divorce, estate, relocation)? That informs how much negotiation room exists.
- Schools are F-rated, which usually means shorter tenancies and higher turnover. Who's the typical renter profile here, and what's been the actual vacancy rate?
- Crime grade is D in this area — have there been break-ins, vandalism, or insurance claims at this property in the last 3 years? What carrier currently insures it and at what premium?
- What's the average days-on-market for RENTAL listings here right now (not sales)? A rising rental-DOM trend means longer vacancies and softer asking-rent achievability than the comps imply.
- What's the recent tenant-quality profile in this submarket — average credit score on applications, eviction rate, late-payment / NSF rate, and stable-employment percentage? A property-management company in the area should have these aggregated.
- How much new apartment / multifamily construction is in the pipeline within 1–3 miles? Heavy new supply (>2% of stock underway) typically softens rents 12–24 months out; light construction supports rent growth.
Investment metrics
- 1% rule
- 2.55% ✓
- Cap rate
- 23.22%
- Cash-on-cash
- 60.45%
- DSCR
- 3.69
- GRM
- 3.3
CMA / ARV
No comps found within radius.
Projected returns pro-forma
10.0% appreciation · 3.0% rent growth · sell at horizon
- IRR
- 72.6%
- Equity multiple
- 6.15×
- Total profit
- $577,143
- Equity at exit
- $360,352
- IRR
- 66.4%
- Equity multiple
- 13.65×
- Total profit
- $1,416,858
- Equity at exit
- $777,112
Cash invested: $112,000 (down + closing). Projections, not guarantees.
Landlord ↔ Tenant lean methodology
- Overall (STATE)
- 92 Strongly Landlord-Friendly
- State Arkansas
- 92 Strongly Landlord-Friendly · R+14
- County
- — inherits STATE
- City
- — inherits STATE
ZIP-level market 72046
- Home prices YoY
- 20.0%
- Active inventory
- 50
- Price-to-rent
- 26.2×
Monthly cashflow live
- Estimated rent
- $10,186 medium interval (Pro) →
- Mortgage (P&I)
- −$2,098
- Tax from tax record
- −$140 /mo · $1,684/yr
- Insurance
- −$167
- HOA
- −$0
- Vacancy / Maint / Mgmt
- −$2,139
- Net cashflow
- $5,642
Break-even live
Sensitivity live
| Price | -10% $5,869 | -5% $5,755 | +0% $5,642 | +5% $5,529 | +10% $5,416 |
|---|---|---|---|---|---|
| Rent | -10% $4,838 | -5% $5,240 | +0% $5,642 | +5% $6,045 | +10% $6,447 |
| Rate | -1.0pp $5,844 | -0.5pp $5,744 | base $5,642 | +0.5pp $5,539 | +1.0pp $5,433 |
8-unit breakdown (identical units grouped — click to expand)
| Units | Beds | Baths | Est. rent |
|---|---|---|---|
| 8× units | 2 | 1 | $10,184 |
| #1 | 2 | 1 | $1,273 |
| #2 | 2 | 1 | $1,273 |
| #3 | 2 | 1 | $1,273 |
| #4 | 2 | 1 | $1,273 |
| #5 | 2 | 1 | $1,273 |
| #6 | 2 | 1 | $1,273 |
| #7 | 2 | 1 | $1,273 |
| #8 | 2 | 1 | $1,273 |
| Total (8 units) | $10,186 | ||
UW: 25.0% down · 7.5% · 30yr · 1.5% tax · 5.0% vac · 8.0% maint · 8.0% mgmt
Financing live
Cash to close
- Down payment
- $100,000
- Closing costs
- $12,000
- Reserves months
- —
- Total cash needed
- —
Loan-product check · same deal, 3 products live
Conventional
25% down · 7.5% · 30yr
- Down + closing
- —
- Monthly P&I
- —
- Monthly cashflow
- —
- DSCR
- —
- Eligible?
- —
Personal DTI + credit; lowest rate.
DSCR
20% down · 8.5% · 30yr
- Down + closing
- —
- Monthly P&I
- —
- Monthly cashflow
- —
- DSCR
- —
- Eligible?
- —
No personal income docs; deal must DSCR.
Hard money
10% down · 12.0% · 12mo
- Down + closing
- —
- Monthly P&I
- —
- Monthly cashflow
- —
- DSCR
- —
- Eligible?
- —
Short-term bridge; refi at stabilization.
Listing history 26 events
-
2026-06-19days on market $400,000 Active 66 DOM
-
2026-06-18days on market $400,000 Active 65 DOM
-
2026-06-17days on market $400,000 Active 64 DOM
-
2026-06-16days on market $400,000 Active 63 DOM
-
2026-06-15days on market $400,000 Active 62 DOM
-
2026-06-14days on market $400,000 Active 60 DOM
-
2026-06-12days on market $400,000 Active 59 DOM
-
2026-06-09days on market $400,000 Active 56 DOM
-
2026-06-08days on market $400,000 Active 55 DOM
-
2026-06-07days on market $400,000 Active 54 DOM
-
2026-06-07days on market $400,000 Active 53 DOM
-
2026-06-04days on market $400,000 Active 50 DOM
-
2026-06-02days on market $400,000 Active 49 DOM
-
2026-06-01days on market $400,000 Active 48 DOM
-
2026-05-31days on market $400,000 Active 47 DOM
-
2026-05-31days on market $400,000 Active 46 DOM
-
2026-05-08status Back on Market 303-char remark
Show marketing remark (303 chars)
Excellent opportunity to add an 8-unit multifamily complex to your portfolio for only $50,000 per unit! With high occupancy and loads up upside, this property is the perfect blend of stability and upside potential, all close to Little Rock. Reach out to Tyler Stoner to schedule your private tour today.
-
2026-05-01historical $600
-
2026-04-21historical Take Backups 303-char remark
Show marketing remark (303 chars)
Excellent opportunity to add an 8-unit multifamily complex to your portfolio for only $50,000 per unit! With high occupancy and loads up upside, this property is the perfect blend of stability and upside potential, all close to Little Rock. Reach out to Tyler Stoner to schedule your private tour today.
-
2026-04-14$400,000 New Listing 303-char remark
Show marketing remark (303 chars)
Excellent opportunity to add an 8-unit multifamily complex to your portfolio for only $50,000 per unit! With high occupancy and loads up upside, this property is the perfect blend of stability and upside potential, all close to Little Rock. Reach out to Tyler Stoner to schedule your private tour today.
-
2026-03-14$600
-
2025-05-06soldstatus $360,000
-
2025-04-28soldstatus $360,000 Sold 977-char remark
Show marketing remark (977 chars)
Capitalize on a rare investment value-add opportunity with this 8-unit apartment complex in a high-demand rental market. Seven units are currently occupied with month to month leases, ensuring a steady income stream right from the start. The eighth unit sets this property apart; it has been freshly painted and newly carpeted, making it move-in ready for immediate leasing or perfect for a more extensive updates to increase rental value further. This complex is an ideal choice for investors looking to enhance their portfolio through strategic upgrades and rent escalations. With strong rental demand and significant room for property improvements, this is a prime opportunity to substantially grow your investment returns. Properties with this level of potential are in short supply and high demand. Contact us today for financial details and to arrange a private tour. Secure this property before it’s too late and watch your investment flourish! Agents see remarks!
-
2025-02-21status Under Contract 977-char remark
Show marketing remark (977 chars)
Capitalize on a rare investment value-add opportunity with this 8-unit apartment complex in a high-demand rental market. Seven units are currently occupied with month to month leases, ensuring a steady income stream right from the start. The eighth unit sets this property apart; it has been freshly painted and newly carpeted, making it move-in ready for immediate leasing or perfect for a more extensive updates to increase rental value further. This complex is an ideal choice for investors looking to enhance their portfolio through strategic upgrades and rent escalations. With strong rental demand and significant room for property improvements, this is a prime opportunity to substantially grow your investment returns. Properties with this level of potential are in short supply and high demand. Contact us today for financial details and to arrange a private tour. Secure this property before it’s too late and watch your investment flourish! Agents see remarks!
-
2025-02-19$360,000 New Listing 977-char remark
Show marketing remark (977 chars)
Capitalize on a rare investment value-add opportunity with this 8-unit apartment complex in a high-demand rental market. Seven units are currently occupied with month to month leases, ensuring a steady income stream right from the start. The eighth unit sets this property apart; it has been freshly painted and newly carpeted, making it move-in ready for immediate leasing or perfect for a more extensive updates to increase rental value further. This complex is an ideal choice for investors looking to enhance their portfolio through strategic upgrades and rent escalations. With strong rental demand and significant room for property improvements, this is a prime opportunity to substantially grow your investment returns. Properties with this level of potential are in short supply and high demand. Contact us today for financial details and to arrange a private tour. Secure this property before it’s too late and watch your investment flourish! Agents see remarks!
-
1992-02-25soldstatus $51,000
ⓘ Source: listings_history table (triggers on properties + properties_extension) + one-shot
backfill from property_details.listing_events for pre-trigger history.
Tax reassessment forecast AR · Resets to sale price
- Current annual tax
- $1,684 · $140/mo
- Projected year-2 tax
- $2,560 · $213/mo
- Expected delta
- +$876/yr (+$73/mo · 52.0%)
ⓘ Screening estimate from a state-policy table — verify with the county assessor before closing.
Climate risk First Street
- Flood 1/10 Low FEMA zone X (unshaded) · 0% chance over 30 yrs
- Wildfire 1/10 Low
- Heat 6/10 Major 7 d/yr ≥108°F today · 19 d/yr by 30 yrs out
- Wind 4/10 Moderate 17% chance of damaging wind over 30 yrs
- Air quality 2/10 Low 1 unhealthy d/yr today · 2 by 30 yrs out
Nearby sold comps map
Loading sold comps map…
Walkable amenities ~0.75 mi
Loading nearby amenities…
Taxation est. · year 1
- Rental income
- $122,232
- − Mortgage interest
- −$22,406
- − Property taxes
- −$1,684
- − Insurance
- −$2,000
- − Repairs & maintenance
- −$9,779
- − Management
- −$9,779
- − Depreciation
- −$11,636
- Taxable income
- $64,948
- Est. tax owed @ 24.0%
- −$15,588
- After-tax cash flow
- $52,120/yr
For passive investors: Depreciation is non-cash, so a rental often shows a tax loss while cash-flowing — sheltering income. Rental losses are passive: they offset passive income freely, and up to $25,000/yr can offset ordinary (W-2) income if you actively participate and your MAGI is under $100k (phasing out to $0 by $150k); unused losses carry forward. On sale, claimed depreciation is recaptured at up to 25%, and gains may owe capital-gains tax (a 1031 exchange can defer both). Figures are a year-1 estimate at your 24.0% rate — not tax advice; consult a CPA.
Schools (NCES district)
- District
- England School District
- NCES district ID
- 0505850
- Math proficiency
- 27% ▼ -7.00%
- Reading proficiency
- 28% ▼ -2.00%
- Median HH income
- $36,807
- Composite
- 22.87/100
- National rank
- #8006
- State rank
- #170 of 238 in AR
Livability — England
- Score
- 67/100
- State rank
- #96
- US rank
- #10256
Category grades
Schools grade is shown separately in the Schools card above.
Census & demographics
- Census place
- England, AR
- Population (ZIP)
- 4,128
Population outlook (Lonoke County) Hauer SSP2
- Today (2025)
- 78,072 people
- By 2030
- 80,673 · +3.3%
- By 2040
- 84,977 · +8.8%
- By 2050
- 87,778 · +12.4%
- By 2075
- 91,398 · +17.1%
- By 2100
- 87,858 · +12.5%
Race, ethnicity, and origin ACS 2023
- Neighborhood character
- Predominantly White (68%)
- Race & ethnicity
- White 68% Black 20% Hispanic / Latino 6% Two or more races 5%
- Hispanic origin (detail)
- Mexican 5%
- Common ancestry
- Slovak 4% Serbian 1% Italian 1%
- Foreign-born
- 5% · Canada
- Languages at home
- 93% English-only · Spanish 7%
Political lean MEDSL · Lonoke
- 2024 margin
- Solid R (+53.7) · D 22.2% · R 75.8% · Other 2.0%
- 2008→2024 swing
- -6.2pp toward R · 2008: -47.5pp · 2024: -53.7pp
- All cycles
- 2024: R+53.7 2020: R+52.8 2016: R+53.3 2012: R+50.9 2008: R+47.5
Not yet ingested
- Civics
- —
Market trends
- HPI YoY
- ▲ 33.41%
- Current HPI
- 200.75
- Rent YoY
- —
- Metro
- —
- State GDP YoY
- ▲ 3.80%
- F500 in state
- 10
Industry mix (Fortune 500 HQ in AR)
| Industry | F500 HQs | Revenue |
|---|---|---|
| Retail | 1 | $681B |
|
||
| Food / Agriculture | 1 | $53B |
|
||
| Retail / Energy | 1 | $22B |
|
||
| Transportation / Logistics | 1 | $12B |
|
||
| Energy | 1 | $4B |
|
||
Price history
+684.3% since first listed10 events — show timeline
- 2026-05-08 Relisted — CARMLS
- 2026-05-01 Rental Removed $600 CARMLS
- 2026-04-21 Contingent — CARMLS
- 2026-04-14 Listed $400,000 CARMLS
- 2026-03-14 Listed for Rent $600 CARMLS
- 2025-05-06 Sold (Public Records) $360,000 Public Records
- 2025-04-28 Sold (MLS) $360,000 CARMLS
- 2025-02-21 Pending — CARMLS
- 2025-02-19 Listed $360,000 CARMLS
- 1992-02-25 Sold (Public Records) $51,000 Public Records
Property tax history
+4.1%/yrLatest (2025): $1,684 · +0.0% YoY. Source: county tax records.
Cash-flow waterfall
monthlySold comps — $/sqft
last 12 mo · ≤1 miLoading sold comps…