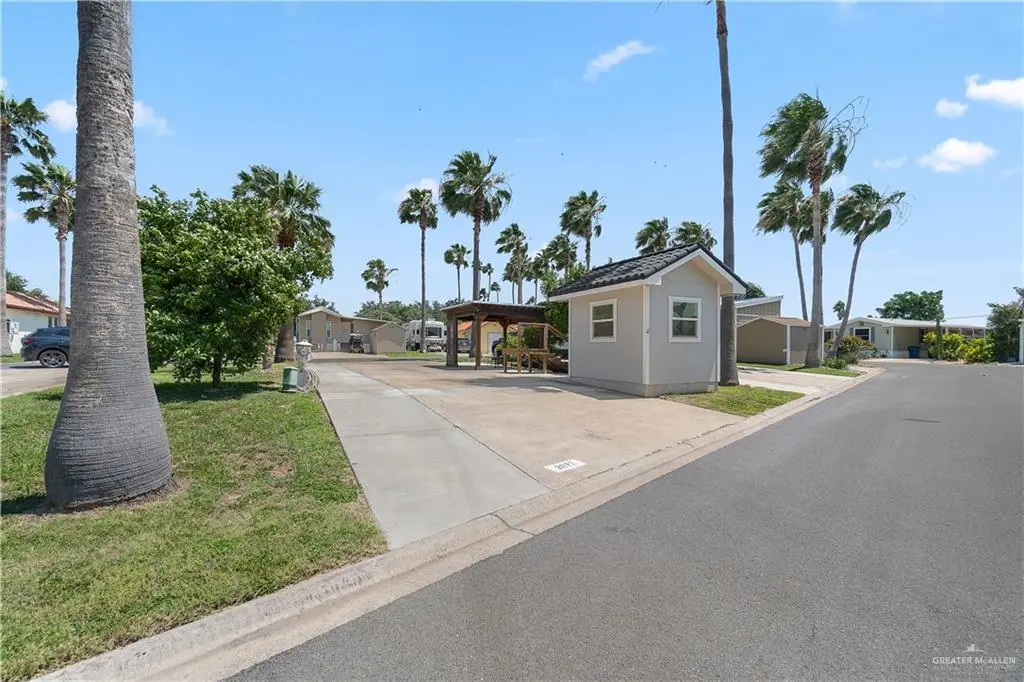
2072 Cordoba East · Mercedes, TX
Flood risk 1/10 · Minimal
- FEMA flood zone
- X (shaded)
- Chance of flooding over 30 yrs
- 0.0%
- Est. flood insurance / yr
- $507 – $1,088
Fire risk 2/10 · Minimal
- Est. fire insurance / yr
- $1,222 – $2,270
Heat risk 9/10 · Severe
- Hot days now (above 110°F)
- 7 days/yr
- Hot days in 30 yrs
- 23 days/yr
Wind risk 9/10 · Severe
- Chance of severe wind over 30 yrs
- 99.0%
Air-quality risk 1/10 · Minimal
- Unhealthy air days now
- 0 days/yr
- Unhealthy air days in 30 yrs
- 0 days/yr
Risk factors via First Street. Map © Google.
Why this score? — see what drove the B+ grade
The composite is a weighted blend of 9 inputs, each scored 0–100. Each bar is that input's sub-score; the figure is the points it added to the 100-point composite (weight × sub-score).
- Cash flow +30.0/30.0
- 1% rule +10.0/10.0
- DSCR +10.0/10.0
- ARV discount +7.5/15.0
- Appreciation +7.3/10.0
- Livability +3.4/5.0
- Rent growth +2.5/5.0
- Condition / age +2.5/5.0
- Schools +2.2/10.0
$37,500
🖨 Deal sheet 📄 Offer letter ✓ Due diligence
Listing remarks MLS
Welcome to one of the most sought-after resorts in the Rio Grande Valley, where luxury meets leisure! This incredible RV lot comes with a charming casita and a spacious screened-in patio, featuring gorgeous tile flooring throughout—perfect for enjoying the view or hosting unforgettable gatherings with friends and family. As a resident of this premier park, you’ll have access to a wealth of top-tier amenities, including pickleball and tennis courts, four sparkling pools, library, fitness center, and even a wood shop and quilting club for your creative side. Plus, the lively event center hosts exciting dances and social events that will keep you entertained year-round. For golf enthusiasts, you'll love the easy access to a stunning 18-hole, Par 72 course just outside the park. And for your furry friends, the dog parks are just a short walk away! Join an active community of 55+ residents and dive into a world of fun, with endless activities. It’s the ultimate resort lifestyle!
Key facts
- Screened-in patio
- Four sparkling pools
- Charming casita
Tags
Property features AI
Finance
- HOA & community: Mandatory POA; No homeowners association reported; Community features: gated community, golf, pool, sidewalks; Designated as a senior community
Exterior
- Parking: No garage or carport
- Utilities: Public water
- Home design: Resort/community lot (Llano Grande Lake Park Resort & CC North); Living area reported by Cameron CAD
- Construction: Slab foundation; Composition shingle roof; No construction materials specified
- Exterior features: Chain link and electric fencing; Paved road access; In-ground pool
Interior
- Kitchen: Electric water heater; Other kitchen appliances
- Flooring: Other flooring
- Bathrooms: 1 full bathroom
- Heating & cooling: Electric heating; Electric cooling
- Interior features: Countertops: other or none; No window coverings
Neighborhood map
What this means for you Summary
Snapshot
- This is a 1-bed/1.0-bath manufactured listed at $38k.
Deal economics
- At list price, monthly cash flow is $584 ($7k/yr) — positive.
- The deal already cash-flows at list — no discount required.
- Meets the 1% rule at list price ($1k rent vs $38k).
- Recommended offer: $37k (1.5% below list) — sets the bar for market timing.
- Cap rate 25.0% vs local median 3.3% in Mercedes — top-decile yield for the area; either an underpriced asset or a hidden risk that comps aren't pricing in. Stress-test before assuming the spread holds.
Location & tenants
- Location reads 67/100 on livability (#547 in TX) — a middle-class / working-renter tenant base. Strengths: cost of living A+, housing A+, health & safety A+; Watch: schools D+, crime F, amenities F.
- Weslaco ISD (suburban): math 23% / reading 31% proficiency, ranked #705 of 826 in TX (top 85%) — low school quality limits family demand, transient renter base, plan for 1-2y turnover.
- Market conditions: 390 active listings in the ZIP; 1 comparable units currently listed for rent nearby; 7,378 units permitted in Hidalgo County in 2024 (641 in 5+ unit buildings).
Forward outlook
- In year one you build about $2k of equity ($259 loan paydown + $2k appreciation (4.5% local appreciation)).
- Hidalgo County population projected at +28% by 2050 — long-run rental-demand tailwind backs the buy-and-hold thesis.
- At projected returns (4.5% appreciation + 3.0% rent growth), your $10k cash investment doubles in ~2 years — after that, you're playing with house money.
Negotiation context
- It's been on market 16 days — a 2% lower offer ($37k) is reasonable based on typical stale-listing flexibility.
- 4 sale attempts since 4y ago with the ask held roughly flat each time — persistent listings suggest the price (not the market) is what's stuck; bring a comps-based counter.
Risks & watch-outs
- Watch-outs: property tax is 3.6% of price.
- Climate carrying-cost: severe wind risk, 99% chance of damaging wind over 30y; extreme-heat days projected 7→23/yr by 2055 (HVAC capex compounding) — expect insurance premiums to compound above CPI over the hold.
Questions for the listing agent
- Property tax is high relative to price — has the assessment been appealed recently, and will the sale trigger a re-assessment?
- Is there a deadline driving the sale (1031 exchange, divorce, estate, relocation)? That informs how much negotiation room exists.
- Schools are D-rated, which usually means shorter tenancies and higher turnover. Who's the typical renter profile here, and what's been the actual vacancy rate?
- Crime grade is F in this area — have there been break-ins, vandalism, or insurance claims at this property in the last 3 years? What carrier currently insures it and at what premium?
- What's the average days-on-market for RENTAL listings here right now (not sales)? A rising rental-DOM trend means longer vacancies and softer asking-rent achievability than the comps imply.
- What's the recent tenant-quality profile in this submarket — average credit score on applications, eviction rate, late-payment / NSF rate, and stable-employment percentage? A property-management company in the area should have these aggregated.
- How much new for-sale + rental construction is in the pipeline within 1–3 miles? Heavy new supply typically softens prices + rents 12–24 months out; constrained supply supports both.
Investment metrics
- 1% rule
- 3.07% ✓
- Cap rate
- 24.97%
- Cash-on-cash
- 66.69%
- DSCR
- 3.97
- GRM
- 2.7
CMA / ARV
No comps found within radius.
Projected returns pro-forma
4.53% appreciation · 3.0% rent growth · sell at horizon
- IRR
- 72.9%
- Equity multiple
- 5.27×
- Total profit
- $44,861
- Equity at exit
- $20,179
- IRR
- 71.2%
- Equity multiple
- 10.91×
- Total profit
- $104,101
- Equity at exit
- $33,970
Cash invested: $10,500 (down + closing). Projections, not guarantees.
Landlord ↔ Tenant lean methodology
- Overall (STATE)
- 87 Strongly Landlord-Friendly
- State Texas
- 87 Strongly Landlord-Friendly · R+5
- County
- — inherits STATE
- City
- — inherits STATE
ZIP-level market 78570
- Home prices YoY
- 1.9%
- Active inventory
- 390
- Price-to-rent
- 2.7×
Monthly cashflow live
- Estimated rent
- $1,150 medium interval (Pro) →
- Mortgage (P&I)
- −$197
- Tax from tax record
- −$113 /mo · $1,352/yr
- Insurance
- −$16
- HOA
- −$0
- Vacancy / Maint / Mgmt
- −$242
- Net cashflow
- $584
Break-even live
UW: 25.0% down · 7.5% · 30yr · 1.5% tax · 5.0% vac · 8.0% maint · 8.0% mgmt
Financing live
Cash to close
- Down payment
- $9,375
- Closing costs
- $1,125
- Reserves months
- —
- Total cash needed
- —
Loan-product check · same deal, 3 products live
Conventional
25% down · 7.5% · 30yr
- Down + closing
- —
- Monthly P&I
- —
- Monthly cashflow
- —
- DSCR
- —
- Eligible?
- —
Personal DTI + credit; lowest rate.
DSCR
20% down · 8.5% · 30yr
- Down + closing
- —
- Monthly P&I
- —
- Monthly cashflow
- —
- DSCR
- —
- Eligible?
- —
No personal income docs; deal must DSCR.
Hard money
10% down · 12.0% · 12mo
- Down + closing
- —
- Monthly P&I
- —
- Monthly cashflow
- —
- DSCR
- —
- Eligible?
- —
Short-term bridge; refi at stabilization.
Rent comps 1 comps
| Address | Beds | Baths | Sqft | Rent | $/sqft | DOM | Units | Dist |
|---|---|---|---|---|---|---|---|---|
| 1604 Shadow CRK Unit 1 Weslaco, TX | 2.0 | 2.0 | 4100 | $1,150 | $0.28 | 44d | 1 | 1.07mi |
Listing history 13 events
-
2026-06-18days on market $37,500 Active 16 DOM
-
2026-06-17days on market $37,500 Active 15 DOM
-
2026-06-16days on market $37,500 Active 14 DOM
-
2026-06-15days on market $37,500 Active 13 DOM
-
2026-06-15days on market $37,500 Active 12 DOM
-
2026-06-13days on market $37,500 Active 11 DOM
-
2026-06-12days on market $37,500 Active 10 DOM
-
2026-06-09days on market $37,500 Active 7 DOM
-
2026-06-08days on market $37,500 Active 6 DOM
-
2026-06-08days on market $37,500 Active 5 DOM
-
2026-06-07days on market $37,500 Active 4 DOM
-
2026-06-03remarks 687-char remark
-
2026-06-03$37,500 Active 1 DOM
ⓘ Source: listings_history table (triggers on properties + properties_extension) + one-shot
backfill from property_details.listing_events for pre-trigger history.
Tax reassessment forecast TX · Resets to sale price
- Current annual tax
- $1,352 · $113/mo
- Projected year-2 tax
- $1,352 · $113/mo
- Expected delta
- $0/yr ($0/mo · 0.0%)
ⓘ Screening estimate from a state-policy table — verify with the county assessor before closing.
Climate risk First Street
- Flood 1/10 Low FEMA zone X (shaded) · 0% chance over 30 yrs
- Wildfire 2/10 Low
- Heat 9/10 Extreme 7 d/yr ≥110°F today · 23 d/yr by 30 yrs out
- Wind 9/10 Extreme 99% chance of damaging wind over 30 yrs
- Air quality 1/10 Low 0 unhealthy d/yr today · 0 by 30 yrs out
Nearby sold comps map
Loading sold comps map…
Walkable amenities ~0.75 mi
Loading nearby amenities…
Taxation est. · year 1
- Rental income
- $13,800
- − Mortgage interest
- −$2,101
- − Property taxes
- −$1,352
- − Insurance
- −$188
- − Repairs & maintenance
- −$1,104
- − Management
- −$1,104
- − Depreciation
- −$1,091
- Taxable income
- $6,861
- Est. tax owed @ 24.0%
- −$1,647
- After-tax cash flow
- $5,356/yr
For passive investors: Depreciation is non-cash, so a rental often shows a tax loss while cash-flowing — sheltering income. Rental losses are passive: they offset passive income freely, and up to $25,000/yr can offset ordinary (W-2) income if you actively participate and your MAGI is under $100k (phasing out to $0 by $150k); unused losses carry forward. On sale, claimed depreciation is recaptured at up to 25%, and gains may owe capital-gains tax (a 1031 exchange can defer both). Figures are a year-1 estimate at your 24.0% rate — not tax advice; consult a CPA.
Schools (NCES district)
- District
- Weslaco ISD
- NCES district ID
- 4844960
- Math proficiency
- 23% ▼ -29.00%
- Reading proficiency
- 31% ▼ -9.00%
- Median HH income
- $32,867
- Composite
- 22.05/100
- National rank
- #8196
- State rank
- #705 of 826 in TX
Livability — Mercedes
- Score
- 67/100
- State rank
- #547
- US rank
- #10619
Category grades
Schools grade is shown separately in the Schools card above.
Census & demographics
- Census place
- Mercedes, TX
- City population
- 33,596
- Population (ZIP)
- 33,596
Population outlook (Hidalgo County) Hauer SSP2
- Today (2025)
- 955,232 people
- By 2030
- 1,009,774 · +5.7%
- By 2040
- 1,120,332 · +17.3%
- By 2050
- 1,225,036 · +28.2%
- By 2075
- 1,439,189 · +50.7%
- By 2100
- 1,533,429 · +60.5%
Race, ethnicity, and origin ACS 2023
- Neighborhood character
- Predominantly Hispanic (96%)
- Race & ethnicity
- Hispanic / Latino 96% Two or more races 44% White 4%
- Hispanic origin (detail)
- Mexican 91%
- Foreign-born
- 20% · Canada
- Languages at home
- 18% English-only · Spanish 82%
Political lean MEDSL · Hidalgo
- 2024 margin
- Toss-up / Even · D 48.1% · R 51.0%
- 2008→2024 swing
- -41.6pp toward R · 2008: 38.7pp · 2024: -2.9pp
- All cycles
- 2024: R+2.9 2020: D+17.1 2016: D+40.5 2012: D+41.8 2008: D+38.7
Not yet ingested
- Civics
- —
Market trends
- HPI YoY
- ▲ 4.53%
- Current HPI
- 238.8386
- Rent YoY
- —
- Metro
- —
- State GDP YoY
- ▲ 3.95%
- F500 in state
- 110
Industry mix (Fortune 500 HQ in TX)
| Industry | F500 HQs | Revenue |
|---|---|---|
| Energy | 16 | $1,198B |
|
||
| Technology | 5 | $198B |
|
||
| Engineering / Construction | 4 | $72B |
|
||
| Energy Services | 3 | $60B |
|
||
| Utilities | 3 | $41B |
|
||
| Healthcare | 2 | $330B |
|
||
Price history
+7.4% since first listed16 events — show timeline
- 2026-06-02 Listed $37,500 MCALLENMLS
- 2025-11-21 Sold (MLS) — MCALLENMLS
- 2025-11-11 Pending — RGVMLS
- 2025-11-06 Sold (Public Records) — Public Records
- 2025-11-06 Sold (MLS) — RGVMLS
- 2025-08-21 Price Changed $46,000 RGVMLS
- 2025-08-21 Price Changed $46,000 MCALLENMLS
- 2025-05-19 Price Changed $52,500 RGVMLS
- 2025-05-16 Listed $55,500 RGVMLS
- 2025-05-16 Listed $52,500 MCALLENMLS
- 2023-02-12 Price Changed $48,000 MCALLENMLS
- 2022-12-05 Price Changed $53,500 MCALLENMLS
- 2022-06-27 Listed $58,000 MCALLENMLS
- 2021-11-09 Sold (Public Records) — Public Records
- 2020-01-16 Sold (Public Records) — Public Records
- 2015-08-31 Price Changed $34,900 MCALLENMLS
Property tax history
+7.5%/yrLatest (2025): $1,352 · +1.7% YoY. Source: county tax records.
Cash-flow waterfall
monthlySold comps — $/sqft
last 12 mo · ≤1 miLoading sold comps…