 Duplex
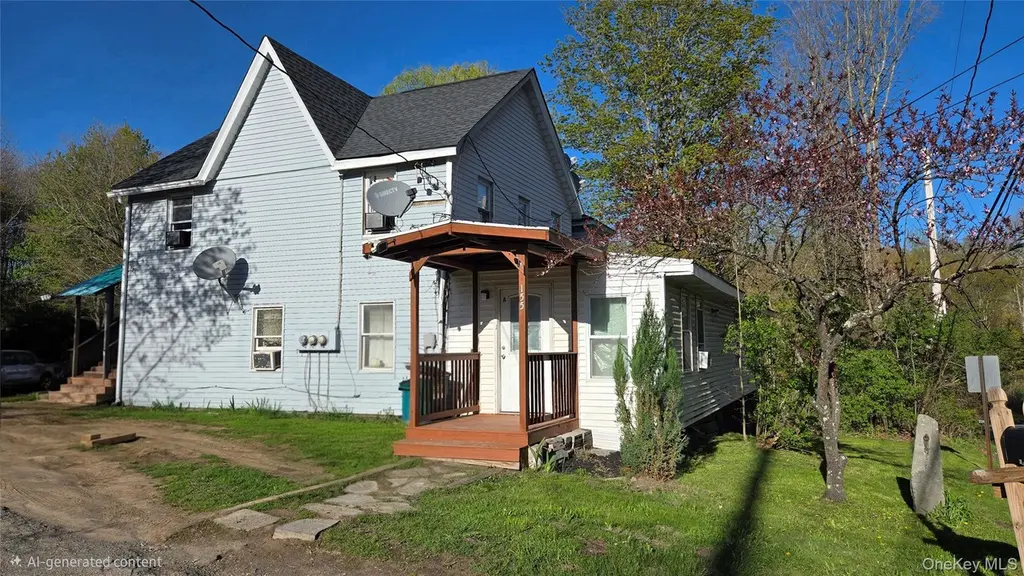
155 Huckleberry Tpke · Plattekill, NY
Flood risk 1/10 · Minimal
- FEMA flood zone
- X (unshaded)
- Chance of flooding over 30 yrs
- 0.0%
- Est. flood insurance / yr
- $473 – $860
Fire risk 3/10 · Minor
- Est. fire insurance / yr
- $691 – $1,283
Heat risk 4/10 · Minor
- Hot days now (above 97°F)
- 7 days/yr
- Hot days in 30 yrs
- 15 days/yr
Wind risk 4/10 · Minor
- Chance of severe wind over 30 yrs
- 11.0%
Air-quality risk 2/10 · Minimal
- Unhealthy air days now
- 1 days/yr
- Unhealthy air days in 30 yrs
- 2 days/yr
Risk factors via First Street. Map © Google.
Why this score? — see what drove the B grade
The composite is a weighted blend of 9 inputs, each scored 0–100. Each bar is that input's sub-score; the figure is the points it added to the 100-point composite (weight × sub-score).
- Cash flow +25.7/30.0
- Appreciation +10.0/10.0
- DSCR +8.6/10.0
- ARV discount +7.5/15.0
- 1% rule +7.3/10.0
- Schools +4.9/10.0
- Livability +3.1/5.0
- Rent growth +2.5/5.0
- Condition / age +2.5/5.0
$319,925
🖨 Deal sheet (PDF) 📄 Offer letter ✓ Due diligence
Multi-family units
County records classify this as Multi-Family (2-4 Unit). Listing-text estimate: 2 units. confirmed
Listing remarks
This is a 2 family home consisting of a first floor and second floor apartments, this home is sitting on . 46 acre with a nice yard in the rear, large driveway so there is plenty of parking. The first floor unit has 3 bedrooms, living room, bathroom with laundry and a kitchen plus a storage area. The second floor has 2 bedrooms, living room, bathroom and a kitchen. Both units are rented at this moment and the tenants would like to stay if possible. The leases should run out in the next few months unless you decide to resign them. Tenants pay all utilities, landlord pays taxes and water. The first floor rent is $1550 and the second floor rent is $1200. No lockbox.
Key facts
- Large driveway
- Storage area
- 0.46 acre lot
Tags
Property features AI
Exterior
- Parking: Driveway parking; Total of 10 parking spaces
- Utilities: Septic tank sewer; Cable available; Phone available; Private trash collection; Water available
- Home design: Duplex; Fixer condition
- Construction: Frame construction
- Exterior features: Frame construction; No waterfront; No additional structures
Interior
- Kitchen: Eat-in kitchen
- Bedrooms: One 3-bedroom unit (multi-unit property)
- Flooring: Carpet; Vinyl
- Heating & cooling: Electric heating; No central cooling
- Interior features: First-floor bedroom; First-floor full bathroom; Eat-in kitchen; Washer/dryer hookup; Basement with crawl space and storage
- Laundry & utility: In-unit laundry hookup
Neighborhood map
What this means for you Summary
Snapshot
- This is a 1×3bd/1ba + 1×2bd/1ba units multifamily listed at $320k.
Deal economics
- At list price, monthly cash flow is $769 ($9k/yr) — positive. Per door: $384/mo.
- The deal already cash-flows at list — no discount required.
- Meets the 1% rule at list price ($4k rent vs $320k).
- Recommended offer: $310k (3.0% below list) — sets the bar for market timing.
- Cap rate 9.2% vs local median 1.9% in Plattekill — top-decile yield for the area; either an underpriced asset or a hidden risk that comps aren't pricing in. Stress-test before assuming the spread holds.
Location & tenants
- Location reads 62/100 on livability (#831 in NY) — a middle-class / working-renter tenant base. Strengths: crime A, employment A, housing B; Watch: cost of living D+, amenities F, commute F.
- Wallkill Central School District (suburban): math 54% / reading 56% proficiency, ranked #279 of 590 in NY (top 47%) — acceptable for families but not a draw, mixed tenant base, ~2y average lease.
- Zoned schools: Plattekill Elementary School (math 22% / reading 57%, grade F, #1,444 of 2,108 statewide, top 71%, 405 students, 43% FRL); John G Borden Middle School (math 32% / reading 47%, grade F, #418 of 729 statewide, top 59%, 432 students, 37% FRL); Wallkill Senior High School (math 97% / reading 75%, grade A, #347 of 1,100 statewide, top 32%, 1,004 students, 34% FRL).
- Market conditions: 100 active listings in the ZIP; 464 units permitted in Ulster County in 2024 (170 in 5+ unit buildings).
Forward outlook
- In year one you build about $34k of equity ($2k loan paydown + $32k appreciation (10.0% local appreciation)).
- Ulster County population projected at -14% by 2050 — secular population decline; favor cash flow + early exit over multi-decade hold.
- At projected returns (10.0% appreciation + 3.0% rent growth), your $90k cash investment doubles in ~2 years — after that, you're playing with house money.
- By year 2, paydown + projected appreciation supports a ~$55k cash-out refi (75% LTV) — recoverable capital for the next deal without selling this one.
Negotiation context
- It's been on market 50 days — a 3% lower offer ($310k) is reasonable based on typical stale-listing flexibility.
- 8 sale attempts since 13y ago with the ask held roughly flat each time — persistent listings suggest the price (not the market) is what's stuck; bring a comps-based counter.
- Current owner paid $153k; list at $320k implies a 109% gain — meaningful room to come down on a strong offer.
Risks & watch-outs
- Watch-outs: built in 1912 — expect roof / HVAC / electrical / plumbing capex.
Questions for the listing agent
- It's been on market 50 days. Have you received any prior offers? Is the seller open to a 3% concession, seller financing, or rate buy-down credit?
- Can we see the unit-by-unit rent roll, current vacancy, and any below-market leases? What's the average tenancy length?
- What capital expenditures (roof, boiler, parking lot, exteriors) have been made in the last 5 years, and what's planned in the next 2?
- Built in 1912 — when were the roof, HVAC, electrical panel, plumbing, and water heater last replaced?
- Is there a deadline driving the sale (1031 exchange, divorce, estate, relocation)? That informs how much negotiation room exists.
- Schools are D-rated, which usually means shorter tenancies and higher turnover. Who's the typical renter profile here, and what's been the actual vacancy rate?
- What's the average days-on-market for RENTAL listings here right now (not sales)? A rising rental-DOM trend means longer vacancies and softer asking-rent achievability than the comps imply.
- What's the recent tenant-quality profile in this submarket — average credit score on applications, eviction rate, late-payment / NSF rate, and stable-employment percentage? A property-management company in the area should have these aggregated.
- How much new apartment / multifamily construction is in the pipeline within 1–3 miles? Heavy new supply (>2% of stock underway) typically softens rents 12–24 months out; light construction supports rent growth.
Investment metrics
- 1% rule
- 1.23% ✓
- Cap rate
- 9.18%
- Cash-on-cash
- 10.30%
- DSCR
- 1.46
- GRM
- 6.8
CMA / ARV
- ARV (median comp)
- $807,834
- List price
- $319,925
- Delta
- -60.40%
- Verdict
- UNDERPRICED
- Comps
- 3 within 2.0 mi
Projected returns pro-forma
10.0% appreciation · 3.0% rent growth · sell at horizon
- IRR
- 31.8%
- Equity multiple
- 3.49×
- Total profit
- $223,329
- Equity at exit
- $288,214
- IRR
- 27.5%
- Equity multiple
- 7.92×
- Total profit
- $619,439
- Equity at exit
- $621,544
Cash invested: $89,579 (down + closing). Projections, not guarantees.
Landlord ↔ Tenant lean methodology
- Overall (STATE)
- 15 Strongly Tenant-Friendly
- State New York
- 15 Strongly Tenant-Friendly · D+10
- County
- — inherits STATE
- City
- — inherits STATE
ZIP-level market 12589
- Home prices YoY
- 5.2%
- Active inventory
- 100
- Price-to-rent
- 13.1×
Monthly cashflow live
- Estimated rent
- $3,929 medium interval (Pro) →
- Mortgage (P&I)
- −$1,678
- Tax from tax record
- −$524 /mo · $6,291/yr
- Insurance
- −$133
- HOA
- −$0
- Vacancy / Maint / Mgmt
- −$825
- Net cashflow
- $769
Break-even live
Sensitivity live
| Price | -10% $950 | -5% $859 | +0% $769 | +5% $678 | +10% $588 |
|---|---|---|---|---|---|
| Rent | -10% $458 | -5% $613 | +0% $769 | +5% $924 | +10% $1,079 |
| Rate | -1.0pp $930 | -0.5pp $850 | base $769 | +0.5pp $686 | +1.0pp $601 |
2-unit breakdown (identical units grouped — click to expand)
| Units | Beds | Baths | Est. rent |
|---|---|---|---|
| 1× unit | 3 | 1 | $2,028 |
| 1× unit | 2 | 1 | $1,900 |
| Total (2 units) | $3,929 | ||
UW: 25.0% down · 7.5% · 30yr · 1.5% tax · 5.0% vac · 8.0% maint · 8.0% mgmt
Financing live
Cash to close
- Down payment
- $79,981
- Closing costs
- $9,598
- Reserves months
- —
- Total cash needed
- —
Loan-product check · same deal, 3 products live
Conventional
25% down · 7.5% · 30yr
- Down + closing
- —
- Monthly P&I
- —
- Monthly cashflow
- —
- DSCR
- —
- Eligible?
- —
Personal DTI + credit; lowest rate.
DSCR
20% down · 8.5% · 30yr
- Down + closing
- —
- Monthly P&I
- —
- Monthly cashflow
- —
- DSCR
- —
- Eligible?
- —
No personal income docs; deal must DSCR.
Hard money
10% down · 12.0% · 12mo
- Down + closing
- —
- Monthly P&I
- —
- Monthly cashflow
- —
- DSCR
- —
- Eligible?
- —
Short-term bridge; refi at stabilization.
Listing history 34 events
-
2026-06-18days on market $319,925 Active 50 DOM
-
2026-06-17days on market $319,925 Active 49 DOM
-
2026-06-16days on market $319,925 Active 48 DOM
-
2026-06-15days on market $319,925 Active 47 DOM
-
2026-06-14days on market $319,925 Active 45 DOM
-
2026-06-13days on market $319,925 Active 44 DOM
-
2026-06-10days on market $319,925 Active 42 DOM
-
2026-06-09days on market $319,925 Active 41 DOM
-
2026-06-08days on market $319,925 Active 40 DOM
-
2026-06-07days on market $319,925 Active 39 DOM
-
2026-06-05days on market $319,925 Active 36 DOM
-
2026-06-03days on market $319,925 Active 35 DOM
-
2026-06-02days on market $319,925 Active 34 DOM
-
2026-06-01days on market $319,925 Active 33 DOM
-
2026-05-31days on market $319,925 Active 32 DOM
-
2026-05-30days on market $319,925 Active 31 DOM
-
2026-04-29$319,925 Active 671-char remark
-
2026-04-23historical
-
2026-03-24$319,900 Active
-
2026-02-22historical
-
2026-02-18status Active
-
2026-01-14$359,000 Active
-
2024-06-02historical $1,150
-
2024-05-21$1,150
-
2021-08-16soldstatus $153,000
-
2021-07-22soldstatus $153,000
-
2020-05-27$159,900
-
2015-11-27soldstatus $72,000
-
2015-11-18soldstatus $72,000
-
2014-12-29$99,000
-
2014-09-22historical
-
2013-09-30$139,000
-
2000-03-16soldstatus $41,000
-
1985-11-29soldstatus $55,000
ⓘ Source: listings_history table (triggers on properties + properties_extension) + one-shot
backfill from property_details.listing_events for pre-trigger history.
Tax reassessment forecast NY · Partial reset (capped growth)
- Current annual tax
- $6,291 · $524/mo
- Projected year-2 tax
- $6,291 · $524/mo
- Expected delta
- $0/yr ($0/mo · 0.0%)
ⓘ Screening estimate from a state-policy table — verify with the county assessor before closing.
Climate risk First Street
- Flood 1/10 Low FEMA zone X (unshaded) · 0% chance over 30 yrs
- Wildfire 3/10 Moderate
- Heat 4/10 Moderate 7 d/yr ≥97°F today · 15 d/yr by 30 yrs out
- Wind 4/10 Moderate 11% chance of damaging wind over 30 yrs
- Air quality 2/10 Low 1 unhealthy d/yr today · 2 by 30 yrs out
Nearby sold comps map
Loading sold comps map…
Walkable amenities ~0.75 mi
Loading nearby amenities…
Taxation est. · year 1
- Rental income
- $47,148
- − Mortgage interest
- −$17,921
- − Property taxes
- −$6,291
- − Insurance
- −$1,600
- − Repairs & maintenance
- −$3,772
- − Management
- −$3,772
- − Depreciation
- −$9,307
- Taxable income
- $4,486
- Est. tax owed @ 24.0%
- −$1,077
- After-tax cash flow
- $8,147/yr
For passive investors: Depreciation is non-cash, so a rental often shows a tax loss while cash-flowing — sheltering income. Rental losses are passive: they offset passive income freely, and up to $25,000/yr can offset ordinary (W-2) income if you actively participate and your MAGI is under $100k (phasing out to $0 by $150k); unused losses carry forward. On sale, claimed depreciation is recaptured at up to 25%, and gains may owe capital-gains tax (a 1031 exchange can defer both). Figures are a year-1 estimate at your 24.0% rate — not tax advice; consult a CPA.
Schools (NCES district)
- District
- Wallkill Central School District
- NCES district ID
- 3629790
- Math proficiency
- 54% ▼ -7.00%
- Reading proficiency
- 56% ▲ 2.00%
- Median HH income
- $72,323
- Composite
- 49.06/100
- National rank
- #2057
- State rank
- #279 of 590 in NY
Livability — Plattekill
- Score
- 62/100
- State rank
- #831
- US rank
- #16115
Category grades
Schools grade is shown separately in the Schools card above.
Census & demographics
- Census place
- Plattekill, NY
- Population (ZIP)
- 19,639
Population outlook (Ulster County) Hauer SSP2
- Today (2025)
- 175,887 people
- By 2030
- 171,876 · -2.3%
- By 2040
- 161,771 · -8.0%
- By 2050
- 151,470 · -13.9%
- By 2075
- 133,023 · -24.4%
- By 2100
- 113,504 · -35.5%
Race, ethnicity, and origin ACS 2023
- Neighborhood character
- Diverse neighborhood (Simpson 0.55)
- Race & ethnicity
- White 63% Hispanic / Latino 20% Two or more races 13% Black 9%
- Hispanic origin (detail)
- Mexican 4% Puerto Rican 8% Dominican 1%
- Common ancestry
- Romanian 3% Lithuanian 1% Slovak 1%
- Foreign-born
- 8% · Canada
- Languages at home
- 81% English-only · Spanish 15% Other Indo-European 2%
Political lean MEDSL · Ulster
- 2024 margin
- D (+18.7) · D 59.3% · R 40.7%
- 2008→2024 swing
- -4.9pp toward R · 2008: 23.6pp · 2024: 18.7pp
- All cycles
- 2024: D+18.7 2020: D+20.9 2016: D+9.1 2012: D+21.9 2008: D+23.6
Not yet ingested
- Civics
- —
Market trends
- HPI YoY
- ▲ 15.97%
- Current HPI
- 323.1502
- Rent YoY
- —
- Metro
- —
- State GDP YoY
- ▲ 2.60%
- F500 in state
- 92
Industry mix (Fortune 500 HQ in NY)
| Industry | F500 HQs | Revenue |
|---|---|---|
| Financial Services | 10 | $950B |
|
||
| Consumer Goods | 9 | $162B |
|
||
| Insurance | 4 | $225B |
|
||
| Telecommunications | 2 | $144B |
|
||
| Pharmaceuticals | 2 | $112B |
|
||
| Media / Entertainment | 2 | $69B |
|
||
Price history
+481.7% since first listed18 events — show timeline
- 2026-04-29 Listed $319,925 OneKey® MLS as Distributed by MLS Grid
- 2026-04-23 Listing Removed — OneKey® MLS as Distributed by MLS Grid
- 2026-03-24 Listed $319,900 OneKey® MLS as Distributed by MLS Grid
- 2026-02-22 Listing Removed — OneKey® MLS as Distributed by MLS Grid
- 2026-02-18 Relisted — OneKey® MLS as Distributed by MLS Grid
- 2026-01-14 Listed $359,000 OneKey® MLS as Distributed by MLS Grid
- 2024-06-02 Rental Removed $1,150 ONEKEY
- 2024-05-21 Listed for Rent $1,150 ONEKEY
- 2021-08-16 Sold (Public Records) $153,000 Public Records
- 2021-07-22 Sold (MLS) $153,000 OneKey® MLS as Distributed by MLS Grid
- 2020-05-27 Listed $159,900 OneKey® MLS as Distributed by MLS Grid
- 2015-11-27 Sold (Public Records) $72,000 Public Records
- 2015-11-18 Sold (MLS) $72,000 OneKey® MLS as Distributed by MLS Grid
- 2014-12-29 Listed $99,000 OneKey® MLS as Distributed by MLS Grid
- 2014-09-22 Listing Removed — OneKey® MLS as Distributed by MLS Grid
- 2013-09-30 Listed $139,000 OneKey® MLS as Distributed by MLS Grid
- 2000-03-16 Sold (Public Records) $41,000 Public Records
- 1985-11-29 Sold (Public Records) $55,000 Public Records
Property tax history
+1.9%/yrLatest (2025): $6,291 · -0.9% YoY. Source: county tax records.
Cash-flow waterfall
monthlySold comps — $/sqft
last 12 mo · ≤1 miLoading sold comps…