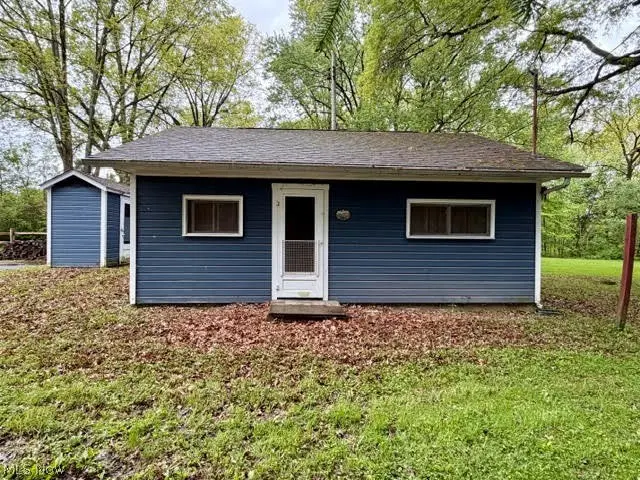
6019 Arrowhead Dr · Cortland, OH
Flood risk 1/10 · Minimal
- FEMA flood zone
- X (unshaded)
- Chance of flooding over 30 yrs
- 0.0%
- Est. flood insurance / yr
- $507 – $1,088
Fire risk 1/10 · Minimal
- Est. fire insurance / yr
- $713 – $1,323
Heat risk 2/10 · Minimal
- Hot days now (above 97°F)
- 7 days/yr
- Hot days in 30 yrs
- 17 days/yr
Wind risk 1/10 · Minimal
- Chance of severe wind over 30 yrs
- —
Air-quality risk 3/10 · Minor
- Unhealthy air days now
- 2 days/yr
- Unhealthy air days in 30 yrs
- 5 days/yr
Risk factors via First Street. Map © Google.
Why this score? — see what drove the B+ grade
The composite is a weighted blend of 9 inputs, each scored 0–100. Each bar is that input's sub-score; the figure is the points it added to the 100-point composite (weight × sub-score).
- Cash flow +28.2/30.0
- ARV discount +15.0/15.0
- DSCR +10.0/10.0
- 1% rule +7.8/10.0
- Schools +6.9/10.0
- Livability +4.2/5.0
- Rent growth +2.5/5.0
- Condition / age +2.2/5.0
- Appreciation +0.0/10.0
$65,000
🖨 Deal sheet 📄 Offer letter ✓ Due diligence
Listing remarks
Tucked beside the US Army Corp of Engineers land with access to Mosquito Lake, this quaint rustic cabin retreat offers the perfect weekend getaway for fishing, boating, and nature lovers alike. Located on Arrowhead Dr. , also know as 0 (zero) Private Dr, this unique property is approximately is approximately a half mile from the Mosquito Creek Lake Causeway and public boat ramp, providing convenient access to some of the area’s best outdoor recreation. Launch your non-trailered kayak or canoe directly from the property and enjoy peaceful days exploring the lake. Inside, you’ll find an open-concept living room & eat-in kitchen area plus a bedroom. Electric is already connec
Key facts
- Public boat ramp
- Pellet stove
- Cabin retreat
Tags
Property features AI
Finance
- Other: Year built reported from public records
Exterior
- Parking: Outdoor parking
- Utilities: No sewer available; No water available
- Home design: Single-story home; Has a view; Above-grade finished area approximately 528
- Construction: Wood siding exterior; Asphalt/fiberglass roof
- Exterior features: Shed on the property; Waterfront; Lot dimensions approximately 40 x 42
Interior
- Kitchen: Eat-in kitchen on the first floor (approx. 23 x 11); Microwave; Range; Refrigerator
- Bedrooms: One bedroom on the first floor (approx. 10 x 9)
- Flooring: Concrete flooring in bedroom; Wood flooring in kitchen and living room
- Interior features: Total of 3 rooms; Has a view
Neighborhood map
What this means for you Summary
Snapshot
- This is a 1-bed/?-bath single-family listed at $65k. Condition is rated fair.
Deal economics
- At list price, monthly cash flow is $207 ($2k/yr) — positive.
- The deal already cash-flows at list — no discount required.
- Meets the 1% rule at list price ($831 rent vs $65k).
- Recommended offer: $63k (3.0% below list) — sets the bar for market timing.
- Cap rate 10.1% vs local median 3.2% in Cortland — top-decile yield for the area; either an underpriced asset or a hidden risk that comps aren't pricing in. Stress-test before assuming the spread holds.
Location & tenants
- Location reads 83/100 on livability (#64 in OH, #960 nationally) — a professional / high-income tenant draw. Strengths: schools A+, crime A+, cost of living A+; Watch: commute F.
- Maplewood Local (rural): math 83% / reading 81% proficiency, ranked #51 of 656 in OH (top 8%) — strong family-tenant draw, lease renewals of 3-5y typical.
- Market conditions: 70 active listings in the ZIP; 129 units permitted in Trumbull County in 2024 (0 in 5+ unit buildings).
- This rent is only 16% of the median local income ($63k/yr) — well below the 30% rent-burden line; pricing power to push rent on renewal without tenant pushback.
Forward outlook
- Local home prices are declining (-3.0%/yr); year-one equity from $449 of loan paydown is wiped out by about $2k of value loss. Plan a longer hold.
- Trumbull County population projected at -22% by 2050 — secular population decline; favor cash flow + early exit over multi-decade hold.
- At projected returns (-3.0% appreciation + 3.0% rent growth), your $18k cash investment doubles in ~9 years — after that, you're playing with house money.
Negotiation context
- It's been on market 34 days — a 3% lower offer ($63k) is reasonable based on typical stale-listing flexibility.
Risks & watch-outs
- Watch-outs: built in 1950 — expect roof / HVAC / electrical / plumbing capex.
Questions for the listing agent
- It's been on market 34 days. Have you received any prior offers? Is the seller open to a 3% concession, seller financing, or rate buy-down credit?
- Have any recent inspections been done? Can we get a copy of the seller's disclosures and any deferred-maintenance estimates?
- Built in 1950 — when were the roof, HVAC, electrical panel, plumbing, and water heater last replaced?
- Is there a deadline driving the sale (1031 exchange, divorce, estate, relocation)? That informs how much negotiation room exists.
- Schools are A-rated — typically a magnet for longer-tenancy family renters. What's the average tenant stay here, and is there a school-zone premium baked into asking?
- What's the average days-on-market for RENTAL listings here right now (not sales)? A rising rental-DOM trend means longer vacancies and softer asking-rent achievability than the comps imply.
- What's the recent tenant-quality profile in this submarket — average credit score on applications, eviction rate, late-payment / NSF rate, and stable-employment percentage? A property-management company in the area should have these aggregated.
- How much new for-sale + rental construction is in the pipeline within 1–3 miles? Heavy new supply typically softens prices + rents 12–24 months out; constrained supply supports both.
Investment metrics
- 1% rule
- 1.28% ✓
- Cap rate
- 10.11%
- Cash-on-cash
- 13.65%
- DSCR
- 1.61
- GRM
- 6.5
CMA / ARV
- ARV (median comp)
- $79,617
- List price
- $65,000
- Delta
- -18.36%
- Verdict
- UNDERPRICED
- Comps
- 2 within 1.0 mi
Show comp detail 1 sale within ~0.75 mi
| Address | Dist | Beds/Ba | Sqft | Sold | Price | $/sf | Match |
|---|---|---|---|---|---|---|---|
| 6101 Private Dr | 0.27mi | 2/1.0 (+1) | 528 (0%) | 8mo | $118,500 | $224 | 76 |
Match score weights: distance 35% · size 25% · config 20% · recency 20%. Top-matched comps best support the ARV.
Projected returns pro-forma
-3.0% appreciation · 3.0% rent growth · sell at horizon
- IRR
- 3.8%
- Equity multiple
- 1.15×
- Total profit
- $2,660
- Equity at exit
- $9,692
- IRR
- 13.3%
- Equity multiple
- 2.06×
- Total profit
- $19,340
- Equity at exit
- $5,620
Cash invested: $18,200 (down + closing). Projections, not guarantees.
Landlord ↔ Tenant lean methodology
- Overall (STATE)
- 73 Landlord-Friendly
- State Ohio
- 73 Landlord-Friendly · R+6
- County
- — inherits STATE
- City
- — inherits STATE
ZIP-level market 44410
- Home prices YoY
- -23.0%
- Active inventory
- 70
- Price-to-rent
- 6.5×
Monthly cashflow live
- Estimated rent
- $831 medium interval (Pro) →
- Mortgage (P&I)
- −$341
- Tax est. 1.5%
- −$81 /mo · $975/yr
- Insurance
- −$27
- HOA
- −$0
- Vacancy / Maint / Mgmt
- −$174
- Net cashflow
- $207
Break-even live
UW: 25.0% down · 7.5% · 30yr · 1.5% tax · 5.0% vac · 8.0% maint · 8.0% mgmt
Financing live
Cash to close
- Down payment
- $16,250
- Closing costs
- $1,950
- Reserves months
- —
- Total cash needed
- —
Loan-product check · same deal, 3 products live
Conventional
25% down · 7.5% · 30yr
- Down + closing
- —
- Monthly P&I
- —
- Monthly cashflow
- —
- DSCR
- —
- Eligible?
- —
Personal DTI + credit; lowest rate.
DSCR
20% down · 8.5% · 30yr
- Down + closing
- —
- Monthly P&I
- —
- Monthly cashflow
- —
- DSCR
- —
- Eligible?
- —
No personal income docs; deal must DSCR.
Hard money
10% down · 12.0% · 12mo
- Down + closing
- —
- Monthly P&I
- —
- Monthly cashflow
- —
- DSCR
- —
- Eligible?
- —
Short-term bridge; refi at stabilization.
Listing history 15 events
-
2026-06-18days on market $65,000 Active 34 DOM
-
2026-06-17days on market $65,000 Active 33 DOM
-
2026-06-16days on market $65,000 Active 32 DOM
-
2026-06-15days on market $65,000 Active 31 DOM
-
2026-06-13days on market $65,000 Active 29 DOM
-
2026-06-12days on market $65,000 Active 28 DOM
-
2026-06-09days on market $65,000 Active 25 DOM
-
2026-06-08days on market $65,000 Active 24 DOM
-
2026-06-08days on market $65,000 Active 23 DOM
-
2026-06-05days on market $65,000 Active 21 DOM
-
2026-06-04days on market $65,000 Active 19 DOM
-
2026-06-02days on market $65,000 Active 18 DOM
-
2026-06-01days on market $65,000 Active 17 DOM
-
2026-05-31days on market $65,000 Active 16 DOM
-
2026-05-15$65,000 Active 1042-char remark
ⓘ Source: listings_history table (triggers on properties + properties_extension) + one-shot
backfill from property_details.listing_events for pre-trigger history.
Climate risk First Street
- Flood 1/10 Low FEMA zone X (unshaded) · 0% chance over 30 yrs
- Wildfire 1/10 Low
- Heat 2/10 Low 7 d/yr ≥97°F today · 17 d/yr by 30 yrs out
- Wind 1/10 Low
- Air quality 3/10 Moderate 2 unhealthy d/yr today · 5 by 30 yrs out
Nearby sold comps map
Loading sold comps map…
Walkable amenities ~0.75 mi
Loading nearby amenities…
Taxation est. · year 1
- Rental income
- $9,967
- − Mortgage interest
- −$3,641
- − Property taxes
- −$975
- − Insurance
- −$325
- − Repairs & maintenance
- −$797
- − Management
- −$797
- − Depreciation
- −$1,891
- Taxable income
- $1,540
- Est. tax owed @ 24.0%
- −$370
- After-tax cash flow
- $2,114/yr
For passive investors: Depreciation is non-cash, so a rental often shows a tax loss while cash-flowing — sheltering income. Rental losses are passive: they offset passive income freely, and up to $25,000/yr can offset ordinary (W-2) income if you actively participate and your MAGI is under $100k (phasing out to $0 by $150k); unused losses carry forward. On sale, claimed depreciation is recaptured at up to 25%, and gains may owe capital-gains tax (a 1031 exchange can defer both). Figures are a year-1 estimate at your 24.0% rate — not tax advice; consult a CPA.
Condition & rehab AI · 13 photos
This property requires significant updates to its kitchen, bathroom, exterior, flooring, interior walls, and HVAC system to improve its condition and value.
Repairs flagged
- Major kitchen cabinets — severely dated and in poor condition
- Major bathroom fixtures — outdated and in poor condition
- Major exterior siding — peeling and in poor condition
- Major flooring — dated and worn
- Major interior walls — dated wood paneling and paint
- Major HVAC system — outdated and likely inefficient
Value-add opportunities
- Resale update kitchen cabinets and appliances — modernizing the kitchen would significantly increase its appeal
- Resale update bathroom fixtures and flooring — modernizing the bathroom would significantly increase its appeal
- Resale paint exterior and replace siding — a fresh paint job and new siding would significantly improve curb appeal
- Resale update flooring — new flooring would improve the overall look and feel of the home
- Resale update interior walls and paint — modernizing the interior would significantly increase its appeal
- Both update HVAC system — an efficient HVAC system would improve comfort and energy efficiency, benefiting both resale and rental value
Renovation cost estimate screening
| Repair item | Severity | Est. cost |
|---|---|---|
| kitchen cabinets · severely dated and in poor condition | Major | $15,000–50,000 |
| bathroom fixtures · outdated and in poor condition | Major | $15,000–50,000 |
| exterior siding · peeling and in poor condition | Major | $15,000–50,000 |
| flooring · dated and worn | Major | $15,000–50,000 |
| interior walls · dated wood paneling and paint | Major | $15,000–50,000 |
| HVAC system · outdated and likely inefficient | Major | $15,000–50,000 |
| Total estimated repair cost · 6 items | $90,000–300,000 |
Value-add ROI direction
- Resale update kitchen cabinets and appliances — modernizing the kitchen would significantly increase its appeal ↑
- Resale update bathroom fixtures and flooring — modernizing the bathroom would significantly increase its appeal ↑
- Resale paint exterior and replace siding — a fresh paint job and new siding would significantly improve curb appeal ↑
- Resale update flooring — new flooring would improve the overall look and feel of the home ↑
- Resale update interior walls and paint — modernizing the interior would significantly increase its appeal ↑
- Both update HVAC system — an efficient HVAC system would improve comfort and energy efficiency, benefiting both resale and rental value ↑
ⓘ Cost ranges are severity-bucket heuristics (US national rule-of-thumb). Get contractor quotes + a written scope before underwriting a rehab budget.
Schools (NCES district)
- District
- Maplewood Local
- NCES district ID
- 3905021
- Math proficiency
- 83% ▼ -7.00%
- Reading proficiency
- 81% ▼ -3.00%
- Median HH income
- $49,629
- Composite
- 69.3/100
- National rank
- #316
- State rank
- #51 of 656 in OH
Livability — Cortland
- Score
- 83/100
- State rank
- #64
- US rank
- #960
Category grades
Schools grade is shown separately in the Schools card above.
Census & demographics
- County
- Trumbull · 193,293 people
- Metro
- Youngstown-Warren, OH
- Population (ZIP)
- 16,467
- Household income
- $63,158
- Rent vs Own
- Severe rent burden
- 9.8
Population outlook (Trumbull County) Hauer SSP2
- Today (2025)
- 191,696 people
- By 2030
- 184,015 · -4.0%
- By 2040
- 166,810 · -13.0%
- By 2050
- 149,857 · -21.8%
- By 2075
- 115,769 · -39.6%
- By 2100
- 83,617 · -56.4%
Race, ethnicity, and origin ACS 2023
- Neighborhood character
- Predominantly White (94%)
- Race & ethnicity
- White 94% Two or more races 4% Hispanic / Latino 1%
- Common ancestry
- Romanian 4% Slovak 4% Serbian 2%
- Foreign-born
- 2% · Canada
- Languages at home
- 99% English-only · Other Indo-European 1%
Political lean MEDSL · Trumbull
- 2024 margin
- R (+16.8) · D 41.2% · R 58.0%
- 2008→2024 swing
- -39.2pp toward R · 2008: 22.4pp · 2024: -16.8pp
- All cycles
- 2024: R+16.8 2020: R+10.6 2016: R+6.4 2012: D+22.2 2008: D+22.4
Not yet ingested
- Civics
- —
Market trends
- HPI YoY
- ▼ -60.39%
- Current HPI
- 202.4062
- Rent YoY
- —
- Metro
- —
- State GDP YoY
- ▲ 1.98%
- F500 in state
- 48
Industry mix (Fortune 500 HQ in OH)
| Industry | F500 HQs | Revenue |
|---|---|---|
| Insurance | 3 | $145B |
|
||
| Industrial Machinery | 3 | $49B |
|
||
| Financial Services | 3 | $24B |
|
||
| Consumer Goods | 2 | $93B |
|
||
| Aerospace / Defense | 2 | $47B |
|
||
| Utilities | 2 | $33B |
|
||
Price history
1 event — show timeline
- 2026-05-15 Listed $65,000 MLSNOW
Cash-flow waterfall
monthlySold comps — $/sqft
last 12 mo · ≤1 miLoading sold comps…