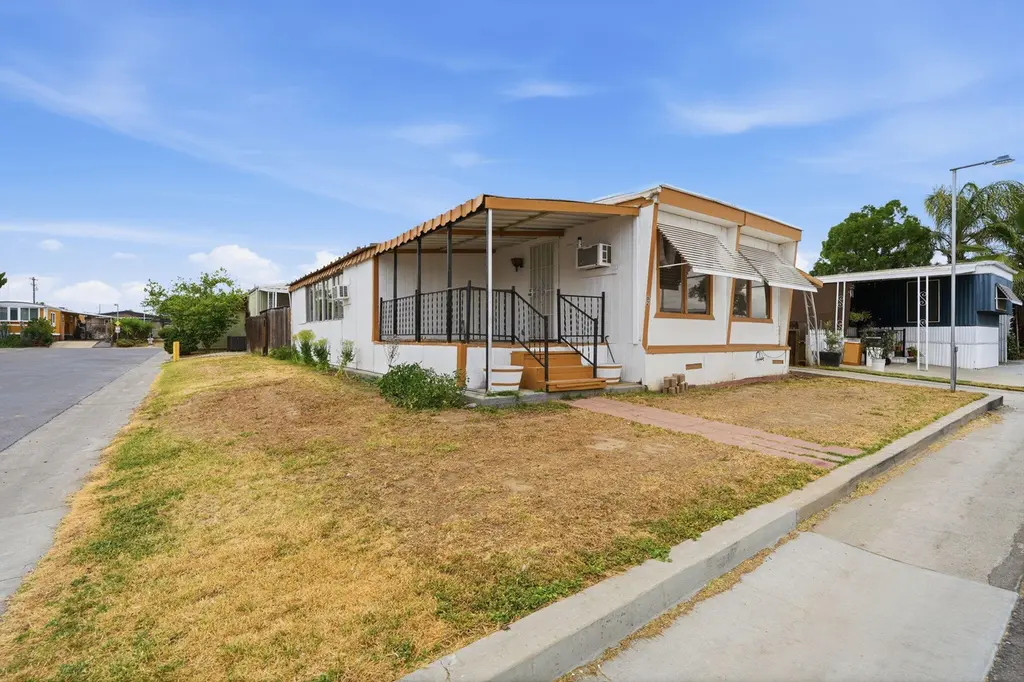
852 E Grangeville Blvd Spc 62 · Hanford, CA
Flood risk 1/10 · Minimal
- FEMA flood zone
- X (unshaded)
- Chance of flooding over 30 yrs
- 0.0%
- Est. flood insurance / yr
- $507 – $1,088
Fire risk 4/10 · Minor
- Est. fire insurance / yr
- $659 – $1,223
Heat risk 8/10 · Major
- Hot days now (above 105°F)
- 7 days/yr
- Hot days in 30 yrs
- 17 days/yr
Wind risk 1/10 · Minimal
- Chance of severe wind over 30 yrs
- —
Air-quality risk 10/10 · Severe
- Unhealthy air days now
- 49 days/yr
- Unhealthy air days in 30 yrs
- 50 days/yr
Risk factors via First Street. Map © Google.
Why this score? — see what drove the B grade
The composite is a weighted blend of 9 inputs, each scored 0–100. Each bar is that input's sub-score; the figure is the points it added to the 100-point composite (weight × sub-score).
- Cash flow +30.0/30.0
- 1% rule +10.0/10.0
- DSCR +10.0/10.0
- ARV discount +7.5/15.0
- Livability +3.8/5.0
- Schools +3.6/10.0
- Rent growth +3.2/5.0
- Condition / age +2.5/5.0
- Appreciation +0.0/10.0
$69,900
🖨 Deal sheet (PDF) 📄 Offer letter ✓ Due diligence
Listing remarks
Cozy 2-bedroom, 1-bathroom mobile home featuring a fenced backyard and a carport, perfectly situated in front of extra parking and a serene pond.
Key facts
- Carport
- Serene pond
- Fenced backyard
Tags
Property features AI
Finance
- Other: Located on a pond / waterfront; Back yard; Corner lot; Asphalt road access; Directions: From 10th Ave east on Grangeville Blvd, north into the park
Exterior
- Parking: Assigned spaces; Attached carport; Covered parking; Parking lot
- Utilities: Public water; Public sewer; Electricity connected; Natural gas connected; Natural gas available
- Home design: Manufactured in-park single wide; Single-story; Faces south; Model: Budger; Skirted with aluminum
- Construction: Metal roof; Raised foundation
- Exterior features: Front porch; Patio; Raised foundation
Interior
- Flooring: Carpet; Laminate; Linoleum
- Bathrooms: 1 full bathroom
- Heating & cooling: Wall furnace heating; Wall unit cooling
- Interior features: Carpet, laminate, and linoleum flooring; Storage
- Laundry & utility: Dedicated laundry room
Neighborhood map
What this means for you Summary
Snapshot
- This is a 2-bed/1.0-bath manufactured listed at $70k.
Deal economics
- At list price, monthly cash flow is $711 ($9k/yr) — positive.
- The deal already cash-flows at list — no discount required.
- Meets the 1% rule at list price ($2k rent vs $70k).
- Recommended offer: $69k (1.5% below list) — sets the bar for market timing.
- Cap rate 18.5% vs local median 3.9% in Hanford — top-decile yield for the area; either an underpriced asset or a hidden risk that comps aren't pricing in. Stress-test before assuming the spread holds.
Location & tenants
- Location reads 75/100 on livability (#121 in CA, #4,255 nationally) — a middle-class / working-renter tenant base. Strengths: commute A+, housing A+, amenities B; Watch: crime D+, health & safety D+, cost of living F.
- Hanford Joint Union High (urban): math 20% / reading 58% proficiency, ranked #765 of 1,400 in CA (top 55%) — families likely to look elsewhere, expect single-tenant / working-renter base with shorter leases.
- Market conditions: Rents rising (+2.9%/yr); 434 active listings in the ZIP; solid renter incomes; 741 units permitted in Kings County in 2024 (307 in 5+ unit buildings).
Forward outlook
- Local home prices are declining (-3.0%/yr); year-one equity from $483 of loan paydown is wiped out by about $2k of value loss. Plan a longer hold.
- At projected returns (-3.0% appreciation + 2.9% rent growth), your $20k cash investment doubles in ~3 years — after that, you're playing with house money.
Negotiation context
- It's been on market 20 days — a 2% lower offer ($69k) is reasonable based on typical stale-listing flexibility.
Risks & watch-outs
- Climate carrying-cost: extreme-heat days projected 7→17/yr by 2055 (HVAC capex compounding) — expect insurance premiums to compound above CPI over the hold.
Questions for the listing agent
- Built in 1962 — when were the roof, HVAC, electrical panel, plumbing, and water heater last replaced?
- Is there a deadline driving the sale (1031 exchange, divorce, estate, relocation)? That informs how much negotiation room exists.
- Crime grade is D in this area — have there been break-ins, vandalism, or insurance claims at this property in the last 3 years? What carrier currently insures it and at what premium?
- What's the average days-on-market for RENTAL listings here right now (not sales)? A rising rental-DOM trend means longer vacancies and softer asking-rent achievability than the comps imply.
- What's the recent tenant-quality profile in this submarket — average credit score on applications, eviction rate, late-payment / NSF rate, and stable-employment percentage? A property-management company in the area should have these aggregated.
- How much new for-sale + rental construction is in the pipeline within 1–3 miles? Heavy new supply typically softens prices + rents 12–24 months out; constrained supply supports both.
Investment metrics
- 1% rule
- 2.16% ✓
- Cap rate
- 18.50%
- Cash-on-cash
- 43.60%
- DSCR
- 2.94
- GRM
- 3.9
CMA / ARV
No comps found within radius.
Projected returns pro-forma
-3.0% appreciation · 2.87% rent growth · sell at horizon
- IRR
- 40.3%
- Equity multiple
- 2.73×
- Total profit
- $33,787
- Equity at exit
- $10,422
- IRR
- 46.6%
- Equity multiple
- 5.45×
- Total profit
- $87,023
- Equity at exit
- $6,044
Cash invested: $19,572 (down + closing). Projections, not guarantees.
Landlord ↔ Tenant lean methodology
- Overall (STATE)
- 18 Strongly Tenant-Friendly
- State California
- 18 Strongly Tenant-Friendly · D+13
- County
- — inherits STATE
- City
- — inherits STATE
ZIP-level market 93230
- Rents YoY
- 2.9%
- Active inventory
- 434
- Price-to-rent
- 3.9×
Monthly cashflow live
- Estimated rent
- $1,512 medium interval (Pro) →
- Mortgage (P&I)
- −$367
- Tax est. 1.5%
- −$87 /mo · $1,048/yr
- Insurance
- −$29
- HOA
- −$0
- Vacancy / Maint / Mgmt
- −$317
- Net cashflow
- $711
Break-even live
Sensitivity live
| Price | -10% $759 | -5% $735 | +0% $711 | +5% $687 | +10% $663 |
|---|---|---|---|---|---|
| Rent | -10% $592 | -5% $651 | +0% $711 | +5% $771 | +10% $830 |
| Rate | -1.0pp $746 | -0.5pp $729 | base $711 | +0.5pp $693 | +1.0pp $675 |
UW: 25.0% down · 7.5% · 30yr · 1.5% tax · 5.0% vac · 8.0% maint · 8.0% mgmt
Financing live
Cash to close
- Down payment
- $17,475
- Closing costs
- $2,097
- Reserves months
- —
- Total cash needed
- —
Loan-product check · same deal, 3 products live
Conventional
25% down · 7.5% · 30yr
- Down + closing
- —
- Monthly P&I
- —
- Monthly cashflow
- —
- DSCR
- —
- Eligible?
- —
Personal DTI + credit; lowest rate.
DSCR
20% down · 8.5% · 30yr
- Down + closing
- —
- Monthly P&I
- —
- Monthly cashflow
- —
- DSCR
- —
- Eligible?
- —
No personal income docs; deal must DSCR.
Hard money
10% down · 12.0% · 12mo
- Down + closing
- —
- Monthly P&I
- —
- Monthly cashflow
- —
- DSCR
- —
- Eligible?
- —
Short-term bridge; refi at stabilization.
Listing history 20 events
-
2026-06-21days on market $69,900 Active 20 DOM
-
2026-06-19days on market $69,900 Active 18 DOM
-
2026-06-18days on market $69,900 Active 17 DOM
-
2026-06-17days on market $69,900 Active 16 DOM
-
2026-06-16days on market $69,900 Active 15 DOM
-
2026-06-15days on market $69,900 Active 14 DOM
-
2026-06-14days on market $69,900 Active 12 DOM
-
2026-06-13days on market $69,900 Active 11 DOM
-
2026-06-10days on market $69,900 Active 9 DOM
-
2026-06-09days on market $69,900 Active 8 DOM
-
2026-06-09price $69,900 Active 7 DOM
-
2026-06-08days on market $79,000 Active 7 DOM
-
2026-06-07days on market $79,000 Active 6 DOM
-
2026-06-05days on market $79,000 Active 3 DOM
-
2026-06-03days on market $79,000 Active 2 DOM
-
2026-06-02days on market $79,000 Active 1 DOM
-
2026-06-01days on market $79,000 Active 5 DOM
-
2026-05-31days on market $79,000 Active 4 DOM
-
2026-05-30days on market $79,000 Active 3 DOM
-
2026-05-27$79,000 Active
ⓘ Source: listings_history table (triggers on properties + properties_extension) + one-shot
backfill from property_details.listing_events for pre-trigger history.
Climate risk First Street
- Flood 1/10 Low FEMA zone X (unshaded) · 0% chance over 30 yrs
- Wildfire 4/10 Moderate
- Heat 8/10 Severe 7 d/yr ≥105°F today · 17 d/yr by 30 yrs out
- Wind 1/10 Low
- Air quality 10/10 Extreme 49 unhealthy d/yr today · 50 by 30 yrs out
Nearby sold comps map
Loading sold comps map…
Walkable amenities ~0.75 mi
Loading nearby amenities…
Taxation est. · year 1
- Rental income
- $18,139
- − Mortgage interest
- −$3,915
- − Property taxes
- −$1,048
- − Insurance
- −$350
- − Repairs & maintenance
- −$1,451
- − Management
- −$1,451
- − Depreciation
- −$2,033
- Taxable income
- $7,890
- Est. tax owed @ 24.0%
- −$1,894
- After-tax cash flow
- $6,639/yr
For passive investors: Depreciation is non-cash, so a rental often shows a tax loss while cash-flowing — sheltering income. Rental losses are passive: they offset passive income freely, and up to $25,000/yr can offset ordinary (W-2) income if you actively participate and your MAGI is under $100k (phasing out to $0 by $150k); unused losses carry forward. On sale, claimed depreciation is recaptured at up to 25%, and gains may owe capital-gains tax (a 1031 exchange can defer both). Figures are a year-1 estimate at your 24.0% rate — not tax advice; consult a CPA.
Schools (NCES district)
- District
- Hanford Joint Union High
- NCES district ID
- 0616500
- Math proficiency
- 20% ▲ 1.00%
- Reading proficiency
- 58% ▬ 0.00%
- Median HH income
- $47,265
- Composite
- 35.8/100
- National rank
- #9626
- State rank
- #765 of 1400 in CA
Livability — Hanford
- Score
- 75/100
- State rank
- #121
- US rank
- #4255
Category grades
Schools grade is shown separately in the Schools card above.
Census & demographics
- Census place
- Hanford, CA
- County
- Kings County · 107,655 people
- City population
- 69,684
- Metro
- Hanford-Corcoran, CA
- Population (ZIP)
- 69,684
- Household income
- $76,023
- Rent vs Own
- Severe rent burden
- 2081.0
Population outlook (Kings County) Hauer SSP2
- Today (2025)
- 147,136 people
- By 2030
- 145,623 · -1.0%
- By 2040
- 146,017 · -0.8%
- By 2050
- 145,239 · -1.3%
- By 2075
- 131,479 · -10.6%
- By 2100
- 103,967 · -29.3%
Race, ethnicity, and origin ACS 2023
- Neighborhood character
- Diverse neighborhood (Simpson 0.60)
- Race & ethnicity
- Hispanic / Latino 52% White 35% Two or more races 19% Black 5% Asian 3% Native American 2%
- Hispanic origin (detail)
- Mexican 49%
- Common ancestry
- Russian 6% Italian 2% Lithuanian 1%
- Foreign-born
- 17% · Canada
- Languages at home
- 65% English-only · Spanish 31% Other Indo-European 2% Tagalog/Filipino 2%
Political lean MEDSL · Kings
- 2024 margin
- Strong R (+23.0) · D 37.4% · R 60.4% · Other 2.2%
- 2008→2024 swing
- -8.9pp toward R · 2008: -14.1pp · 2024: -23.0pp
- All cycles
- 2024: R+23.0 2020: R+12.2 2016: R+14.1 2012: R+16.3 2008: R+14.1
Not yet ingested
- Civics
- —
Market trends
- HPI YoY
- ▼ -267.79%
- Current HPI
- 321.3409
- Rent YoY
- ▲ 2.87%
- Metro
- Hanford-Corcoran, CA
- State GDP YoY
- ▲ 3.21%
- F500 in state
- 116
Industry mix (Fortune 500 HQ in CA)
| Industry | F500 HQs | Revenue |
|---|---|---|
| Technology | 27 | $1,492B |
|
||
| Financial Services | 3 | $174B |
|
||
| Retail | 3 | $44B |
|
||
| Insurance | 3 | $26B |
|
||
| Media / Entertainment | 2 | $115B |
|
||
| Pharmaceuticals / Biotech | 2 | $62B |
|
||
Price history
1 event — show timeline
- 2026-05-27 Listed $79,000 TCMLS
Property tax history
-1.6%/yrLatest (2022): $47 · -12.3% YoY. Source: county tax records.
Cash-flow waterfall
monthlySold comps — $/sqft
last 12 mo · ≤1 miLoading sold comps…