 Multi-family
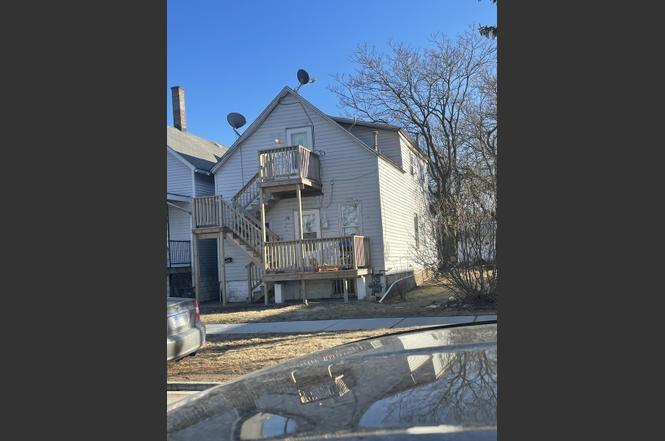
198 24th St · Chicago Heights, IL
Flood risk 4/10 · Minor
- FEMA flood zone
- X (unshaded)
- Chance of flooding over 30 yrs
- 0.22%
- Est. flood insurance / yr
- $507 – $1,088
Fire risk 1/10 · Minimal
- Est. fire insurance / yr
- $804 – $1,492
Heat risk 3/10 · Minor
- Hot days now (above 101°F)
- 7 days/yr
- Hot days in 30 yrs
- 16 days/yr
Wind risk 2/10 · Minimal
- Chance of severe wind over 30 yrs
- —
Air-quality risk 2/10 · Minimal
- Unhealthy air days now
- 2 days/yr
- Unhealthy air days in 30 yrs
- 2 days/yr
Risk factors via First Street. Map © Google.
Why this score? — see what drove the C grade
The composite is a weighted blend of 9 inputs, each scored 0–100. Each bar is that input's sub-score; the figure is the points it added to the 100-point composite (weight × sub-score).
- Cash flow +24.4/30.0
- DSCR +7.9/10.0
- ARV discount +7.5/15.0
- 1% rule +7.0/10.0
- Rent growth +4.1/5.0
- Livability +3.6/5.0
- Condition / age +2.5/5.0
- Schools +0.7/10.0
- Appreciation +0.0/10.0
$155,500
🖨 Deal sheet 📄 Offer letter ✓ Due diligence
Multi-family units
County records classify this as Multi-Family (2-4 Unit). Listing-text estimate: 1 unit. estimate disagrees with records
Listing remarks
you can buy and rent or invest move in ready current up to date. new roof in 2011 updated electrical 3 bedroom downstairs and 1.5 up stairs month to month long term tenants 24 to 48 hr notice is required
Key facts
- Updated electrical
- New roof
- 3,000 sq ft lot
Tags
Property features AI
Finance
- Other: Commuter access: bus and train service, interstate access, school bus service
- Financial info: Building contains 2 units; Unit 1 rent: $1,000 per month (tenant pays all); Unit 2 rent: $700 per month (tenant pays all)
- HOA & community: No special service area
Exterior
- Utilities: Public water; Public sewer
- Home design: Two- to four-unit property; Fee simple ownership; More than 100 years old; Built before 1978
- Construction: Aluminum siding and frame construction
- Exterior features: Park nearby; Sidewalks; Street lights; Lot dimensions approximately 25 x 120; Lot smaller than 0.25 acre
Interior
- Kitchen: Unit 1 includes stove and refrigerator; Unit 2 includes stove and refrigerator
- Bedrooms: 4 bedrooms total; Unit 1: 3 bedrooms (first floor); Unit 2: 1 bedroom (first floor)
- Bathrooms: 2 full bathrooms total; Unit 1: 1 full bathroom; Unit 2: 1 full bathroom
- Heating & cooling: Natural gas forced air heating
- Interior features: 10 total rooms; Unfinished partial basement
Neighborhood map
What this means for you Summary
Snapshot
- This is a 4-bed/2.0-bath multifamily listed at $156k.
Deal economics
- At list price, monthly cash flow is $315 ($4k/yr) — positive.
- The deal already cash-flows at list — no discount required.
- Meets the 1% rule at list price ($2k rent vs $156k).
- Recommended offer: $137k (12.0% below list) — sets the bar for market timing.
- Cap rate 8.7% vs local median 6.4% in Chicago Heights — top-decile yield for the area; either an underpriced asset or a hidden risk that comps aren't pricing in. Stress-test before assuming the spread holds.
Location & tenants
- Location reads 71/100 on livability (#339 in IL) — a middle-class / working-renter tenant base. Strengths: commute A+, cost of living A+, housing A+; Watch: employment C-, schools F, crime F.
- Bloom Twp Hsd 206 (suburban): math 8% / reading 9% proficiency, ranked #591 of 620 in IL (top 95%) — low school quality limits family demand, transient renter base, plan for 1-2y turnover.
- Market conditions: Rents rising fast (+6.5%/yr); 222 active listings in the ZIP; 8 comparable units currently listed for rent nearby; rentals at typical pace (median 19d on market — plan ~3-4 weeks tenant-placement turnaround); 6,272 units permitted in Cook County in 2024 (4,658 in 5+ unit buildings).
- This rent runs 36% of the median local income ($62k/yr) — at the standard rent-burdened threshold; future hikes will face affordability resistance.
Forward outlook
- Local home prices are declining (-3.0%/yr); year-one equity from $1k of loan paydown is wiped out by about $5k of value loss. Plan a longer hold.
- At projected returns (-3.0% appreciation + 6.5% rent growth), your $44k cash investment doubles in ~9 years — after that, you're playing with house money.
Negotiation context
- It's been on market 471 days — a 12% lower offer ($137k) is reasonable based on typical stale-listing flexibility.
- 2 sale attempts since 20y ago with the ask held roughly flat each time — persistent listings suggest the price (not the market) is what's stuck; bring a comps-based counter.
- Current owner paid $77k; list at $156k implies a 102% gain — meaningful room to come down on a strong offer.
Risks & watch-outs
- Watch-outs: built in 1913 — expect roof / HVAC / electrical / plumbing capex.
Questions for the listing agent
- It's been on market 471 days. Have you received any prior offers? Is the seller open to a 12% concession, seller financing, or rate buy-down credit?
- Built in 1913 — when were the roof, HVAC, electrical panel, plumbing, and water heater last replaced?
- Why hasn't it sold? Are there any deal-killer items the seller is aware of (foundation, flood, title, zoning, code violations)?
- Is there a deadline driving the sale (1031 exchange, divorce, estate, relocation)? That informs how much negotiation room exists.
- Schools are F-rated, which usually means shorter tenancies and higher turnover. Who's the typical renter profile here, and what's been the actual vacancy rate?
- Crime grade is F in this area — have there been break-ins, vandalism, or insurance claims at this property in the last 3 years? What carrier currently insures it and at what premium?
- What's the average days-on-market for RENTAL listings here right now (not sales)? A rising rental-DOM trend means longer vacancies and softer asking-rent achievability than the comps imply.
- What's the recent tenant-quality profile in this submarket — average credit score on applications, eviction rate, late-payment / NSF rate, and stable-employment percentage? A property-management company in the area should have these aggregated.
- How much new apartment / multifamily construction is in the pipeline within 1–3 miles? Heavy new supply (>2% of stock underway) typically softens rents 12–24 months out; light construction supports rent growth.
Investment metrics
- 1% rule
- 1.20% ✓
- Cap rate
- 8.73%
- Cash-on-cash
- 8.69%
- DSCR
- 1.39
- GRM
- 7.0
CMA / ARV
No comps found within radius.
Projected returns pro-forma
-3.0% appreciation · 6.48% rent growth · sell at horizon
- IRR
- 1.0%
- Equity multiple
- 1.04×
- Total profit
- $1,720
- Equity at exit
- $23,186
- IRR
- 14.0%
- Equity multiple
- 2.32×
- Total profit
- $57,432
- Equity at exit
- $13,445
Cash invested: $43,540 (down + closing). Projections, not guarantees.
Landlord ↔ Tenant lean methodology
- Overall (STATE)
- 43 Moderately Tenant-Leaning
- State Illinois
- 43 Moderately Tenant-Leaning · D+7
- County
- — inherits STATE
- City
- — inherits STATE
ZIP-level market 60411
- Home prices YoY
- -33.9%
- Rents YoY
- 6.5%
- Active inventory
- 222
- Price-to-rent
- 7.0×
Monthly cashflow live
- Estimated rent
- $1,862 high interval (Pro) →
- Mortgage (P&I)
- −$815
- Tax from tax record
- −$275 /mo · $3,306/yr
- Insurance
- −$65
- HOA
- −$0
- Vacancy / Maint / Mgmt
- −$391
- Net cashflow
- $315
Break-even live
UW: 25.0% down · 7.5% · 30yr · 1.5% tax · 5.0% vac · 8.0% maint · 8.0% mgmt
Financing live
Cash to close
- Down payment
- $38,875
- Closing costs
- $4,665
- Reserves months
- —
- Total cash needed
- —
Loan-product check · same deal, 3 products live
Conventional
25% down · 7.5% · 30yr
- Down + closing
- —
- Monthly P&I
- —
- Monthly cashflow
- —
- DSCR
- —
- Eligible?
- —
Personal DTI + credit; lowest rate.
DSCR
20% down · 8.5% · 30yr
- Down + closing
- —
- Monthly P&I
- —
- Monthly cashflow
- —
- DSCR
- —
- Eligible?
- —
No personal income docs; deal must DSCR.
Hard money
10% down · 12.0% · 12mo
- Down + closing
- —
- Monthly P&I
- —
- Monthly cashflow
- —
- DSCR
- —
- Eligible?
- —
Short-term bridge; refi at stabilization.
Rent comps 8 comps
| Address | Beds | Baths | Sqft | Rent | $/sqft | DOM | Units | Dist |
|---|---|---|---|---|---|---|---|---|
| 169 E 23rd St Unit 1F Chicago Heights, IL | 3.0 | 1.0 | 1200 | $1,550 | $1.29 | 12d | 1 | 0.13mi |
| 63 Hickory St Unit 2 Chicago Heights, IL | 3.0 | 1.0 | 900 | $1,700 | $1.89 | 24d | 1 | 0.87mi |
| 1665 Buena Vista Ave Unit 3 Chicago Heights, IL | 4.0 | 1.0 | 1700 | $1,800 | $1.06 | 18d | 1 | 1.02mi |
| 1631 Buena Vista Ave Unit 2 Chicago Heights, IL | 4.0 | 1.0 | 1200 | $1,900 | $1.58 | 24d | 1 | 1.06mi |
| 41 W 14th Pl Unit 1 Chicago Heights, IL | 3.0 | 1.0 | 1250 | $1,750 | $1.40 | 11d | 1 | 1.12mi |
| 83 W 15th St #1 Chicago Heights, IL | 3.0 | 1.0 | 1050 | $1,500 | $1.43 | 3d | 1 | 1.13mi |
| 1203 Emerald Ave Unit 1 Chicago Heights, IL | 3.0 | 1.0 | 1200 | $1,550 | $1.29 | 1d | 1 | 1.17mi |
| 236 Chestnut Ave Unit S South Chicago Heights, IL | 3.0 | 1.0 | 1032 | $2,000 | $1.94 | 24d | 1 | 1.23mi |
Listing history 20 events
-
2026-06-18days on market $155,500 Active 471 DOM
-
2026-06-17days on market $155,500 Active 470 DOM
-
2026-06-16days on market $155,500 Active 469 DOM
-
2026-06-15days on market $155,500 Active 468 DOM
-
2026-06-13days on market $155,500 Active 466 DOM
-
2026-06-13days on market $155,500 Active 465 DOM
-
2026-06-09days on market $155,500 Active 462 DOM
-
2026-06-08days on market $155,500 Active 461 DOM
-
2026-06-07days on market $155,500 Active 460 DOM
-
2026-06-04days on market $155,500 Active 457 DOM
-
2026-06-03days on market $155,500 Active 456 DOM
-
2026-06-02days on market $155,500 Active 455 DOM
-
2026-06-01days on market $155,500 Active 454 DOM
-
2026-05-31days on market $155,500 Active 453 DOM
-
2025-08-28price $155,500
-
2025-03-03$159,900 Active
-
2007-05-27historical
-
2006-11-27
-
2003-06-27soldstatus $77,000
-
1991-05-29soldstatus $36,000
ⓘ Source: listings_history table (triggers on properties + properties_extension) + one-shot
backfill from property_details.listing_events for pre-trigger history.
Tax reassessment forecast IL · Partial reset (capped growth)
- Current annual tax
- $3,306 · $275/mo
- Projected year-2 tax
- $3,418 · $285/mo
- Expected delta
- +$112/yr (+$9/mo · 3.4%)
ⓘ Screening estimate from a state-policy table — verify with the county assessor before closing.
Climate risk First Street
- Flood 4/10 Moderate FEMA zone X (unshaded) · 22% chance over 30 yrs
- Wildfire 1/10 Low
- Heat 3/10 Moderate 7 d/yr ≥101°F today · 16 d/yr by 30 yrs out
- Wind 2/10 Low
- Air quality 2/10 Low 2 unhealthy d/yr today · 2 by 30 yrs out
Nearby sold comps map
Loading sold comps map…
Walkable amenities ~0.75 mi
Loading nearby amenities…
Taxation est. · year 1
- Rental income
- $22,347
- − Mortgage interest
- −$8,710
- − Property taxes
- −$3,306
- − Insurance
- −$778
- − Repairs & maintenance
- −$1,788
- − Management
- −$1,788
- − Depreciation
- −$4,524
- Taxable income
- $1,454
- Est. tax owed @ 24.0%
- −$349
- After-tax cash flow
- $3,436/yr
For passive investors: Depreciation is non-cash, so a rental often shows a tax loss while cash-flowing — sheltering income. Rental losses are passive: they offset passive income freely, and up to $25,000/yr can offset ordinary (W-2) income if you actively participate and your MAGI is under $100k (phasing out to $0 by $150k); unused losses carry forward. On sale, claimed depreciation is recaptured at up to 25%, and gains may owe capital-gains tax (a 1031 exchange can defer both). Figures are a year-1 estimate at your 24.0% rate — not tax advice; consult a CPA.
Schools (NCES district)
- District
- Bloom Twp Hsd 206
- NCES district ID
- 1706420
- Math proficiency
- 8% ▼ -3.00%
- Reading proficiency
- 9% ▼ -8.00%
- Median HH income
- $39,795
- Composite
- 7.4/100
- National rank
- #9952
- State rank
- #591 of 620 in IL
Livability — Chicago Heights
- Score
- 71/100
- State rank
- #339
- US rank
- #6836
Category grades
Schools grade is shown separately in the Schools card above.
Census & demographics
- Census place
- Chicago Heights, IL
- County
- Cook County · 4,486,803 people
- City population
- 52,175
- Metro
- Chicago-Naperville-Elgin, IL-IN-WI
- Population (ZIP)
- 52,175
- Household income
- $62,073
- Rent vs Own
- Severe rent burden
- 1714.0
Population outlook (Cook County) Hauer SSP2
- Today (2025)
- 5,347,519 people
- By 2030
- 5,357,703 · +0.2%
- By 2040
- 5,324,924 · -0.4%
- By 2050
- 5,230,762 · -2.2%
- By 2075
- 4,785,735 · -10.5%
- By 2100
- 4,188,836 · -21.7%
Race, ethnicity, and origin ACS 2023
- Neighborhood character
- Diverse neighborhood (Simpson 0.66)
- Race & ethnicity
- Black 49% Hispanic / Latino 26% White 19% Two or more races 11%
- Hispanic origin (detail)
- Mexican 22% Puerto Rican 2%
- Common ancestry
- Romanian 4% Portuguese 1% Lithuanian 1%
- Foreign-born
- 12% · Canada
- Languages at home
- 76% English-only · Spanish 21% Russian/Polish/Slavic 1% Other Indo-European 1%
Political lean MEDSL · Cook
- 2024 margin
- Solid D (+42.0) · D 70.4% · R 28.4% · Other 1.2%
- 2008→2024 swing
- -11.4pp toward R · 2008: 53.4pp · 2024: 42.0pp
- All cycles
- 2024: D+42.0 2020: D+50.3 2016: D+53.0 2012: D+49.4 2008: D+53.4
Not yet ingested
- Civics
- —
Market trends
- HPI YoY
- ▼ -108.75%
- Current HPI
- 212.4058
- Rent YoY
- ▲ 6.48%
- Metro
- Chicago-Naperville-Elgin, IL-IN-WI
- State GDP YoY
- ▲ 1.59%
- F500 in state
- 60
Industry mix (Fortune 500 HQ in IL)
| Industry | F500 HQs | Revenue |
|---|---|---|
| Insurance | 4 | $201B |
|
||
| Consumer Goods | 4 | $87B |
|
||
| Industrial Machinery | 3 | $64B |
|
||
| Healthcare | 2 | $55B |
|
||
| Retail / Pharmacy | 1 | $148B |
|
||
| Agriculture / Food | 1 | $86B |
|
||
Price history
+331.9% since first listed6 events — show timeline
- 2025-08-28 Price Changed $155,500 MRED as Distributed by MLS Grid
- 2025-03-03 Listed $159,900 MRED as Distributed by MLS Grid
- 2007-05-27 Listing Removed — MRED as Distributed by MLS Grid
- 2006-11-27 Listed — MRED as Distributed by MLS Grid
- 2003-06-27 Sold (Public Records) $77,000 Public Records
- 1991-05-29 Sold (Public Records) $36,000 Public Records
Property tax history
+2.5%/yrLatest (2023): $3,306 · -13.9% YoY. Source: county tax records.
Cash-flow waterfall
monthlySold comps — $/sqft
last 12 mo · ≤1 miLoading sold comps…