 Multi-family
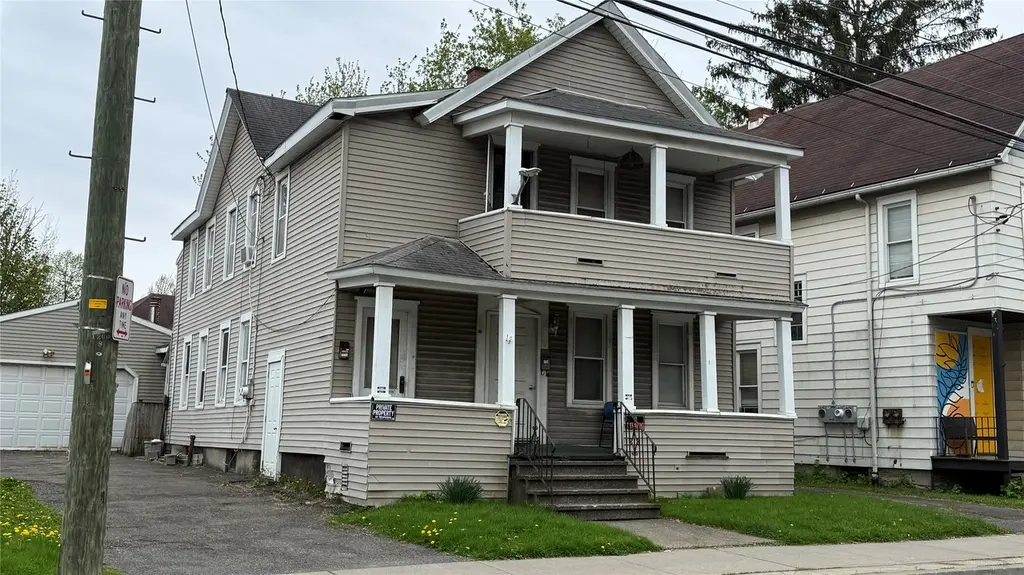
30 Robinson St · Binghamton, NY
Flood risk 1/10 · Minimal
- FEMA flood zone
- X
- Chance of flooding over 30 yrs
- 0.0%
- Est. flood insurance / yr
- $473 – $860
Fire risk 1/10 · Minimal
- Est. fire insurance / yr
- $691 – $1,283
Heat risk 3/10 · Minor
- Hot days now (above 92°F)
- 8 days/yr
- Hot days in 30 yrs
- 17 days/yr
Wind risk 2/10 · Minimal
- Chance of severe wind over 30 yrs
- 1.0%
Air-quality risk 2/10 · Minimal
- Unhealthy air days now
- 0 days/yr
- Unhealthy air days in 30 yrs
- 1 days/yr
Risk factors via First Street. Map © Google.
Why this score? — see what drove the B grade
The composite is a weighted blend of 9 inputs, each scored 0–100. Each bar is that input's sub-score; the figure is the points it added to the 100-point composite (weight × sub-score).
- Cash flow +30.0/30.0
- ARV discount +11.7/15.0
- 1% rule +10.0/10.0
- DSCR +10.0/10.0
- Livability +3.9/5.0
- Schools +3.0/10.0
- Rent growth +2.5/5.0
- Condition / age +2.5/5.0
- Appreciation +0.0/10.0
$145,000
🖨 Deal sheet (PDF) 📄 Offer letter ✓ Due diligence
Multi-family units
County records classify this as Multi-Family (2-4 Unit). Listing-text estimate: 1 unit. estimate disagrees with records
Listing remarks MLS
This well-maintained two-family property presents a fantastic investment opportunity. Boasting a 17% cap rate, it offers reliable cash flow from two long-term tenants who are consistently current on their rent payments. Property is minutes to highway access and downtown. Don't miss this opportunity to add a reliable income-generating property to your portfolio. Reach out today to schedule a viewing!
Key facts
- 5,227 sq ft lot
- 2 garage spots
- Built 1946
Property features AI
Finance
- Other: Zoning: RES2; Lot is level
- Financial info: Unit 1 rent: $750; Unit 2 rent: $750
- HOA & community: No HOA information listed
Exterior
- Parking: Detached 2-car garage
- Security: No security features listed
- Utilities: Public water; Public sewer
- Home design: Residential income property — duplex; Two separate units
- Construction: Vinyl siding
- Exterior features: Covered porch
Interior
- Kitchen: No specific kitchen appliances listed
- Bedrooms: Two-bedroom unit (Unit 1); Three-bedroom unit (Unit 2)
- Flooring: Carpet; Hardwood
- Bathrooms: Two full bathrooms total (unit breakdown: one full bath in each unit)
- Heating & cooling: Baseboard heating; No central cooling
- Interior features: Gas water heater
- Laundry & utility: No laundry appliances listed
Neighborhood map
What this means for you Summary
Snapshot
- This is a 5-bed/2.0-bath multifamily listed at $145k.
Deal economics
- At list price, monthly cash flow is $2k ($19k/yr) — positive.
- The deal already cash-flows at list — no discount required.
- Meets the 1% rule at list price ($3k rent vs $145k).
- Recommended offer: $141k (3.0% below list) — sets the bar for market timing.
- Cap rate 19.3% vs local median 6.4% in Binghamton — top-decile yield for the area; either an underpriced asset or a hidden risk that comps aren't pricing in. Stress-test before assuming the spread holds.
Location & tenants
- Location reads 78/100 on livability (#174 in NY, #2,710 nationally) — a middle-class / working-renter tenant base. Strengths: amenities A+, commute A+, cost of living A+; Watch: crime F, employment F.
- Binghamton City School District (urban): math 30% / reading 44% proficiency, ranked #557 of 590 in NY (top 94%) — families likely to look elsewhere, expect single-tenant / working-renter base with shorter leases; 61% free/reduced lunch — lower-income household profile, screen leases tightly.
- Zoned schools: Calvin Coolidge School (math 27% / reading 37%, grade F, #1,646 of 2,108 statewide, top 80%, 312 students, 72% FRL); Binghamton High School (math 71% / reading 79%, grade A-, #631 of 1,100 statewide, top 58%, 1,341 students, 69% FRL).
- Zoned-school proficiency averages 54% at this address vs 37% district-wide (+16 pts) — the actual schools serving this property are materially stronger than the Binghamton City School District average implies; a family-tenant draw the district grade alone would hide.
- Market conditions: 92 active listings in the ZIP; 10 comparable units currently listed for rent nearby; rentals lingering (median 46d on market — plan ~5-8 weeks vacancy on turnover, expect pricing pressure); 60% of comp listings sitting > 30 days — soft ceiling on asking rent; 340 units permitted in Broome County in 2024 (269 in 5+ unit buildings).
Forward outlook
- Local home prices are declining (-3.0%/yr); year-one equity from $1k of loan paydown is wiped out by about $4k of value loss. Plan a longer hold.
- Broome County population projected at -13% by 2050 — secular population decline; favor cash flow + early exit over multi-decade hold.
- At projected returns (-3.0% appreciation + 3.0% rent growth), your $41k cash investment doubles in ~3 years — after that, you're playing with house money.
Negotiation context
- It's been on market 53 days — a 3% lower offer ($141k) is reasonable based on typical stale-listing flexibility.
- 5 sale attempts since 3y ago with the ask held roughly flat each time — persistent listings suggest the price (not the market) is what's stuck; bring a comps-based counter.
- Current owner paid $78k; list at $145k implies a 85% gain — meaningful room to come down on a strong offer.
Risks & watch-outs
- Watch-outs: built in 1946 — expect roof / HVAC / electrical / plumbing capex.
Questions for the listing agent
- It's been on market 53 days. Have you received any prior offers? Is the seller open to a 3% concession, seller financing, or rate buy-down credit?
- Built in 1946 — when were the roof, HVAC, electrical panel, plumbing, and water heater last replaced?
- Is there a deadline driving the sale (1031 exchange, divorce, estate, relocation)? That informs how much negotiation room exists.
- Schools are D-rated, which usually means shorter tenancies and higher turnover. Who's the typical renter profile here, and what's been the actual vacancy rate?
- Crime grade is F in this area — have there been break-ins, vandalism, or insurance claims at this property in the last 3 years? What carrier currently insures it and at what premium?
- What's the average days-on-market for RENTAL listings here right now (not sales)? A rising rental-DOM trend means longer vacancies and softer asking-rent achievability than the comps imply.
- What's the recent tenant-quality profile in this submarket — average credit score on applications, eviction rate, late-payment / NSF rate, and stable-employment percentage? A property-management company in the area should have these aggregated.
- How much new apartment / multifamily construction is in the pipeline within 1–3 miles? Heavy new supply (>2% of stock underway) typically softens rents 12–24 months out; light construction supports rent growth.
Investment metrics
- 1% rule
- 2.34% ✓
- Cap rate
- 19.28%
- Cash-on-cash
- 46.37%
- DSCR
- 3.06
- GRM
- 3.6
CMA / ARV
- ARV (median comp)
- $159,880
- List price
- $145,000
- Delta
- -9.31%
- Verdict
- FAIR
- Comps
- 20 within 1.0 mi
Show comp detail 12 sales within ~0.75 mi
| Address | Dist | Beds/Ba | Sqft | Sold | Price | $/sf | Match |
|---|---|---|---|---|---|---|---|
| 14 Emmett St | 0.02mi | 4/2.0 (-1) | 2,220 (+6%) | 4mo | $90,000 | $41 | 81 |
| 9 Allen St | 0.39mi | 4/3.0 (-1) | 2,184 (+4%) | 5mo | $150,000 | $69 | 62 |
| 28 Jackson St | 0.70mi | 5/2.0 | 2,208 (+5%) | 2mo | $100,000 | $45 | 57 |
| 57 Ely St | 0.57mi | 4/3.0 (-1) | 2,192 (+4%) | 1mo | $112,500 | $51 | 56 |
| 29 Griswold St | 0.44mi | 5/2.0 | 1,824 (-13%) | 3mo | $60,000 | $33 | 55 |
| 12 Stuyvesant St | 0.59mi | 6/2.0 (+1) | 1,954 (-7%) | 7mo | $124,000 | $63 | 50 |
| 13 Sturges St | 0.63mi | 4/2.0 (-1) | 2,194 (+4%) | 12mo | $105,000 | $48 | 48 |
| 12 Jay St | 0.56mi | 4/2.0 (-1) | 2,316 (+10%) | 7mo | $130,000 | $56 | 45 |
| 14 Deforest St | 0.68mi | 4/3.0 (-1) | 2,312 (+10%) | 1mo | $140,000 | $61 | 41 |
| 90 Broad Ave | 0.72mi | 4/2.0 (-1) | 1,872 (-11%) | 5mo | $230,000 | $123 | 39 |
| 5 Otseningo St | 0.63mi | 6/2.0 (+1) | 2,380 (+13%) | 16mo | $194,000 | $82 | 30 |
| 27 Valley St | 0.73mi | 4/2.5 (-1) | 1,825 (-13%) | 15mo | $156,000 | $85 | 24 |
Match score weights: distance 35% · size 25% · config 20% · recency 20%. Top-matched comps best support the ARV.
Projected returns pro-forma
-3.0% appreciation · 3.0% rent growth · sell at horizon
- IRR
- 43.7%
- Equity multiple
- 2.89×
- Total profit
- $76,545
- Equity at exit
- $21,620
- IRR
- 49.7%
- Equity multiple
- 5.82×
- Total profit
- $195,800
- Equity at exit
- $12,537
Cash invested: $40,600 (down + closing). Projections, not guarantees.
Landlord ↔ Tenant lean methodology
- Overall (STATE)
- 15 Strongly Tenant-Friendly
- State New York
- 15 Strongly Tenant-Friendly · D+10
- County
- — inherits STATE
- City
- — inherits STATE
ZIP-level market 13901
- Home prices YoY
- -5.1%
- Active inventory
- 92
- Price-to-rent
- 10.7×
Monthly cashflow live
- Estimated rent
- $3,392 high interval (Pro) →
- Mortgage (P&I)
- −$760
- Tax from tax record
- −$290 /mo · $3,480/yr
- Insurance
- −$60
- HOA
- −$0
- Vacancy / Maint / Mgmt
- −$712
- Net cashflow
- $1,569
Break-even live
Sensitivity live
| Price | -10% $1,651 | -5% $1,610 | +0% $1,569 | +5% $1,528 | +10% $1,487 |
|---|---|---|---|---|---|
| Rent | -10% $1,301 | -5% $1,435 | +0% $1,569 | +5% $1,703 | +10% $1,837 |
| Rate | -1.0pp $1,642 | -0.5pp $1,606 | base $1,569 | +0.5pp $1,531 | +1.0pp $1,493 |
3-unit breakdown (identical units grouped — click to expand)
| Units | Beds | Baths | Est. rent |
|---|---|---|---|
| 3× units | 2 | 1 | $3,393 |
| #1 | 2 | 1 | $1,131 |
| #2 | 2 | 1 | $1,131 |
| #3 | 2 | 1 | $1,131 |
| Total (3 units) | $3,392 | ||
UW: 25.0% down · 7.5% · 30yr · 1.5% tax · 5.0% vac · 8.0% maint · 8.0% mgmt
Financing live
Cash to close
- Down payment
- $36,250
- Closing costs
- $4,350
- Reserves months
- —
- Total cash needed
- —
Loan-product check · same deal, 3 products live
Conventional
25% down · 7.5% · 30yr
- Down + closing
- —
- Monthly P&I
- —
- Monthly cashflow
- —
- DSCR
- —
- Eligible?
- —
Personal DTI + credit; lowest rate.
DSCR
20% down · 8.5% · 30yr
- Down + closing
- —
- Monthly P&I
- —
- Monthly cashflow
- —
- DSCR
- —
- Eligible?
- —
No personal income docs; deal must DSCR.
Hard money
10% down · 12.0% · 12mo
- Down + closing
- —
- Monthly P&I
- —
- Monthly cashflow
- —
- DSCR
- —
- Eligible?
- —
Short-term bridge; refi at stabilization.
Rent comps 10 comps
| Address | Beds | Baths | Sqft | Rent | $/sqft | DOM | Units | Dist |
|---|---|---|---|---|---|---|---|---|
| 113 Hawley St Binghamton, NY | 4.0 | 1.5 | 1637 | $2,000 | $1.22 | 46d | 1 | 0.71mi |
| 90 Conklin Ave Binghamton, NY | 5.0 | 2.0 | 2000 | $575 | $0.29 | 15d | 1 | 1.03mi |
| 198 Chapin St Binghamton, NY | 4.0 | 2.0 | 1500 | $1,700 | $1.13 | 23d | 1 | 1.04mi |
| 16 North St Unit 1-1 Binghamton, NY | 5.0 | 2.0 | 2600 | $650 | $0.25 | 46d | 1 | 1.04mi |
| 171 Chapin St Unit 1st FL Binghamton, NY | 4.0 | 1.5 | 1400 | $3,000 | $2.14 | 46d | 1 | 1.12mi |
| 2 Chapel Pl Binghamton, NY | 6.0 | 3.0 | 2600 | $650 | $0.25 | 46d | 1 | 1.21mi |
| 607 Chenango St Binghamton, NY | 5.0 | 2.5 | 2500 | $2,800 | $1.12 | 15d | 1 | 1.23mi |
| 44 Leroy St Binghamton, NY | 6.0 | 2.0 | 1772 | $3,000 | $1.69 | 23d | 1 | 1.38mi |
| 19 Walnut St Binghamton, NY | 5.0 | 2.0 | 1666 | $2,250 | $1.35 | 46d | 1 | 1.45mi |
| 22 Ayres St Binghamton, NY | 4.0 | 2.0 | 2333 | $2,560 | $1.10 | 46d | 1 | 1.50mi |
Listing history 28 events
-
2026-06-21days on market $145,000 Active 53 DOM
-
2026-06-19days on market $145,000 Active 51 DOM
-
2026-06-18days on market $145,000 Active 50 DOM
-
2026-06-17days on market $145,000 Active 49 DOM
-
2026-06-16days on market $145,000 Active 48 DOM
-
2026-06-15days on market $145,000 Active 47 DOM
-
2026-06-14days on market $145,000 Active 45 DOM
-
2026-06-13days on market $145,000 Active 44 DOM
-
2026-06-10days on market $145,000 Active 42 DOM
-
2026-06-09days on market $145,000 Active 41 DOM
-
2026-06-08days on market $145,000 Active 40 DOM
-
2026-06-07days on market $145,000 Active 39 DOM
-
2026-06-03days on market $145,000 Active 35 DOM
-
2026-06-02days on market $145,000 Active 34 DOM
-
2026-06-01days on market $145,000 Active 33 DOM
-
2026-05-31days on market $145,000 Active 32 DOM
-
2026-05-30days on market $145,000 Active 31 DOM
-
2026-04-29$145,000 Active 409-char remark
-
2025-09-04$165,000 Active
-
2024-08-26soldstatus $78,500
-
2024-08-22soldstatus $78,500 Closed
Show marketing remark (402 chars)
This well-maintained two-family property presents a fantastic investment opportunity. Boasting a 17% cap rate, it offers reliable cash flow from two long-term tenants who are consistently current on their rent payments. Property is minutes to highway access and downtown. Don't miss this opportunity to add a reliable income-generating property to your portfolio. Reach out today to schedule a viewing!
-
2024-05-27status Pending
Show marketing remark (402 chars)
This well-maintained two-family property presents a fantastic investment opportunity. Boasting a 17% cap rate, it offers reliable cash flow from two long-term tenants who are consistently current on their rent payments. Property is minutes to highway access and downtown. Don't miss this opportunity to add a reliable income-generating property to your portfolio. Reach out today to schedule a viewing!
-
2024-05-23$74,900 Active
Show marketing remark (402 chars)
This well-maintained two-family property presents a fantastic investment opportunity. Boasting a 17% cap rate, it offers reliable cash flow from two long-term tenants who are consistently current on their rent payments. Property is minutes to highway access and downtown. Don't miss this opportunity to add a reliable income-generating property to your portfolio. Reach out today to schedule a viewing!
-
2023-10-12price $74,000
-
2023-10-07status Active
-
2023-09-29status Pending
-
2023-08-22$75,000 Active
-
2011-05-06soldstatus $45,000
ⓘ Source: listings_history table (triggers on properties + properties_extension) + one-shot
backfill from property_details.listing_events for pre-trigger history.
Tax reassessment forecast NY · Partial reset (capped growth)
- Current annual tax
- $3,480 · $290/mo
- Projected year-2 tax
- $3,480 · $290/mo
- Expected delta
- $0/yr ($0/mo · 0.0%)
ⓘ Screening estimate from a state-policy table — verify with the county assessor before closing.
Climate risk First Street
- Flood 1/10 Low FEMA zone X · 0% chance over 30 yrs
- Wildfire 1/10 Low
- Heat 3/10 Moderate 8 d/yr ≥92°F today · 17 d/yr by 30 yrs out
- Wind 2/10 Low 100% chance of damaging wind over 30 yrs
- Air quality 2/10 Low 0 unhealthy d/yr today · 1 by 30 yrs out
Nearby sold comps map
Loading sold comps map…
Walkable amenities ~0.75 mi
Loading nearby amenities…
Taxation est. · year 1
- Rental income
- $40,704
- − Mortgage interest
- −$8,122
- − Property taxes
- −$3,480
- − Insurance
- −$725
- − Repairs & maintenance
- −$3,256
- − Management
- −$3,256
- − Depreciation
- −$4,218
- Taxable income
- $17,646
- Est. tax owed @ 24.0%
- −$4,235
- After-tax cash flow
- $14,592/yr
For passive investors: Depreciation is non-cash, so a rental often shows a tax loss while cash-flowing — sheltering income. Rental losses are passive: they offset passive income freely, and up to $25,000/yr can offset ordinary (W-2) income if you actively participate and your MAGI is under $100k (phasing out to $0 by $150k); unused losses carry forward. On sale, claimed depreciation is recaptured at up to 25%, and gains may owe capital-gains tax (a 1031 exchange can defer both). Figures are a year-1 estimate at your 24.0% rate — not tax advice; consult a CPA.
Schools (NCES district)
- District
- Binghamton City School District
- NCES district ID
- 3604870
- Math proficiency
- 30% ▬ 0.00%
- Reading proficiency
- 44% ▲ 15.00%
- Median HH income
- $30,475
- Composite
- 30.09/100
- National rank
- #6342
- State rank
- #557 of 590 in NY
Livability — Binghamton
- Score
- 78/100
- State rank
- #174
- US rank
- #2710
Category grades
Schools grade is shown separately in the Schools card above.
Census & demographics
- Census place
- Binghamton, NY
- County
- Broome County · 126,805 people
- City population
- 65,170
- Metro
- Binghamton, NY
- Population (ZIP)
- 19,613
- Household income
- $55,523
- Rent vs Own
- Severe rent burden
- 1230.0
Population outlook (Broome County) Hauer SSP2
- Today (2025)
- 187,989 people
- By 2030
- 183,066 · -2.6%
- By 2040
- 172,228 · -8.4%
- By 2050
- 163,161 · -13.2%
- By 2075
- 153,641 · -18.3%
- By 2100
- 140,851 · -25.1%
Race, ethnicity, and origin ACS 2023
- Neighborhood character
- Predominantly White (80%)
- Race & ethnicity
- White 80% Two or more races 7% Hispanic / Latino 7% Black 5% Asian 2%
- Hispanic origin (detail)
- Puerto Rican 3%
- Common ancestry
- Romanian 6% Lithuanian 1% Italian 1%
- Foreign-born
- 5% · Canada, Jamaica
- Languages at home
- 93% English-only · Spanish 3% Russian/Polish/Slavic 1% Other Indo-European 1%
Political lean MEDSL · Broome
- 2024 margin
- Toss-up / Even · D 50.2% · R 49.8%
- 2008→2024 swing
- -7.6pp toward R · 2008: 8.0pp · 2024: 0.4pp
- All cycles
- 2024: D+0.4 2020: D+3.5 2016: R+3.7 2012: D+4.6 2008: D+8.0
Not yet ingested
- Civics
- —
Market trends
- HPI YoY
- ▼ -16.13%
- Current HPI
- 300.7692
- Rent YoY
- —
- Metro
- Binghamton, NY
- State GDP YoY
- ▲ 2.60%
- F500 in state
- 92
Industry mix (Fortune 500 HQ in NY)
| Industry | F500 HQs | Revenue |
|---|---|---|
| Financial Services | 10 | $950B |
|
||
| Consumer Goods | 9 | $162B |
|
||
| Insurance | 4 | $225B |
|
||
| Telecommunications | 2 | $144B |
|
||
| Pharmaceuticals | 2 | $112B |
|
||
| Media / Entertainment | 2 | $69B |
|
||
Price history
+222.2% since first listed11 events — show timeline
- 2026-04-29 Listed $145,000 GBAOR
- 2025-09-04 Listed $165,000 GBAOR
- 2024-08-26 Sold (Public Records) $78,500 Public Records
- 2024-08-22 Sold (MLS) $78,500 GBAOR
- 2024-05-27 Pending — GBAOR
- 2024-05-23 Listed $74,900 GBAOR
- 2023-10-12 Price Changed $74,000 GBAOR
- 2023-10-07 Relisted — GBAOR
- 2023-09-29 Pending — GBAOR
- 2023-08-22 Listed $75,000 GBAOR
- 2011-05-06 Sold (Public Records) $45,000 Public Records
Property tax history
+4.7%/yrLatest (2025): $3,480 · +0.9% YoY. Source: county tax records.
Cash-flow waterfall
monthlySold comps — $/sqft
last 12 mo · ≤1 miLoading sold comps…