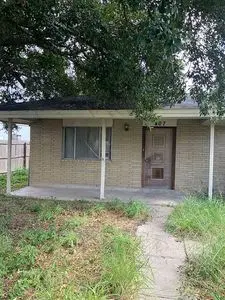
407 Beam Station Rd · Alice, TX
Flood risk 4/10 · Minor
- FEMA flood zone
- X
- Chance of flooding over 30 yrs
- 0.24%
- Est. flood insurance / yr
- $507 – $1,088
Fire risk 7/10 · Major
- Est. fire insurance / yr
- $1,222 – $2,270
Heat risk 9/10 · Severe
- Hot days now (above 113°F)
- 7 days/yr
- Hot days in 30 yrs
- 20 days/yr
Wind risk 8/10 · Major
- Chance of severe wind over 30 yrs
- 99.0%
Air-quality risk 1/10 · Minimal
- Unhealthy air days now
- 0 days/yr
- Unhealthy air days in 30 yrs
- 0 days/yr
Risk factors via First Street. Map © Google.
Why this score? — see what drove the B- grade
The composite is a weighted blend of 9 inputs, each scored 0–100. Each bar is that input's sub-score; the figure is the points it added to the 100-point composite (weight × sub-score).
- Cash flow +30.0/30.0
- 1% rule +10.0/10.0
- DSCR +10.0/10.0
- ARV discount +7.5/15.0
- Livability +3.4/5.0
- Rent growth +2.5/5.0
- Schools +1.5/10.0
- Condition / age +1.0/5.0
- Appreciation +0.0/10.0
$55,000
🖨 Deal sheet 📄 Offer letter ✓ Due diligence
Listing remarks
Low price needs work & acirc; & euro; & brvbar; priced to sell
Key facts
- Built 1982
- Listed 13 days
Neighborhood map
What this means for you Summary
Snapshot
- This is a 3-bed/2.0-bath single-family listed at $55k. Condition is rated poor.
Deal economics
- At list price, monthly cash flow is $563 ($7k/yr) — positive.
- The deal already cash-flows at list — no discount required.
- Meets the 1% rule at list price ($1k rent vs $55k).
- Cap rate 18.6% vs local median 4.1% in Alice — top-decile yield for the area; either an underpriced asset or a hidden risk that comps aren't pricing in. Stress-test before assuming the spread holds.
Location & tenants
- Location reads 67/100 on livability (#558 in TX) — a middle-class / working-renter tenant base. Strengths: cost of living A+, health & safety A+, housing A; Watch: employment D, schools D-, crime F.
- Alice ISD (town): math 12% / reading 23% proficiency, ranked #799 of 826 in TX (top 97%) — low school quality limits family demand, transient renter base, plan for 1-2y turnover; 70% free/reduced lunch — lower-income household profile, screen leases tightly.
- Market conditions: 220 active listings in the ZIP; 1 comparable units currently listed for rent nearby; 6 units permitted in Jim Wells County in 2024 (0 in 5+ unit buildings).
Forward outlook
- Local home prices are declining (-3.0%/yr); year-one equity from $380 of loan paydown is wiped out by about $2k of value loss. Plan a longer hold.
- Jim Wells County population projected at +10% by 2050 — modest demand growth; plan on rents tracking national, not racing it.
- At projected returns (-3.0% appreciation + 3.0% rent growth), your $15k cash investment doubles in ~3 years — after that, you're playing with house money.
Negotiation context
- Only 14 days on market — expect competitive offers; lowballing is unlikely to land.
Risks & watch-outs
- Climate carrying-cost: severe wind risk, 99% chance of damaging wind over 30y; major wildfire risk; extreme-heat days projected 7→20/yr by 2055 (HVAC capex compounding) — expect insurance premiums to compound above CPI over the hold.
Questions for the listing agent
- Have any recent inspections been done? Can we get a copy of the seller's disclosures and any deferred-maintenance estimates?
- Is there a deadline driving the sale (1031 exchange, divorce, estate, relocation)? That informs how much negotiation room exists.
- Schools are D-rated, which usually means shorter tenancies and higher turnover. Who's the typical renter profile here, and what's been the actual vacancy rate?
- Crime grade is F in this area — have there been break-ins, vandalism, or insurance claims at this property in the last 3 years? What carrier currently insures it and at what premium?
- What's the average days-on-market for RENTAL listings here right now (not sales)? A rising rental-DOM trend means longer vacancies and softer asking-rent achievability than the comps imply.
- What's the recent tenant-quality profile in this submarket — average credit score on applications, eviction rate, late-payment / NSF rate, and stable-employment percentage? A property-management company in the area should have these aggregated.
- How much new for-sale + rental construction is in the pipeline within 1–3 miles? Heavy new supply typically softens prices + rents 12–24 months out; constrained supply supports both.
Investment metrics
- 1% rule
- 2.18% ✓
- Cap rate
- 18.57%
- Cash-on-cash
- 43.83%
- DSCR
- 2.95
- GRM
- 3.8
CMA / ARV
- ARV (median comp)
- $123,289
- List price
- $55,000
- Delta
- -55.39%
- Verdict
- UNDERPRICED
- Comps
- 20 within 1.0 mi
Show comp detail 3 sales within ~0.75 mi
| Address | Dist | Beds/Ba | Sqft | Sold | Price | $/sf | Match |
|---|---|---|---|---|---|---|---|
| 2261 W Front | 0.57mi | 3/1.0 | 1,284 (-1%) | 10mo | $199,000 | $155 | 58 |
| 1720 Gunn St | 0.61mi | 3/1.0 | 1,284 (-1%) | 19mo | $179,000 | $139 | 49 |
| 1723 Carmen St | 0.51mi | 2/1.0 (-1) | 1,320 (+1%) | 22mo | $59,000 | $45 | 46 |
Match score weights: distance 35% · size 25% · config 20% · recency 20%. Top-matched comps best support the ARV.
Projected returns pro-forma
-3.0% appreciation · 3.0% rent growth · sell at horizon
- IRR
- 40.8%
- Equity multiple
- 2.75×
- Total profit
- $26,935
- Equity at exit
- $8,201
- IRR
- 47.0%
- Equity multiple
- 5.52×
- Total profit
- $69,674
- Equity at exit
- $4,755
Cash invested: $15,400 (down + closing). Projections, not guarantees.
Landlord ↔ Tenant lean methodology
- Overall (STATE)
- 87 Strongly Landlord-Friendly
- State Texas
- 87 Strongly Landlord-Friendly · R+5
- County
- — inherits STATE
- City
- — inherits STATE
ZIP-level market 78332
- Active inventory
- 220
- Price-to-rent
- 3.8×
Monthly cashflow live
- Estimated rent
- $1,200 medium interval (Pro) →
- Mortgage (P&I)
- −$288
- Tax from tax record
- −$74 /mo · $890/yr
- Insurance
- −$23
- HOA
- −$0
- Vacancy / Maint / Mgmt
- −$252
- Net cashflow
- $563
Break-even live
UW: 25.0% down · 7.5% · 30yr · 1.5% tax · 5.0% vac · 8.0% maint · 8.0% mgmt
Financing live
Cash to close
- Down payment
- $13,750
- Closing costs
- $1,650
- Reserves months
- —
- Total cash needed
- —
Loan-product check · same deal, 3 products live
Conventional
25% down · 7.5% · 30yr
- Down + closing
- —
- Monthly P&I
- —
- Monthly cashflow
- —
- DSCR
- —
- Eligible?
- —
Personal DTI + credit; lowest rate.
DSCR
20% down · 8.5% · 30yr
- Down + closing
- —
- Monthly P&I
- —
- Monthly cashflow
- —
- DSCR
- —
- Eligible?
- —
No personal income docs; deal must DSCR.
Hard money
10% down · 12.0% · 12mo
- Down + closing
- —
- Monthly P&I
- —
- Monthly cashflow
- —
- DSCR
- —
- Eligible?
- —
Short-term bridge; refi at stabilization.
Rent comps 1 comps
| Address | Beds | Baths | Sqft | Rent | $/sqft | DOM | Units | Dist |
|---|---|---|---|---|---|---|---|---|
| 516 E 6th St Unit B Alice, TX | 2.0 | 1.0 | 920 | $1,200 | $1.30 | 23d | 1 | 1.48mi |
Listing history 1 events
-
2026-05-12$55,000 Active 56-char remark
ⓘ Source: listings_history table (triggers on properties + properties_extension) + one-shot
backfill from property_details.listing_events for pre-trigger history.
Tax reassessment forecast TX · Resets to sale price
- Current annual tax
- $890 · $74/mo
- Projected year-2 tax
- $1,006 · $84/mo
- Expected delta
- +$117/yr (+$10/mo · 13.1%)
ⓘ Screening estimate from a state-policy table — verify with the county assessor before closing.
Climate risk First Street
- Flood 4/10 Moderate FEMA zone X · 24% chance over 30 yrs
- Wildfire 7/10 Severe
- Heat 9/10 Extreme 7 d/yr ≥113°F today · 20 d/yr by 30 yrs out
- Wind 8/10 Severe 99% chance of damaging wind over 30 yrs
- Air quality 1/10 Low 0 unhealthy d/yr today · 0 by 30 yrs out
Nearby sold comps map
Loading sold comps map…
Walkable amenities ~0.75 mi
Loading nearby amenities…
Taxation est. · year 1
- Rental income
- $14,400
- − Mortgage interest
- −$3,081
- − Property taxes
- −$890
- − Insurance
- −$275
- − Repairs & maintenance
- −$1,152
- − Management
- −$1,152
- − Depreciation
- −$1,600
- Taxable income
- $6,250
- Est. tax owed @ 24.0%
- −$1,500
- After-tax cash flow
- $5,250/yr
For passive investors: Depreciation is non-cash, so a rental often shows a tax loss while cash-flowing — sheltering income. Rental losses are passive: they offset passive income freely, and up to $25,000/yr can offset ordinary (W-2) income if you actively participate and your MAGI is under $100k (phasing out to $0 by $150k); unused losses carry forward. On sale, claimed depreciation is recaptured at up to 25%, and gains may owe capital-gains tax (a 1031 exchange can defer both). Figures are a year-1 estimate at your 24.0% rate — not tax advice; consult a CPA.
Condition & rehab AI · 1 photo
This property requires extensive repairs and improvements to become move-in ready. Immediate focus should be on the roof, exterior siding, and landscaping to significantly increase its value.
Repairs flagged
- Major roof — No visible roof
- Major exterior siding — No visible siding
- Major landscaping — No visible landscaping
Value-add opportunities
- Both roof replacement — Critical to safety and appearance
- Both exterior siding repair — Improves curb appeal and value
- Both landscaping — Enhances curb appeal and property value
Renovation cost estimate screening
| Repair item | Severity | Est. cost |
|---|---|---|
| roof · No visible roof | Major | $15,000–50,000 |
| exterior siding · No visible siding | Major | $15,000–50,000 |
| landscaping · No visible landscaping | Major | $15,000–50,000 |
| Total estimated repair cost · 3 items | $45,000–150,000 |
Value-add ROI direction
- Both roof replacement — Critical to safety and appearance ↑
- Both exterior siding repair — Improves curb appeal and value ↑
- Both landscaping — Enhances curb appeal and property value ↑
ⓘ Cost ranges are severity-bucket heuristics (US national rule-of-thumb). Get contractor quotes + a written scope before underwriting a rehab budget.
Schools (NCES district)
- District
- Alice ISD
- NCES district ID
- 4807800
- Math proficiency
- 12% ▼ -18.00%
- Reading proficiency
- 23% ▼ -7.00%
- Median HH income
- $37,747
- Composite
- 14.63/100
- National rank
- #9407
- State rank
- #799 of 826 in TX
Livability — Alice
- Score
- 67/100
- State rank
- #558
- US rank
- #10742
Category grades
Schools grade is shown separately in the Schools card above.
Census & demographics
- Census place
- Alice, TX
- Population (ZIP)
- 27,281
Population outlook (Jim Wells County) Hauer SSP2
- Today (2025)
- 43,325 people
- By 2030
- 44,156 · +1.9%
- By 2040
- 45,790 · +5.7%
- By 2050
- 47,455 · +9.5%
- By 2075
- 51,800 · +19.6%
- By 2100
- 52,006 · +20.0%
Race, ethnicity, and origin ACS 2023
- Neighborhood character
- Predominantly Hispanic (84%)
- Race & ethnicity
- Hispanic / Latino 84% White 14% Two or more races 14%
- Hispanic origin (detail)
- Mexican 76%
- Foreign-born
- 4% · Canada
- Languages at home
- 50% English-only · Spanish 49%
Political lean MEDSL · Jim Wells
- 2024 margin
- R (+15.5) · D 42.0% · R 57.5%
- 2008→2024 swing
- -31.6pp toward R · 2008: 16.1pp · 2024: -15.5pp
- All cycles
- 2024: R+15.5 2020: R+9.8 2016: D+10.3 2012: D+17.0 2008: D+16.1
Not yet ingested
- Civics
- —
Market trends
- HPI YoY
- ▼ -123.86%
- Current HPI
- 77.6253
- Rent YoY
- —
- Metro
- —
- State GDP YoY
- ▲ 3.95%
- F500 in state
- 110
Industry mix (Fortune 500 HQ in TX)
| Industry | F500 HQs | Revenue |
|---|---|---|
| Energy | 16 | $1,198B |
|
||
| Technology | 5 | $198B |
|
||
| Engineering / Construction | 4 | $72B |
|
||
| Energy Services | 3 | $60B |
|
||
| Utilities | 3 | $41B |
|
||
| Healthcare | 2 | $330B |
|
||
Property tax history
+1.6%/yrLatest (2025): $890 · +1.6% YoY. Source: county tax records.
Cash-flow waterfall
monthlySold comps — $/sqft
last 12 mo · ≤1 miLoading sold comps…