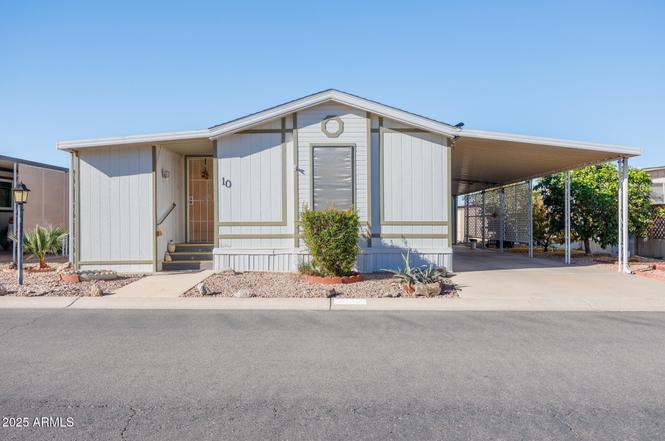
450 W Sunwest Dr #10 · Casa Grande, AZ
Flood risk 1/10 · Minimal
- FEMA flood zone
- X (unshaded)
- Chance of flooding over 30 yrs
- 0.0%
- Est. flood insurance / yr
- $507 – $1,088
Fire risk 6/10 · Moderate
- Est. fire insurance / yr
- $610 – $1,132
Heat risk 9/10 · Severe
- Hot days now (above 113°F)
- 6 days/yr
- Hot days in 30 yrs
- 15 days/yr
Wind risk 1/10 · Minimal
- Chance of severe wind over 30 yrs
- —
Air-quality risk 2/10 · Minimal
- Unhealthy air days now
- 1 days/yr
- Unhealthy air days in 30 yrs
- 1 days/yr
Risk factors via First Street. Map © Google.
Why this score? — see what drove the B- grade
The composite is a weighted blend of 9 inputs, each scored 0–100. Each bar is that input's sub-score; the figure is the points it added to the 100-point composite (weight × sub-score).
- Cash flow +30.0/30.0
- 1% rule +10.0/10.0
- DSCR +10.0/10.0
- ARV discount +7.6/15.0
- Rent growth +3.7/5.0
- Livability +2.9/5.0
- Condition / age +2.5/5.0
- Schools +1.5/10.0
- Appreciation +0.0/10.0
$57,900
🖨 Deal sheet (PDF) 📄 Offer letter ✓ Due diligence
Listing remarks
A charming 2-bedroom, 2-bath home featuring a bright Arizona sunroom filled with natural light. Recent upgrades include new vinyl flooring and an energy-efficient AC unit for modern comfort. The primary bathroom offers an accessible walk-in tub along with updated plumbing, including new water lines and shut-off valves. An open kitchen and living area create a spacious, welcoming feel. Additional highlights include a storage shed, covered parking, and a wheelchair ramp for added convenience and accessibility—ideal for comfortable, easy living.
Key facts
- Arizona sunroom
- New water lines
- Open kitchen
Tags
Property features AI
Finance
- Other: Lot size information from assessor; Building area source: owner; Directions: From Pinal West on Cottonwood to Sunwest RV Park and Resort
- HOA & community: Community pool; Land lease of $640 per month; Association fee includes other items (see remarks)
Exterior
- Parking: 2 covered parking spaces; 2 open parking spaces; 2 carport spaces
- Security: Gated community
- Utilities: Private water company; Public sewer
- Home design: Manufactured/mobile home; Leasehold ownership
- Construction: Wood siding and steel frame construction; Composition roof
- Exterior features: Shed(s); Gravel/stone front and back
Interior
- Kitchen: Refrigerator; Dishwasher; Disposal
- Bedrooms: 2 bedrooms (possible)
- Flooring: Carpet; Linoleum; Vinyl
- Bathrooms: 2 full bathrooms
- Heating & cooling: Electric heating; Central air; Ceiling fans; Programmable thermostat
- Interior features: High-speed internet; Eat-in kitchen; Tub with jets; Accessible approach with ramp
Neighborhood map
What this means for you Summary
Snapshot
- This is a 2-bed/2.0-bath manufactured listed at $58k.
Deal economics
- At list price, monthly cash flow is $783 ($9k/yr) — positive.
- The deal already cash-flows at list — no discount required.
- Meets the 1% rule at list price ($1k rent vs $58k).
- Recommended offer: $51k (12.0% below list) — sets the bar for market timing.
- Cap rate 22.5% vs local median 4.0% in Casa Grande — top-decile yield for the area; either an underpriced asset or a hidden risk that comps aren't pricing in. Stress-test before assuming the spread holds.
Location & tenants
- Location reads 58/100 on livability (#220 in AZ) — a working-class tenant base; expect higher turnover. Strengths: cost of living A+, housing A+; Watch: crime D+, employment D+, schools F.
- Casa Grande Union High School District (4453) (suburban): math 14% / reading 21% proficiency, ranked #193 of 249 in AZ (top 78%) — low school quality limits family demand, transient renter base, plan for 1-2y turnover.
- Market conditions: Rents rising fast (+4.6%/yr); 633 active listings in the ZIP; 21 comparable units currently listed for rent nearby; rentals at typical pace (median 16d on market — plan ~3-4 weeks tenant-placement turnaround); 9,504 units permitted in Pinal County in 2024 (776 in 5+ unit buildings).
Forward outlook
- Local home prices are declining (-3.0%/yr); year-one equity from $400 of loan paydown is wiped out by about $2k of value loss. Plan a longer hold.
- At projected returns (-3.0% appreciation + 4.6% rent growth), your $16k cash investment doubles in ~2 years — after that, you're playing with house money.
Negotiation context
- It's been on market 181 days — a 12% lower offer ($51k) is reasonable based on typical stale-listing flexibility.
- 2 sale attempts; this cycle's ask has dropped $19k (25%) from the opening price — seller is motivated, your offer sets the floor, not the list.
Risks & watch-outs
- Climate carrying-cost: major wildfire risk; extreme-heat days projected 6→15/yr by 2055 (HVAC capex compounding) — expect insurance premiums to compound above CPI over the hold.
Questions for the listing agent
- It's been on market 181 days. Have you received any prior offers? Is the seller open to a 12% concession, seller financing, or rate buy-down credit?
- Why hasn't it sold? Are there any deal-killer items the seller is aware of (foundation, flood, title, zoning, code violations)?
- Is there a deadline driving the sale (1031 exchange, divorce, estate, relocation)? That informs how much negotiation room exists.
- Schools are F-rated, which usually means shorter tenancies and higher turnover. Who's the typical renter profile here, and what's been the actual vacancy rate?
- Crime grade is D in this area — have there been break-ins, vandalism, or insurance claims at this property in the last 3 years? What carrier currently insures it and at what premium?
- What's the average days-on-market for RENTAL listings here right now (not sales)? A rising rental-DOM trend means longer vacancies and softer asking-rent achievability than the comps imply.
- What's the recent tenant-quality profile in this submarket — average credit score on applications, eviction rate, late-payment / NSF rate, and stable-employment percentage? A property-management company in the area should have these aggregated.
- How much new for-sale + rental construction is in the pipeline within 1–3 miles? Heavy new supply typically softens prices + rents 12–24 months out; constrained supply supports both.
Investment metrics
- 1% rule
- 2.59% ✓
- Cap rate
- 22.53%
- Cash-on-cash
- 57.98%
- DSCR
- 3.58
- GRM
- 3.2
CMA / ARV
- ARV (on-the-fly)
- $58,080
- Comps found
- 12
Show comp detail 12 sales within ~0.75 mi
| Address | Dist | Beds/Ba | Sqft | Sold | Price | $/sf | Match |
|---|---|---|---|---|---|---|---|
| 426 W Cottonwood Ln #83 | 0.14mi | 2/2.0 | 1,045 (-1%) | 1mo | $78,000 | $75 | 91 |
| 450 W Sunwest Dr #111 | 0.00mi | 2/2.0 | 1,024 (-3%) | 6mo | $45,000 | $44 | 90 |
| 450 W Sunwest Dr #69 | 0.09mi | 2/2.0 | 960 (-9%) | 4mo | $67,500 | $70 | 77 |
| 450 W Sunwest Dr #135 | 0.00mi | 2/2.0 | 960 (-9%) | 10mo | $53,000 | $55 | 76 |
| 450 W Sunwest Dr #139 | 0.00mi | 3/2.0 (+1) | 1,152 (+9%) | 6mo | $75,000 | $65 | 75 |
| 120 W O'neil Dr #58 | 0.46mi | 3/2.0 (+1) | 1,056 (0%) | 2mo | $48,999 | $46 | 72 |
| 426 W Cottonwood Ln #25 | 0.22mi | 2/2.0 | 930 (-12%) | 8mo | $60,000 | $65 | 64 |
| 120 W Oneil Dr #48 | 0.46mi | 2/1.5 | 980 (-7%) | 2mo | $20,000 | $20 | 63 |
| 120 W Oneil Dr #71 | 0.44mi | 2/2.0 | 960 (-9%) | 5mo | $38,000 | $40 | 60 |
| 1409 N French St #78 | 0.58mi | 2/2.0 | 968 (-8%) | 1mo | $79,000 | $82 | 58 |
| 708 W Mcmurray Blvd #38 | 0.61mi | 3/2.0 (+1) | 900 (-15%) | 8mo | $30,000 | $33 | 35 |
| 1451 N Pinal Ave #31 | 0.48mi | 1/1.0 (-1) | 900 (-15%) | 11mo | $15,000 | $17 | 35 |
Match score weights: distance 35% · size 25% · config 20% · recency 20%. Top-matched comps best support the ARV.
Projected returns pro-forma
-3.0% appreciation · 4.6% rent growth · sell at horizon
- IRR
- 58.3%
- Equity multiple
- 3.65×
- Total profit
- $42,977
- Equity at exit
- $8,633
- IRR
- 63.7%
- Equity multiple
- 7.92×
- Total profit
- $112,139
- Equity at exit
- $5,006
Cash invested: $16,212 (down + closing). Projections, not guarantees.
Landlord ↔ Tenant lean methodology
- Overall (STATE)
- 87 Strongly Landlord-Friendly
- State Arizona
- 87 Strongly Landlord-Friendly · R+3
- County
- — inherits STATE
- City
- — inherits STATE
ZIP-level market 85122
- Home prices YoY
- -22.4%
- Rents YoY
- 4.6%
- Active inventory
- 633
- Price-to-rent
- 3.2×
Monthly cashflow live
- Estimated rent
- $1,498 high interval (Pro) →
- Mortgage (P&I)
- −$304
- Tax est. 1.5%
- −$72 /mo · $868/yr
- Insurance
- −$24
- HOA
- −$0
- Vacancy / Maint / Mgmt
- −$315
- Net cashflow
- $783
Break-even live
Sensitivity live
| Price | -10% $823 | -5% $803 | +0% $783 | +5% $763 | +10% $743 |
|---|---|---|---|---|---|
| Rent | -10% $665 | -5% $724 | +0% $783 | +5% $842 | +10% $902 |
| Rate | -1.0pp $812 | -0.5pp $798 | base $783 | +0.5pp $768 | +1.0pp $753 |
UW: 25.0% down · 7.5% · 30yr · 1.5% tax · 5.0% vac · 8.0% maint · 8.0% mgmt
Financing live
Cash to close
- Down payment
- $14,475
- Closing costs
- $1,737
- Reserves months
- —
- Total cash needed
- —
Loan-product check · same deal, 3 products live
Conventional
25% down · 7.5% · 30yr
- Down + closing
- —
- Monthly P&I
- —
- Monthly cashflow
- —
- DSCR
- —
- Eligible?
- —
Personal DTI + credit; lowest rate.
DSCR
20% down · 8.5% · 30yr
- Down + closing
- —
- Monthly P&I
- —
- Monthly cashflow
- —
- DSCR
- —
- Eligible?
- —
No personal income docs; deal must DSCR.
Hard money
10% down · 12.0% · 12mo
- Down + closing
- —
- Monthly P&I
- —
- Monthly cashflow
- —
- DSCR
- —
- Eligible?
- —
Short-term bridge; refi at stabilization.
Rent comps 21 comps
| Address | Beds | Baths | Sqft | Rent | $/sqft | DOM | Units | Dist |
|---|---|---|---|---|---|---|---|---|
| 541 W Melrose Dr Casa Grande, AZ | 3.0 | 2.0 | 1101 | $1,600 | $1.45 | 25d | 1 | 0.40mi |
| 290 W Viola St Unit 4 Casa Grande, AZ | 2.0 | 1.0 | 800 | $1,250 | $1.56 | 16d | 1 | 0.51mi |
| 767 W Barrus Dr Casa Grande, AZ | 3.0 | 2.0 | 1463 | $1,695 | $1.16 | 25d | 1 | 0.55mi |
| 1858 N Center Ave Casa Grande, AZ | 2.0 | 2.0 | 1146 | $1,500 | $1.31 | 25d | 1 | 0.75mi |
| 645 W Jardin Dr Casa Grande, AZ | 3.0 | 2.0 | 1309 | $1,650 | $1.26 | 25d | 1 | 0.78mi |
| 701 W 12th St Unit F Casa Grande, AZ | 2.0 | 1.0 | 745 | $1,500 | $2.01 | 25d | 1 | 0.82mi |
| 803 W Jardin Dr Casa Grande, AZ | 3.0 | 2.0 | 1491 | $1,725 | $1.16 | 5d | 1 | 0.85mi |
| 1550 N Casa Grande Ave Casa Grande, AZ | 1.0–2.0 | 1.0–2.0 | 625 | $1,199 | $1.92 | 0d | 1 | 0.87mi |
| 1641 N Kadota Ave Casa Grande, AZ | 1.0–2.0 | 1.0–2.0 | 750 | $1,100 | $1.47 | 0d | 3 | 0.94mi |
| 1010 N Park Ave Casa Grande, AZ | 2.0 | 1.0 | 920 | $1,100 | $1.20 | 14d | 1 | 0.96mi |
| 1564 N Morrison Ave Casa Grande, AZ | 2.0–3.0 | 2.0 | 871 | $956 | $1.10 | 0d | 19 | 0.97mi |
| 416 W 9th St Unit 1 Casa Grande, AZ | 2.0 | 1.0 | 725 | $1,200 | $1.66 | 14d | 1 | 1.00mi |
| 1113 W Corinthian Cir Casa Grande, AZ | 3.0 | 2.0 | 981 | $1,395 | $1.42 | 16d | 1 | 1.01mi |
| 300 W 9th St Casa Grande, AZ | 2.0 | 1.0 | 775 | $999 | $1.29 | 23d | 1 | 1.03mi |
| 419 W 9th St Apt A Casa Grande, AZ | 2.0 | 1.0 | 750 | $1,199 | $1.60 | 25d | 1 | 1.03mi |
| 776 W Fairlane Ct Casa Grande, AZ | 3.0 | 2.0 | 1489 | $3,200 | $2.15 | 25d | 1 | 1.06mi |
| 803 N Park Ave Casa Grande, AZ | 2.0 | 1.0 | 822 | $1,275 | $1.55 | 6d | 1 | 1.12mi |
| 2094 N Sweetwater Dr Casa Grande, AZ | 3.0 | 2.0 | 1266 | $1,700 | $1.34 | 25d | 1 | 1.14mi |
| 1926 N Avenida de Palmas Casa Grande, AZ | 2.0 | 2.0 | 1106 | $1,199 | $1.08 | 23d | 3 | 1.35mi |
| 1620 N Trekell Rd Casa Grande, AZ | 1.0–3.0 | 1.0–2.5 | 1090 | $2,165 | $1.99 | 0d | 1 | 1.36mi |
| 1161 E O'Neil Dr Casa Grande, AZ | 2.0–4.0 | 2.0 | 1144 | $1,295 | $1.13 | 0d | 13 | 1.49mi |
Listing history 25 events
-
2026-06-21days on market $57,900 Active 181 DOM
-
2026-06-18days on market $57,900 Active 178 DOM
-
2026-06-17days on market $57,900 Active 177 DOM
-
2026-06-16days on market $57,900 Active 176 DOM
-
2026-06-15price $57,900 Active 175 DOM
-
2026-06-15days on market $65,500 Active 175 DOM
-
2026-06-13days on market $65,500 Active 173 DOM
-
2026-06-13days on market $65,500 Active 172 DOM
-
2026-06-09days on market $65,500 Active 169 DOM
-
2026-06-08days on market $65,500 Active 168 DOM
-
2026-06-07days on market $65,500 Active 167 DOM
-
2026-06-04days on market $65,500 Active 164 DOM
-
2026-06-03days on market $65,500 Active 163 DOM
-
2026-06-02days on market $65,500 Active 162 DOM
-
2026-06-01days on market $65,500 Active 161 DOM
-
2026-05-31days on market $65,500 Active 160 DOM
-
2026-05-09price $65,500
-
2026-03-23price $68,999
-
2026-03-04price $71,999
-
2026-01-29price $74,999
-
2025-12-19$76,999 Active
-
2025-12-16historical
-
2025-09-19price $76,999
-
2025-07-14price $78,999
-
2025-06-26$84,999 Active
ⓘ Source: listings_history table (triggers on properties + properties_extension) + one-shot
backfill from property_details.listing_events for pre-trigger history.
Climate risk First Street
- Flood 1/10 Low FEMA zone X (unshaded) · 0% chance over 30 yrs
- Wildfire 6/10 Major
- Heat 9/10 Extreme 6 d/yr ≥113°F today · 15 d/yr by 30 yrs out
- Wind 1/10 Low
- Air quality 2/10 Low 1 unhealthy d/yr today · 1 by 30 yrs out
Nearby sold comps map
Loading sold comps map…
Walkable amenities ~0.75 mi
Loading nearby amenities…
Taxation est. · year 1
- Rental income
- $17,976
- − Mortgage interest
- −$3,243
- − Property taxes
- −$868
- − Insurance
- −$290
- − Repairs & maintenance
- −$1,438
- − Management
- −$1,438
- − Depreciation
- −$1,684
- Taxable income
- $9,014
- Est. tax owed @ 24.0%
- −$2,163
- After-tax cash flow
- $7,236/yr
For passive investors: Depreciation is non-cash, so a rental often shows a tax loss while cash-flowing — sheltering income. Rental losses are passive: they offset passive income freely, and up to $25,000/yr can offset ordinary (W-2) income if you actively participate and your MAGI is under $100k (phasing out to $0 by $150k); unused losses carry forward. On sale, claimed depreciation is recaptured at up to 25%, and gains may owe capital-gains tax (a 1031 exchange can defer both). Figures are a year-1 estimate at your 24.0% rate — not tax advice; consult a CPA.
Schools (NCES district)
- District
- Casa Grande Union High School District (4453)
- NCES district ID
- 0401740
- Math proficiency
- 14% ▼ -15.00%
- Reading proficiency
- 21% ▼ -10.00%
- Median HH income
- $45,373
- Composite
- 15.38/100
- National rank
- #9319
- State rank
- #193 of 249 in AZ
Livability — Casa Grande
- Score
- 58/100
- State rank
- #220
- US rank
- #21534
Category grades
Schools grade is shown separately in the Schools card above.
Census & demographics
- Census place
- Casa Grande, AZ
- County
- Pinal County · 399,947 people
- City population
- 69,701
- Metro
- Phoenix-Mesa-Chandler, AZ
- Population (ZIP)
- 61,624
- Household income
- $68,443
- Rent vs Own
- Severe rent burden
- 1250.0
Population outlook (Pinal County) Hauer SSP2
- Today (2025)
- 437,574 people
- By 2030
- 446,903 · +2.1%
- By 2040
- 452,589 · +3.4%
- By 2050
- 444,126 · +1.5%
- By 2075
- 430,300 · -1.7%
- By 2100
- 393,536 · -10.1%
Race, ethnicity, and origin ACS 2023
- Neighborhood character
- Diverse neighborhood (Simpson 0.63)
- Race & ethnicity
- Hispanic / Latino 44% White 42% Two or more races 21% Black 4% Native American 4% Asian 1%
- Hispanic origin (detail)
- Mexican 40%
- Common ancestry
- Lithuanian 1% Slovak 1% Portuguese 1%
- Foreign-born
- 12% · Canada
- Languages at home
- 75% English-only · Spanish 23% Tagalog/Filipino 1% Other Indo-European 1%
Political lean MEDSL · Pinal
- 2024 margin
- Strong R (+22.1) · D 38.5% · R 60.6%
- 2008→2024 swing
- -7.6pp toward R · 2008: -14.5pp · 2024: -22.1pp
- All cycles
- 2024: R+22.1 2020: R+17.3 2016: R+19.3 2012: R+17.1 2008: R+14.5
Not yet ingested
- Civics
- —
Market trends
- HPI YoY
- ▼ -67.32%
- Current HPI
- 233.148
- Rent YoY
- ▲ 4.60%
- Metro
- Phoenix-Mesa-Chandler, AZ
- State GDP YoY
- ▲ 4.54%
- F500 in state
- 20
Industry mix (Fortune 500 HQ in AZ)
| Industry | F500 HQs | Revenue |
|---|---|---|
| Technology | 2 | $13B |
|
||
| Mining / Metals | 1 | $23B |
|
||
| Environmental Services | 1 | $16B |
|
||
| Metals / Steel | 1 | $14B |
|
||
| Technology Distribution | 1 | $9B |
|
||
| Homebuilding | 1 | $8B |
|
||
Price history
-22.9% since first listed9 events — show timeline
- 2026-05-09 Price Changed $65,500 ARMLS
- 2026-03-23 Price Changed $68,999 ARMLS
- 2026-03-04 Price Changed $71,999 ARMLS
- 2026-01-29 Price Changed $74,999 ARMLS
- 2025-12-19 Listed $76,999 ARMLS
- 2025-12-16 Listing Removed — ARMLS
- 2025-09-19 Price Changed $76,999 ARMLS
- 2025-07-14 Price Changed $78,999 ARMLS
- 2025-06-26 Listed $84,999 ARMLS
Cash-flow waterfall
monthlySold comps — $/sqft
last 12 mo · ≤1 miLoading sold comps…