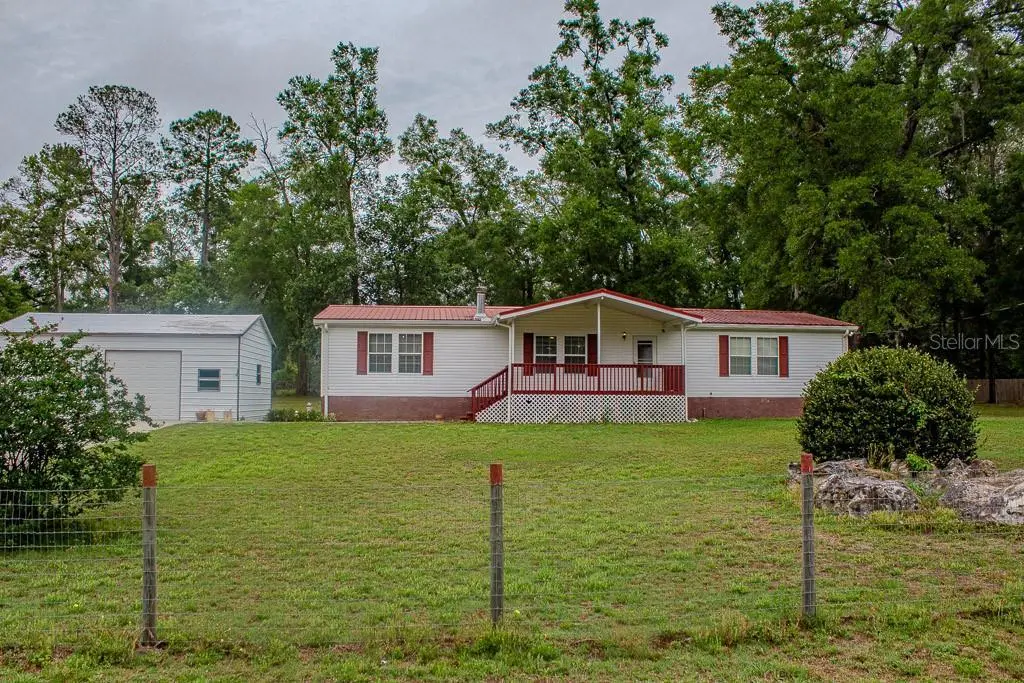
141 SE Maid Marion Ln · High Springs, FL
Flood risk 1/10 · Minimal
- FEMA flood zone
- X (unshaded)
- Chance of flooding over 30 yrs
- 0.0%
- Est. flood insurance / yr
- $507 – $1,088
Fire risk 7/10 · Major
- Est. fire insurance / yr
- $947 – $1,759
Heat risk 8/10 · Major
- Hot days now (above 109°F)
- 7 days/yr
- Hot days in 30 yrs
- 21 days/yr
Wind risk 9/10 · Severe
- Chance of severe wind over 30 yrs
- 99.0%
Air-quality risk 4/10 · Minor
- Unhealthy air days now
- 5 days/yr
- Unhealthy air days in 30 yrs
- 6 days/yr
Risk factors via First Street. Map © Google.
Why this score? — see what drove the D grade
The composite is a weighted blend of 9 inputs, each scored 0–100. Each bar is that input's sub-score; the figure is the points it added to the 100-point composite (weight × sub-score).
- Cash flow +18.8/30.0
- DSCR +5.9/10.0
- Schools +4.5/10.0
- 1% rule +3.9/10.0
- Livability +3.4/5.0
- Rent growth +2.5/5.0
- Condition / age +2.5/5.0
- ARV discount +1.3/15.0
- Appreciation +0.0/10.0
$257,000
🖨 Deal sheet (PDF) 📄 Offer letter ✓ Due diligence
Listing remarks MLS
This immaculate well maintained home is move in ready. Home has many extras such as crown mouldings. Rainsoft water system, Irrigation system, Florida room, new well pump & pipes, metal roof (2015), new water heater (2016), new AC unit (2017), new wood laminate floors in kitchen, dinning, living room and hall way.
Key facts
- Fully fenced
- Quiet community
- 1.03 acre lot
Tags
Property features AI
Finance
- Other: Homestead exempt; Property zoned A-1
- HOA & community: No HOA; Located in the Sherwood Forest development
Exterior
- Parking: 2-car garage
- Utilities: Private well; Septic tank; Electricity connected; Cable connected; Phone available
- Home design: Manufactured home (double wide); One story; Faces south; Entry level: one
- Construction: Vinyl siding; Metal roof; Crawlspace foundation; Built as a completed property
- Exterior features: Covered and enclosed porch; Front porch; Rear porch; Cleared, level lot; Mature landscaping; Public maintained paved road; Workshop on property
Interior
- Kitchen: Dishwasher; Disposal; Range; Refrigerator
- Bedrooms: 3 bedrooms
- Flooring: Carpet; Laminate
- Bathrooms: 2 full bathrooms
- Heating & cooling: Central heating; Central air conditioning
- Interior features: Ceiling fans; Wood-burning fireplace
- Laundry & utility: Dedicated laundry room
Neighborhood map
What this means for you Summary
Snapshot
- This is a 3-bed/2.0-bath manufactured listed at $257k.
Deal economics
- At list price, monthly cash flow is $260 ($3k/yr) — positive.
- The deal already cash-flows at list — no discount required.
- To meet the 1% rule (rent ≥ 1% of price), the offer needs to be $229k (11.1% below list).
- Recommended offer: $229k (11.1% below list) — sets the bar for 1% rule.
- Cap rate 7.5% vs local median 4.0% in High Springs — top-decile yield for the area; either an underpriced asset or a hidden risk that comps aren't pricing in. Stress-test before assuming the spread holds.
Location & tenants
- Location reads 68/100 on livability (#506 in FL) — a middle-class / working-renter tenant base. Strengths: cost of living A+, housing A+, crime B+; Watch: health & safety D, amenities F, commute F.
- Columbia (town): math 53% / reading 54% proficiency, ranked #25 of 73 in FL (top 34%) — acceptable for families but not a draw, mixed tenant base, ~2y average lease.
- Zoned schools: Columbia City Elementary School (math 62% / reading 63%, grade B, #601 of 2,144 statewide, top 28%, 615 students, 62% FRL); Fort White High School (math 45% / reading 48%, grade D-, #216 of 667 statewide, top 33%, 1,158 students, 58% FRL) — zoned schools at 60% FRL track the district average.
- Market conditions: 189 active listings in the ZIP; solid renter incomes; 178 units permitted in Columbia County in 2024 (0 in 5+ unit buildings).
- This rent runs 33% of the median local income ($83k/yr) — at the standard rent-burdened threshold; future hikes will face affordability resistance.
Forward outlook
- Local home prices are declining (-3.0%/yr); year-one equity from $2k of loan paydown is wiped out by about $8k of value loss. Plan a longer hold.
- Columbia County population projected to shrink 7% by 2050 — rents likely to lag national; underwrite the cash flow, not the appreciation.
Negotiation context
- It's been on market 38 days — a 3% lower offer ($249k) is reasonable based on typical stale-listing flexibility.
- 4 sale attempts since 9y ago with the ask held roughly flat each time — persistent listings suggest the price (not the market) is what's stuck; bring a comps-based counter.
- Current owner paid $155k; list at $257k implies a 66% gain — meaningful room to come down on a strong offer.
Risks & watch-outs
- Climate carrying-cost: severe wind risk, 99% chance of damaging wind over 30y; major wildfire risk; extreme-heat days projected 7→21/yr by 2055 (HVAC capex compounding) — expect insurance premiums to compound above CPI over the hold.
Questions for the listing agent
- It's been on market 38 days. Have you received any prior offers? Is the seller open to a 11% concession, seller financing, or rate buy-down credit?
- Is there a deadline driving the sale (1031 exchange, divorce, estate, relocation)? That informs how much negotiation room exists.
- Schools are B-rated — typically a magnet for longer-tenancy family renters. What's the average tenant stay here, and is there a school-zone premium baked into asking?
- The area grade is low — what's the realistic commute time and amenity access for the typical tenant pool here? Any planned neighborhood developments (good or bad) we should know about?
- What's the average days-on-market for RENTAL listings here right now (not sales)? A rising rental-DOM trend means longer vacancies and softer asking-rent achievability than the comps imply.
- What's the recent tenant-quality profile in this submarket — average credit score on applications, eviction rate, late-payment / NSF rate, and stable-employment percentage? A property-management company in the area should have these aggregated.
- How much new for-sale + rental construction is in the pipeline within 1–3 miles? Heavy new supply typically softens prices + rents 12–24 months out; constrained supply supports both.
Investment metrics
- 1% rule
- 0.89% ✗
- Cap rate
- 7.51%
- Cash-on-cash
- 4.34%
- DSCR
- 1.19
- GRM
- 9.4
CMA / ARV
- ARV (on-the-fly)
- $225,720
- Comps found
- 1
Show comp detail 1 sale within ~0.75 mi
| Address | Dist | Beds/Ba | Sqft | Sold | Price | $/sf | Match |
|---|---|---|---|---|---|---|---|
| 20490 S US 441 Hwy | 0.42mi | 3/2.0 | 1,904 (-4%) | 7mo | $217,900 | $114 | 68 |
Match score weights: distance 35% · size 25% · config 20% · recency 20%. Top-matched comps best support the ARV.
Projected returns pro-forma
-3.0% appreciation · 3.0% rent growth · sell at horizon
- IRR
- -9.6%
- Equity multiple
- 0.65×
- Total profit
- $-25,193
- Equity at exit
- $38,320
- IRR
- -0.2%
- Equity multiple
- 0.99×
- Total profit
- $-1,050
- Equity at exit
- $22,221
Cash invested: $71,960 (down + closing). Projections, not guarantees.
Landlord ↔ Tenant lean methodology
- Overall (STATE)
- 87 Strongly Landlord-Friendly
- State Florida
- 87 Strongly Landlord-Friendly · R+3
- County
- — inherits STATE
- City
- — inherits STATE
ZIP-level market 32643
- Home prices YoY
- -5.5%
- Active inventory
- 189
- Price-to-rent
- 9.4×
Monthly cashflow live
- Estimated rent
- $2,286 medium interval (Pro) →
- Mortgage (P&I)
- −$1,348
- Tax from tax record
- −$91 /mo · $1,092/yr
- Insurance
- −$107
- HOA
- −$0
- Vacancy / Maint / Mgmt
- −$480
- Net cashflow
- $260
Break-even live
Sensitivity live
| Price | -10% $405 | -5% $333 | +0% $260 | +5% $187 | +10% $115 |
|---|---|---|---|---|---|
| Rent | -10% $79 | -5% $170 | +0% $260 | +5% $350 | +10% $441 |
| Rate | -1.0pp $389 | -0.5pp $325 | base $260 | +0.5pp $193 | +1.0pp $126 |
UW: 25.0% down · 7.5% · 30yr · 1.5% tax · 5.0% vac · 8.0% maint · 8.0% mgmt
Financing live
Cash to close
- Down payment
- $64,250
- Closing costs
- $7,710
- Reserves months
- —
- Total cash needed
- —
Loan-product check · same deal, 3 products live
Conventional
25% down · 7.5% · 30yr
- Down + closing
- —
- Monthly P&I
- —
- Monthly cashflow
- —
- DSCR
- —
- Eligible?
- —
Personal DTI + credit; lowest rate.
DSCR
20% down · 8.5% · 30yr
- Down + closing
- —
- Monthly P&I
- —
- Monthly cashflow
- —
- DSCR
- —
- Eligible?
- —
No personal income docs; deal must DSCR.
Hard money
10% down · 12.0% · 12mo
- Down + closing
- —
- Monthly P&I
- —
- Monthly cashflow
- —
- DSCR
- —
- Eligible?
- —
Short-term bridge; refi at stabilization.
Listing history 27 events
-
2026-06-19days on market $257,000 Active 38 DOM
-
2026-06-18days on market $257,000 Active 37 DOM
-
2026-06-17days on market $257,000 Active 36 DOM
-
2026-06-16days on market $257,000 Active 35 DOM
-
2026-06-15days on market $257,000 Active 34 DOM
-
2026-06-14days on market $257,000 Active 32 DOM
-
2026-06-12days on market $257,000 Active 31 DOM
-
2026-06-09days on market $257,000 Active 28 DOM
-
2026-06-08days on market $257,000 Active 27 DOM
-
2026-06-07pricedays on market $257,000 Active 26 DOM
-
2026-06-05days on market $259,000 Active 23 DOM
-
2026-06-03days on market $259,000 Active 22 DOM
-
2026-06-02days on market $259,000 Active 21 DOM
-
2026-06-01days on market $259,000 Active 20 DOM
-
2026-05-31days on market $259,000 Active 19 DOM
-
2026-05-30days on market $259,000 Active 18 DOM
-
2026-05-12$259,000 Active
-
2026-05-03status Active
-
2026-04-25status Pending
-
2026-03-29price $255,000
-
2025-12-13price $275,000
-
2025-11-13$298,000 Active
-
2018-03-26soldstatus $154,900
-
2018-03-15soldstatus $154,000 321-char remark
Show marketing remark (321 chars)
This immaculate well maintained home is move in ready. Home has many extras such as crown mouldings. Rainsoft water system, Irrigation system, Florida room, new well pump & pipes, metal roof (2015), new water heater (2016), new AC unit (2017), new wood laminate floors in kitchen, dinning, living room and hall way.
-
2017-12-21$159,900 321-char remark
Show marketing remark (321 chars)
This immaculate well maintained home is move in ready. Home has many extras such as crown mouldings. Rainsoft water system, Irrigation system, Florida room, new well pump & pipes, metal roof (2015), new water heater (2016), new AC unit (2017), new wood laminate floors in kitchen, dinning, living room and hall way.
-
2005-07-15soldstatus $53,000
-
2001-09-12soldstatus $15,000
ⓘ Source: listings_history table (triggers on properties + properties_extension) + one-shot
backfill from property_details.listing_events for pre-trigger history.
Tax reassessment forecast FL · Resets to sale price
- Current annual tax
- $1,092 · $91/mo
- Projected year-2 tax
- $2,133 · $178/mo
- Expected delta
- +$1,042/yr (+$87/mo · 95.4%)
ⓘ Screening estimate from a state-policy table — verify with the county assessor before closing.
Climate risk First Street
- Flood 1/10 Low FEMA zone X (unshaded) · 0% chance over 30 yrs
- Wildfire 7/10 Severe
- Heat 8/10 Severe 7 d/yr ≥109°F today · 21 d/yr by 30 yrs out
- Wind 9/10 Extreme 99% chance of damaging wind over 30 yrs
- Air quality 4/10 Moderate 5 unhealthy d/yr today · 6 by 30 yrs out
Nearby sold comps map
Loading sold comps map…
Walkable amenities ~0.75 mi
Loading nearby amenities…
Taxation est. · year 1
- Rental income
- $27,429
- − Mortgage interest
- −$14,396
- − Property taxes
- −$1,092
- − Insurance
- −$1,285
- − Repairs & maintenance
- −$2,194
- − Management
- −$2,194
- − Depreciation
- −$7,476
- Taxable loss
- −$1,208
- Est. tax savings @ 24.0%
- +$290
- After-tax cash flow
- $3,410/yr
For passive investors: Depreciation is non-cash, so a rental often shows a tax loss while cash-flowing — sheltering income. Rental losses are passive: they offset passive income freely, and up to $25,000/yr can offset ordinary (W-2) income if you actively participate and your MAGI is under $100k (phasing out to $0 by $150k); unused losses carry forward. On sale, claimed depreciation is recaptured at up to 25%, and gains may owe capital-gains tax (a 1031 exchange can defer both). Figures are a year-1 estimate at your 24.0% rate — not tax advice; consult a CPA.
Schools (NCES district)
- District
- Columbia
- NCES district ID
- 1200360
- Math proficiency
- 53% ▼ -10.00%
- Reading proficiency
- 54% ▼ -3.00%
- Median HH income
- $40,053
- Composite
- 44.74/100
- National rank
- #2750
- State rank
- #25 of 73 in FL
Livability — High Springs
- Score
- 68/100
- State rank
- #506
- US rank
- #9346
Category grades
Schools grade is shown separately in the Schools card above.
Census & demographics
- County
- Alachua County · 218,005 people
- City population
- 11,953
- Metro
- Gainesville, FL
- Population (ZIP)
- 11,953
- Household income
- $83,386
- Rent vs Own
- Severe rent burden
- 150.0
Population outlook (Columbia County) Hauer SSP2
- Today (2025)
- 68,129 people
- By 2030
- 67,501 · -0.9%
- By 2040
- 65,465 · -3.9%
- By 2050
- 63,058 · -7.4%
- By 2075
- 56,291 · -17.4%
- By 2100
- 45,243 · -33.6%
Race, ethnicity, and origin ACS 2023
- Neighborhood character
- Predominantly White (77%)
- Race & ethnicity
- White 77% Black 11% Hispanic / Latino 8% Two or more races 5%
- Hispanic origin (detail)
- Mexican 1% Cuban 1%
- Common ancestry
- Slovak 5% Italian 3% Lithuanian 3%
- Foreign-born
- 3% · Canada
- Languages at home
- 94% English-only · Spanish 4% Other Indo-European 1% Other Asian/Pacific 1%
Political lean MEDSL · Columbia
- 2024 margin
- Solid R (+50.2) · D 24.6% · R 74.7%
- 2008→2024 swing
- -16.4pp toward R · 2008: -33.8pp · 2024: -50.2pp
- All cycles
- 2024: R+50.2 2020: R+45.2 2016: R+44.5 2012: R+36.7 2008: R+33.8
Not yet ingested
- Civics
- —
Market trends
- HPI YoY
- ▼ -18.02%
- Current HPI
- 308.0178
- Rent YoY
- —
- Metro
- Gainesville, FL
- State GDP YoY
- ▲ 3.28%
- F500 in state
- 36
Industry mix (Fortune 500 HQ in FL)
| Industry | F500 HQs | Revenue |
|---|---|---|
| Industrial Technology | 2 | $29B |
|
||
| Insurance | 2 | $17B |
|
||
| Retail | 1 | $60B |
|
||
| Technology Distribution | 1 | $58B |
|
||
| Homebuilding | 1 | $35B |
|
||
| Technology Manufacturing | 1 | $35B |
|
||
Price history
+1626.7% since first listed11 events — show timeline
- 2026-05-12 Listed $259,000 Stellar MLS as Distributed by MLS Grid
- 2026-05-03 Relisted — Stellar MLS as Distributed by MLS Grid
- 2026-04-25 Pending — Stellar MLS as Distributed by MLS Grid
- 2026-03-29 Price Changed $255,000 Stellar MLS as Distributed by MLS Grid
- 2025-12-13 Price Changed $275,000 Stellar MLS as Distributed by MLS Grid
- 2025-11-13 Listed $298,000 Stellar MLS as Distributed by MLS Grid
- 2018-03-26 Sold (Public Records) $154,900 Public Records
- 2018-03-15 Sold (MLS) $154,000 Stellar MLS as Distributed by MLS Grid
- 2017-12-21 Listed $159,900 Stellar MLS as Distributed by MLS Grid
- 2005-07-15 Sold (Public Records) $53,000 Public Records
- 2001-09-12 Sold (Public Records) $15,000 Public Records
Property tax history
-0.3%/yrLatest (2025): $1,092 · +1.1% YoY. Source: county tax records.
Cash-flow waterfall
monthlySold comps — $/sqft
last 12 mo · ≤1 miLoading sold comps…