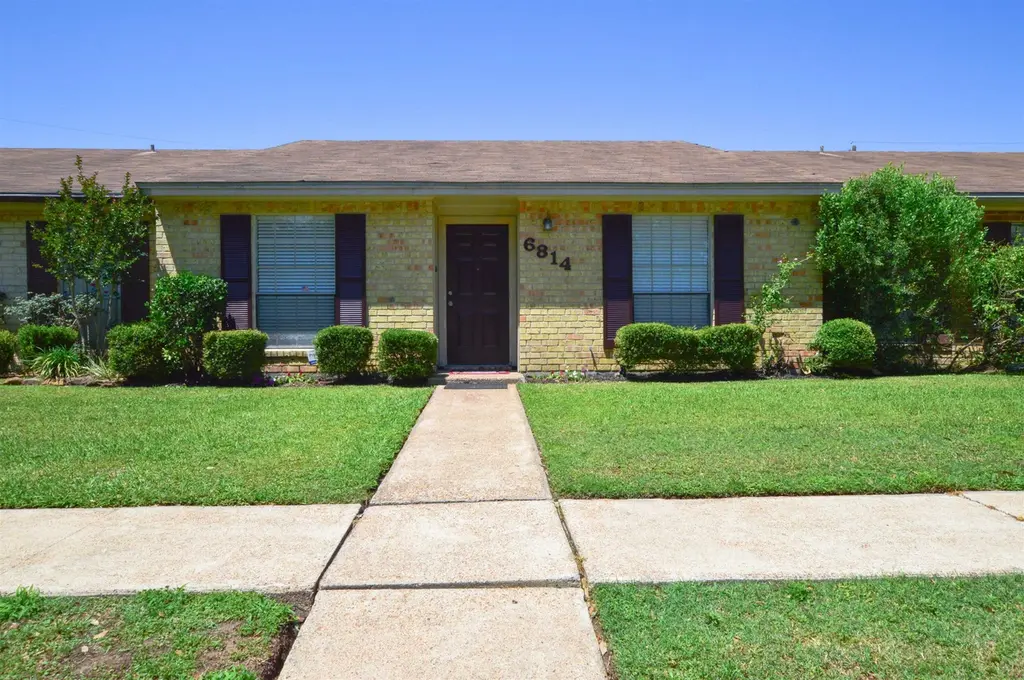
6814 Marshall Place Dr · Beaumont, TX
Flood risk 8/10 · Major
- FEMA flood zone
- X
- Chance of flooding over 30 yrs
- 0.99%
- Est. flood insurance / yr
- $507 – $1,088
Fire risk 1/10 · Minimal
- Est. fire insurance / yr
- $1,222 – $2,270
Heat risk 9/10 · Severe
- Hot days now (above 110°F)
- 7 days/yr
- Hot days in 30 yrs
- 24 days/yr
Wind risk 9/10 · Severe
- Chance of severe wind over 30 yrs
- 99.0%
Air-quality risk 2/10 · Minimal
- Unhealthy air days now
- 1 days/yr
- Unhealthy air days in 30 yrs
- 1 days/yr
Risk factors via First Street. Map © Google.
Why this score? — see what drove the C grade
The composite is a weighted blend of 9 inputs, each scored 0–100. Each bar is that input's sub-score; the figure is the points it added to the 100-point composite (weight × sub-score).
- Cash flow +22.2/30.0
- ARV discount +14.2/15.0
- DSCR +7.1/10.0
- 1% rule +6.2/10.0
- Livability +3.2/5.0
- Rent growth +2.7/5.0
- Condition / age +2.5/5.0
- Schools +1.5/10.0
- Appreciation +0.0/10.0
$154,900
🖨 Deal sheet 📄 Offer letter ✓ Due diligence
Listing remarks
Welcome home to this beautifully updated one-story condo featuring 2 bedrooms and 2 bathrooms in a convenient, desirable location. Freshly improved with new flooring in the bedrooms and living room, this home offers a clean, modern feel throughout. The kitchen shines with quartz countertops, while both bathrooms have been refreshed with new vanities for a stylish updated look. Each bedroom includes a walk-in closet, providing excellent storage and added comfort. Enjoy the ease of single-level living in a condo that’s close to shopping, parks, and everyday conveniences. This move-in ready home combines comfort, updates, and an ideal location all in one.
Key facts
- Quartz countertops
- Walk-in closet
- New flooring
Tags
Property features AI
Finance
- HOA & community: Homeowners association present; Subdivision: Marshall Twnhs
Exterior
- Parking: Attached 2-car garage
- Home design: Residential condo/townhouse
Interior
- Kitchen: Dishwasher, Refrigerator, Range
- Bathrooms: 2 full bathrooms
- Interior features: Dishwasher, Refrigerator, Range; Central air conditioning; Electric central heating
Neighborhood map
What this means for you Summary
Snapshot
- This is a 2-bed/2.0-bath condo listed at $155k.
Deal economics
- At list price, monthly cash flow is $187 ($2k/yr) — positive.
- The deal already cash-flows at list — no discount required.
- Meets the 1% rule at list price ($2k rent vs $155k).
- Recommended offer: $150k (3.0% below list) — sets the bar for market timing.
- Cap rate 8.3% vs local median 5.3% in Beaumont — top-decile yield for the area; either an underpriced asset or a hidden risk that comps aren't pricing in. Stress-test before assuming the spread holds.
Location & tenants
- Location reads 64/100 on livability (#739 in TX) — a middle-class / working-renter tenant base. Strengths: cost of living A+, housing A+, health & safety A+; Watch: employment D, schools D-, crime F.
- Beaumont ISD (urban): math 14% / reading 22% proficiency, ranked #789 of 826 in TX (top 96%) — low school quality limits family demand, transient renter base, plan for 1-2y turnover; 69% free/reduced lunch — lower-income household profile, screen leases tightly.
- Market conditions: Rents flat; 258 active listings in the ZIP; 29 comparable units currently listed for rent nearby; rentals at typical pace (median 24d on market — plan ~3-4 weeks tenant-placement turnaround); 45% of comp listings sitting > 30 days — soft ceiling on asking rent; 343 units permitted in Jefferson County in 2024 (0 in 5+ unit buildings).
Forward outlook
- Local home prices are declining (-3.0%/yr); year-one equity from $1k of loan paydown is wiped out by about $5k of value loss. Plan a longer hold.
Negotiation context
- It's been on market 44 days — a 3% lower offer ($150k) is reasonable based on typical stale-listing flexibility.
- 2 sale attempts with the ask held roughly flat each time — persistent listings suggest the price (not the market) is what's stuck; bring a comps-based counter.
Risks & watch-outs
- Watch-outs: flood insurance adds $66/mo.
- Climate carrying-cost: severe flood risk; severe wind risk, 99% chance of damaging wind over 30y; extreme-heat days projected 7→24/yr by 2055 (HVAC capex compounding) — expect insurance premiums to compound above CPI over the hold.
Questions for the listing agent
- It's been on market 44 days. Have you received any prior offers? Is the seller open to a 3% concession, seller financing, or rate buy-down credit?
- Built in 1978 — when were the roof, HVAC, electrical panel, plumbing, and water heater last replaced?
- What's the actual annual flood-insurance premium (NFIP or private), and is the property in a SFHA with mandatory coverage?
- Any open or pending special assessments — roof, HVAC, plumbing, elevator, façade? What's the per-unit balance and payoff schedule, and is the seller paying it off at close or rolling it to the buyer?
- Is there a deadline driving the sale (1031 exchange, divorce, estate, relocation)? That informs how much negotiation room exists.
- Schools are D-rated, which usually means shorter tenancies and higher turnover. Who's the typical renter profile here, and what's been the actual vacancy rate?
- Crime grade is F in this area — have there been break-ins, vandalism, or insurance claims at this property in the last 3 years? What carrier currently insures it and at what premium?
- What's the average days-on-market for RENTAL listings here right now (not sales)? A rising rental-DOM trend means longer vacancies and softer asking-rent achievability than the comps imply.
- What's the recent tenant-quality profile in this submarket — average credit score on applications, eviction rate, late-payment / NSF rate, and stable-employment percentage? A property-management company in the area should have these aggregated.
- How much new apartment / multifamily construction is in the pipeline within 1–3 miles? Heavy new supply (>2% of stock underway) typically softens rents 12–24 months out; light construction supports rent growth.
Investment metrics
- 1% rule
- 1.12% ✓
- Cap rate
- 8.26%
- Cash-on-cash
- 7.01%
- DSCR
- 1.31
- GRM
- 7.5
CMA / ARV
- ARV (median comp)
- $181,803
- List price
- $154,900
- Delta
- -14.80%
- Verdict
- UNDERPRICED
- Comps
- 11 within 1.0 mi
Projected returns pro-forma
-3.0% appreciation · 0.66% rent growth · sell at horizon
- IRR
- -11.1%
- Equity multiple
- 0.61×
- Total profit
- $-17,071
- Equity at exit
- $23,096
- IRR
- -5.9%
- Equity multiple
- 0.66×
- Total profit
- $-14,722
- Equity at exit
- $13,393
Cash invested: $43,372 (down + closing). Projections, not guarantees.
Landlord ↔ Tenant lean methodology
- Overall (STATE)
- 87 Strongly Landlord-Friendly
- State Texas
- 87 Strongly Landlord-Friendly · R+5
- County
- — inherits STATE
- City
- — inherits STATE
ZIP-level market 77706
- Rents YoY
- 0.7%
- Active inventory
- 258
- Price-to-rent
- 7.5×
Monthly cashflow live
- Estimated rent
- $1,729 high interval (Pro) →
- Mortgage (P&I)
- −$812
- Tax from tax record
- −$235 /mo · $2,824/yr
- Insurance
- −$65
- Flood insurance flood zone
- −$66 /mo · $798/yr
- HOA
- −$0
- Vacancy / Maint / Mgmt
- −$363
- Net cashflow
- $187
Break-even live
UW: 25.0% down · 7.5% · 30yr · 1.5% tax · 5.0% vac · 8.0% maint · 8.0% mgmt
Financing live
Cash to close
- Down payment
- $38,725
- Closing costs
- $4,647
- Reserves months
- —
- Total cash needed
- —
Loan-product check · same deal, 3 products live
Conventional
25% down · 7.5% · 30yr
- Down + closing
- —
- Monthly P&I
- —
- Monthly cashflow
- —
- DSCR
- —
- Eligible?
- —
Personal DTI + credit; lowest rate.
DSCR
20% down · 8.5% · 30yr
- Down + closing
- —
- Monthly P&I
- —
- Monthly cashflow
- —
- DSCR
- —
- Eligible?
- —
No personal income docs; deal must DSCR.
Hard money
10% down · 12.0% · 12mo
- Down + closing
- —
- Monthly P&I
- —
- Monthly cashflow
- —
- DSCR
- —
- Eligible?
- —
Short-term bridge; refi at stabilization.
Rent comps 29 comps
| Address | Beds | Baths | Sqft | Rent | $/sqft | DOM | Units | Dist |
|---|---|---|---|---|---|---|---|---|
| 6795 Greenwood Dr Beaumont, TX | 3.0 | 2.0 | 1650 | $2,500 | $1.52 | 23d | 1 | 0.16mi |
| 1915 Sams Way Beaumont, TX | 3.0 | 2.0 | 1696 | $2,100 | $1.24 | 23d | 1 | 0.51mi |
| 1532 Bryant Way Beaumont, TX | 3.0 | 2.0 | 1628 | $1,750 | $1.07 | 14d | 1 | 0.57mi |
| 880 Lockwood Dr Beaumont, TX | 3.0 | 2.0 | 1819 | $1,995 | $1.10 | 44d | 1 | 0.58mi |
| 1620 Wellington Pl #903 Beaumont, TX | 2.0 | 2.5 | 1215 | $1,750 | $1.44 | 44d | 1 | 0.69mi |
| 1212 N Major Dr Beaumont, TX | 2.0 | 1.5 | 1232 | $1,250 | $1.01 | 14d | 1 | 0.70mi |
| 8256 Heartfield Ln Beaumont, TX | 2.0 | 2.0 | 1638 | $1,450 | $0.89 | 44d | 1 | 0.70mi |
| 1450 N Major Dr Beaumont, TX | 1.0–2.0 | 1.0–2.0 | 849 | $1,188 | $1.40 | 14d | 17 | 0.71mi |
| 1212 N Major Dr Unit 4820 Beaumont, TX | 3.0 | 2.5 | 1692 | $1,646 | $0.97 | 23d | 1 | 0.72mi |
| 1456 N Major Dr Beaumont, TX | 2.0 | 2.0 | 1008 | $1,079 | $1.07 | 44d | 1 | 0.75mi |
| 6250 Ivanhoe Ln Beaumont, TX | 1.0–2.0 | 1.0–2.0 | 885 | $1,604 | $1.81 | 14d | 9 | 0.84mi |
| 1605 Cornerstone Ct Beaumont, TX | 1.0–2.0 | 1.0–2.0 | 818 | $1,108 | $1.35 | 14d | 17 | 0.87mi |
| 520 Dowlen Rd Beaumont, TX | 1.0–2.0 | 1.0–2.0 | 940 | $1,050 | $1.12 | 14d | 10 | 0.89mi |
| 770 Peyton Dr Beaumont, TX | 3.0 | 2.0 | 1769 | $1,895 | $1.07 | 44d | 1 | 0.94mi |
| 6561 Lexington Dr Beaumont, TX | 2.0 | 2.0 | 1321 | $1,011 | $0.77 | 44d | 1 | 0.94mi |
| 7996 Blue Bonnet Ln Beaumont, TX | 3.0 | 2.0 | 1635 | $2,300 | $1.41 | 14d | 1 | 1.00mi |
| 6860 Prutzman Rd Unit 18 Beaumont, TX | 2.0 | 1.0 | 884 | $1,100 | $1.24 | 44d | 1 | 1.03mi |
| 976 Sunmeadow Dr Unit 05/04/26 Beaumont, TX | 3.0 | 2.5 | 1656 | $2,150 | $1.30 | 44d | 1 | 1.05mi |
| 976 Sunmeadow Dr Beaumont, TX | 3.0 | 2.5 | 1656 | $1,995 | $1.20 | 14d | 1 | 1.05mi |
| 9252 Glen Meadow Ln Beaumont, TX | 2.0 | 1.0 | 929 | $1,250 | $1.35 | 44d | 1 | 1.09mi |
| 458 Belvedere Dr Beaumont, TX | 3.0 | 2.0 | 1465 | $1,595 | $1.09 | 21d | 1 | 1.10mi |
| 8960 Manion Dr Beaumont, TX | 2.0 | 2.5 | 1358 | $1,550 | $1.14 | 44d | 1 | 1.17mi |
| 1069 Green Meadow St Beaumont, TX | 2.0 | 2.0 | 1556 | $1,795 | $1.15 | 44d | 1 | 1.17mi |
| 434 Harbor Oaks Dr Beaumont, TX | 3.0 | 2.0 | 1844 | $2,500 | $1.36 | 23d | 1 | 1.29mi |
| 405 Harbor Oaks Dr Beaumont, TX | 3.0 | 2.5 | 1828 | $2,600 | $1.42 | 23d | 1 | 1.32mi |
| 379 Pinchback Rd Beaumont, TX | 2.0 | 1.5 | 1254 | $1,175 | $0.94 | 44d | 1 | 1.35mi |
| 345 Marceline Blvd Beaumont, TX | 2.0 | 1.5 | 1200 | $2,250 | $1.88 | 23d | 1 | 1.41mi |
| 345 Marceline Blvd Beaumont, TX | 2.0 | 1.5 | 1200 | $1,850 | $1.54 | 21d | 1 | 1.41mi |
| 3620 Grayson Ln Beaumont, TX | 3.0 | 2.0 | 1850 | $2,390 | $1.29 | 44d | 1 | 1.48mi |
HOA detail condo
- Monthly dues
- $0 · $0/yr
- Assessments
- None detected in remarks — confirm with the listing agent.
Listing history 19 events
-
2026-06-18days on market $154,900 Active 44 DOM
-
2026-06-17days on market $154,900 Active 43 DOM
-
2026-06-16days on market $154,900 Active 42 DOM
-
2026-06-15days on market $154,900 Active 41 DOM
-
2026-06-14days on market $154,900 Active 39 DOM
-
2026-06-13days on market $154,900 Active 38 DOM
-
2026-06-10days on market $154,900 Active 36 DOM
-
2026-06-09days on market $154,900 Active 35 DOM
-
2026-06-08days on market $154,900 Active 34 DOM
-
2026-06-07days on market $154,900 Active 33 DOM
-
2026-06-03statusdays on market $154,900 Active 29 DOM
-
2026-06-02days on market $154,900 Active Under Contract 28 DOM
-
2026-06-01days on market $154,900 Active Under Contract 27 DOM
-
2026-05-31days on market $154,900 Active Under Contract 26 DOM
-
2026-05-30days on market $154,900 Active Under Contract 25 DOM
-
2026-05-14historical Active Under Contract 666-char remark
-
2026-05-06$154,900 Active 666-char remark
-
2007-11-15soldstatus
-
2006-05-03soldstatus
ⓘ Source: listings_history table (triggers on properties + properties_extension) + one-shot
backfill from property_details.listing_events for pre-trigger history.
Tax reassessment forecast TX · Resets to sale price
- Current annual tax
- $2,824 · $235/mo
- Projected year-2 tax
- $2,835 · $236/mo
- Expected delta
- +$10/yr (+$1/mo · 0.4%)
ⓘ Screening estimate from a state-policy table — verify with the county assessor before closing.
Climate risk First Street
- Flood 8/10 Severe FEMA zone X · 99% chance over 30 yrs
- Wildfire 1/10 Low
- Heat 9/10 Extreme 7 d/yr ≥110°F today · 24 d/yr by 30 yrs out
- Wind 9/10 Extreme 99% chance of damaging wind over 30 yrs
- Air quality 2/10 Low 1 unhealthy d/yr today · 1 by 30 yrs out
Nearby sold comps map
Loading sold comps map…
Walkable amenities ~0.75 mi
Loading nearby amenities…
Taxation est. · year 1
- Rental income
- $20,745
- − Mortgage interest
- −$8,677
- − Property taxes
- −$2,824
- − Insurance
- −$1,572
- − Repairs & maintenance
- −$1,660
- − Management
- −$1,660
- − Depreciation
- −$4,506
- Taxable loss
- −$153
- Est. tax savings @ 24.0%
- +$37
- After-tax cash flow
- $2,282/yr
For passive investors: Depreciation is non-cash, so a rental often shows a tax loss while cash-flowing — sheltering income. Rental losses are passive: they offset passive income freely, and up to $25,000/yr can offset ordinary (W-2) income if you actively participate and your MAGI is under $100k (phasing out to $0 by $150k); unused losses carry forward. On sale, claimed depreciation is recaptured at up to 25%, and gains may owe capital-gains tax (a 1031 exchange can defer both). Figures are a year-1 estimate at your 24.0% rate — not tax advice; consult a CPA.
Schools (NCES district)
- District
- Beaumont ISD
- NCES district ID
- 4809670
- Math proficiency
- 14% ▼ -13.00%
- Reading proficiency
- 22% ▼ -7.00%
- Median HH income
- $41,683
- Composite
- 15.43/100
- National rank
- #9316
- State rank
- #789 of 826 in TX
Livability — Beaumont
- Score
- 64/100
- State rank
- #739
- US rank
- #13710
Category grades
Schools grade is shown separately in the Schools card above.
Census & demographics
- Census place
- Beaumont, TX
- County
- Jefferson County · 203,592 people
- City population
- 125,901
- Metro
- Beaumont-Port Arthur, TX
- Population (ZIP)
- 30,393
- Household income
- $73,185
- Rent vs Own
- Severe rent burden
- 1299.0
Population outlook (Jefferson County) Hauer SSP2
- Today (2025)
- 259,015 people
- By 2030
- 260,685 · +0.6%
- By 2040
- 263,309 · +1.7%
- By 2050
- 265,237 · +2.4%
- By 2075
- 270,193 · +4.3%
- By 2100
- 255,628 · -1.3%
Race, ethnicity, and origin ACS 2023
- Neighborhood character
- Diverse neighborhood (Simpson 0.61)
- Race & ethnicity
- White 56% Black 24% Hispanic / Latino 13% Two or more races 9% Asian 4%
- Hispanic origin (detail)
- Mexican 10%
- Common ancestry
- Lithuanian 4% Iranian 3% Slovak 2%
- Foreign-born
- 8% · Canada, China
- Languages at home
- 87% English-only · Spanish 8% Other Indo-European 2% German/W. Germanic 1%
Political lean MEDSL · Jefferson
- 2024 margin
- Lean R (+8.9) · D 45.1% · R 54.0%
- 2008→2024 swing
- -11.1pp toward R · 2008: 2.2pp · 2024: -8.9pp
- All cycles
- 2024: R+8.9 2020: R+1.6 2016: R+0.5 2012: D+1.6 2008: D+2.2
Not yet ingested
- Civics
- —
Market trends
- HPI YoY
- ▼ -180.53%
- Current HPI
- 159.4053
- Rent YoY
- ▲ 0.66%
- Metro
- Beaumont-Port Arthur, TX
- State GDP YoY
- ▲ 3.95%
- F500 in state
- 110
Industry mix (Fortune 500 HQ in TX)
| Industry | F500 HQs | Revenue |
|---|---|---|
| Energy | 16 | $1,198B |
|
||
| Technology | 5 | $198B |
|
||
| Engineering / Construction | 4 | $72B |
|
||
| Energy Services | 3 | $60B |
|
||
| Utilities | 3 | $41B |
|
||
| Healthcare | 2 | $330B |
|
||
Price history
5 events — show timeline
- 2026-06-03 Relisted — BBOR
- 2026-05-14 Contingent — BBOR
- 2026-05-06 Listed $154,900 BBOR
- 2007-11-15 Sold (Public Records) — Public Records
- 2006-05-03 Sold (Public Records) — Public Records
Property tax history
+1.0%/yrLatest (2025): $2,824 · +1.4% YoY. Source: county tax records.
Cash-flow waterfall
monthlySold comps — $/sqft
last 12 mo · ≤1 miLoading sold comps…