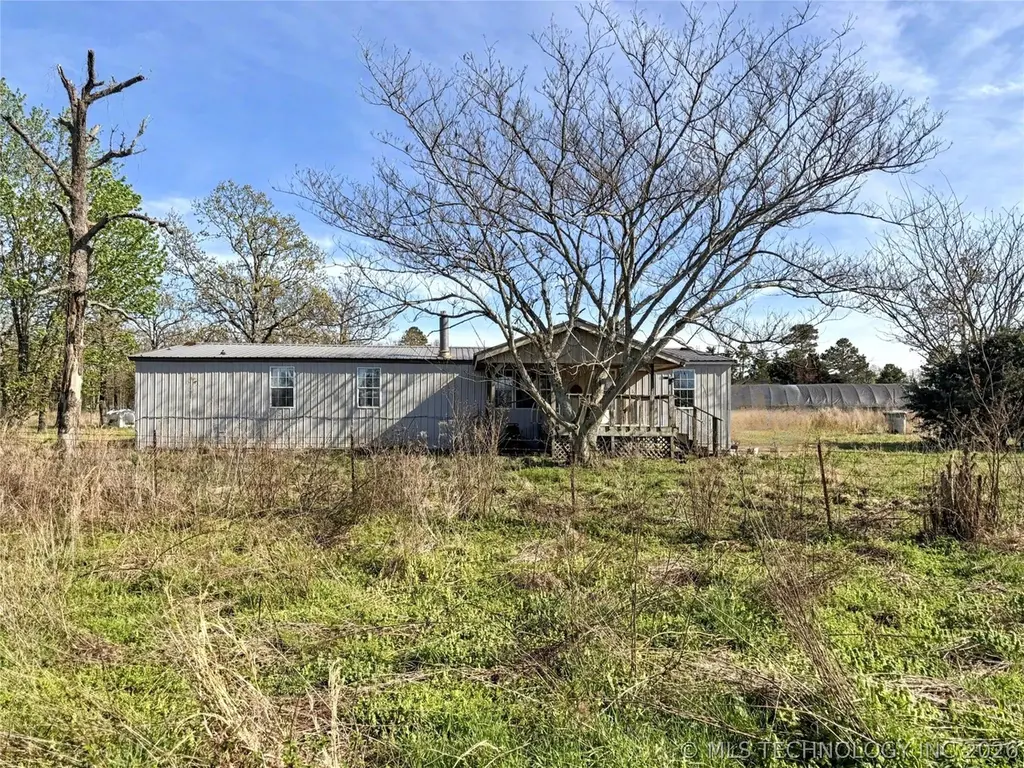
16115 E 615 Rd · Teresita, OK
Flood risk 1/10 · Minimal
- FEMA flood zone
- X (unshaded)
- Chance of flooding over 30 yrs
- 0.0%
- Est. flood insurance / yr
- $507 – $1,088
Fire risk 9/10 · Severe
- Est. fire insurance / yr
- $2,463 – $4,575
Heat risk 5/10 · Moderate
- Hot days now (above 109°F)
- 7 days/yr
- Hot days in 30 yrs
- 19 days/yr
Wind risk 2/10 · Minimal
- Chance of severe wind over 30 yrs
- 3.0%
Air-quality risk 2/10 · Minimal
- Unhealthy air days now
- 1 days/yr
- Unhealthy air days in 30 yrs
- 2 days/yr
Risk factors via First Street. Map © Google.
Why this score? — see what drove the D grade
The composite is a weighted blend of 9 inputs, each scored 0–100. Each bar is that input's sub-score; the figure is the points it added to the 100-point composite (weight × sub-score).
- Cash flow +10.8/30.0
- Appreciation +9.2/10.0
- ARV discount +7.5/15.0
- DSCR +3.1/10.0
- Livability +3.0/5.0
- Rent growth +2.5/5.0
- Condition / age +2.5/5.0
- 1% rule +1.9/10.0
- Schools +1.6/10.0
$179,500
🖨 Deal sheet (PDF) 📄 Offer letter ✓ Due diligence
Listing remarks MLS
HUD Case# 422-290826. All properties are sold AS IS without any guarantee or warranty by seller. BUYERS TO VERIFY ALL INFO. FOR UTILITY TURN ONS, APPROVAL MUST BE GRANTED IN ADVANCE FROM HUD’S FIELD SERVICE MANAGER.
Key facts
- Metal roof
- Full metal siding
- Fenced usable land
Tags
Property features AI
Exterior
- Security: Storm shelter
- Utilities: Electricity available; Natural gas available; Well water; Septic tank
- Home design: Manufactured double-wide home; Single-story; Faces southwest; Tie-down foundation
- Construction: Manufactured construction; Metal roof
- Exterior features: Covered porch; Dirt driveway; Dog run; Greenhouse; Shed(s); Full, cross fencing; Farm/ranch setting
Interior
- Flooring: Carpet; Laminate
- Bathrooms: 2 full bathrooms
- Heating & cooling: Central heating (electric); Central air conditioning
- Interior features: Ceiling fan(s); Laminate counters; Vinyl windows
- Laundry & utility: Electric water heater
Neighborhood map
What this means for you Summary
Snapshot
- This is a 3-bed/2.0-bath manufactured listed at $180k.
Deal economics
- At list price, monthly cash flow is $-81 ($-977/yr) — negative.
- To cash-flow at today's rent, offer at most $165k (8.0% below list).
- To meet the 1% rule (rent ≥ 1% of price), the offer needs to be $124k (30.9% below list).
- Recommended offer: $124k (30.9% below list) — sets the bar for 1% rule.
Location & tenants
- Location reads 59/100 on livability (#368 in OK) — a working-class tenant base; expect higher turnover. Strengths: cost of living A+, housing A+; Watch: crime D-, amenities F, commute F.
- Oaks-Mission (rural): math 10% / reading 20% proficiency, ranked #476 of 513 in OK (top 93%) — low school quality limits family demand, transient renter base, plan for 1-2y turnover; 68% free/reduced lunch — lower-income household profile, screen leases tightly.
- Zoned schools: Oaks-Mission Es (math 2% / reading 2%, grade F, #802 of 845 statewide, top 100%, 79 students, 0% FRL); Oaks-Mission Hs (math 10% / reading 10%, grade F, #361 of 447 statewide, top 94%, 81 students, 0% FRL) — zoned schools average 0% FRL vs 68% district-wide (68 pts lower); this property's tenant base skews higher-income than the district average.
- Market conditions: 10 active listings in the ZIP; 48 units permitted in Cherokee County in 2024 (0 in 5+ unit buildings).
Forward outlook
- In year one you build about $16k of equity ($1k loan paydown + $15k appreciation (8.3% local appreciation)).
- Cherokee County population projected at +15% by 2050 — modest demand growth; plan on rents tracking national, not racing it.
- At projected returns (8.3% appreciation + 3.0% rent growth), your $50k cash investment doubles in ~3 years — after that, you're playing with house money.
- By year 3, paydown + projected appreciation supports a ~$40k cash-out refi (75% LTV) — recoverable capital for the next deal without selling this one.
Negotiation context
- It's been on market 73 days — a 6% lower offer ($169k) is reasonable based on typical stale-listing flexibility.
- 3 sale attempts since 10y ago; this cycle's ask has dropped $17k (9%) from the opening price — seller is motivated, your offer sets the floor, not the list.
- Current owner paid $64k; list at $180k implies a 179% gain — meaningful room to come down on a strong offer.
Risks & watch-outs
- Climate carrying-cost: severe wildfire risk; extreme-heat days projected 7→19/yr by 2055 (HVAC capex compounding) — expect insurance premiums to compound above CPI over the hold.
Questions for the listing agent
- What do current leases actually rent for vs. the listed asking? Can we see a recent rent roll and the last 12 months of T-12 income?
- It's been on market 73 days. Have you received any prior offers? Is the seller open to a 31% concession, seller financing, or rate buy-down credit?
- Why hasn't it sold? Are there any deal-killer items the seller is aware of (foundation, flood, title, zoning, code violations)?
- Is there a deadline driving the sale (1031 exchange, divorce, estate, relocation)? That informs how much negotiation room exists.
- Schools are D-rated, which usually means shorter tenancies and higher turnover. Who's the typical renter profile here, and what's been the actual vacancy rate?
- Crime grade is D in this area — have there been break-ins, vandalism, or insurance claims at this property in the last 3 years? What carrier currently insures it and at what premium?
- The area grade is low — what's the realistic commute time and amenity access for the typical tenant pool here? Any planned neighborhood developments (good or bad) we should know about?
- What's the average days-on-market for RENTAL listings here right now (not sales)? A rising rental-DOM trend means longer vacancies and softer asking-rent achievability than the comps imply.
- What's the recent tenant-quality profile in this submarket — average credit score on applications, eviction rate, late-payment / NSF rate, and stable-employment percentage? A property-management company in the area should have these aggregated.
- How much new for-sale + rental construction is in the pipeline within 1–3 miles? Heavy new supply typically softens prices + rents 12–24 months out; constrained supply supports both.
Investment metrics
- 1% rule
- 0.69% ✗
- Cap rate
- 5.75%
- Cash-on-cash
- -1.94%
- DSCR
- 0.91
- GRM
- 12.1
CMA / ARV
No comps found within radius.
Projected returns pro-forma
8.3% appreciation · 3.0% rent growth · sell at horizon
- IRR
- 19.2%
- Equity multiple
- 2.44×
- Total profit
- $72,153
- Equity at exit
- $140,078
- IRR
- 17.9%
- Equity multiple
- 5.24×
- Total profit
- $213,207
- Equity at exit
- $281,664
Cash invested: $50,260 (down + closing). Projections, not guarantees.
Landlord ↔ Tenant lean methodology
- Overall (STATE)
- 83 Strongly Landlord-Friendly
- State Oklahoma
- 83 Strongly Landlord-Friendly · R+20
- County
- — inherits STATE
- City
- — inherits STATE
ZIP-level market 74364
- Home prices YoY
- 2.8%
- Active inventory
- 10
- Price-to-rent
- 12.1×
Monthly cashflow live
- Estimated rent
- $1,241 medium interval (Pro) →
- Mortgage (P&I)
- −$941
- Tax from tax record
- −$45 /mo · $545/yr
- Insurance
- −$75
- HOA
- −$0
- Vacancy / Maint / Mgmt
- −$261
- Net cashflow
- $-81
Break-even live
Sensitivity live
| Price | -10% $20 | -5% $-31 | +0% $-81 | +5% $-132 | +10% $-183 |
|---|---|---|---|---|---|
| Rent | -10% $-179 | -5% $-130 | +0% $-81 | +5% $-32 | +10% $17 |
| Rate | -1.0pp $9 | -0.5pp $-36 | base $-81 | +0.5pp $-128 | +1.0pp $-175 |
UW: 25.0% down · 7.5% · 30yr · 1.5% tax · 5.0% vac · 8.0% maint · 8.0% mgmt
Financing live
Cash to close
- Down payment
- $44,875
- Closing costs
- $5,385
- Reserves months
- —
- Total cash needed
- —
Loan-product check · same deal, 3 products live
Conventional
25% down · 7.5% · 30yr
- Down + closing
- —
- Monthly P&I
- —
- Monthly cashflow
- —
- DSCR
- —
- Eligible?
- —
Personal DTI + credit; lowest rate.
DSCR
20% down · 8.5% · 30yr
- Down + closing
- —
- Monthly P&I
- —
- Monthly cashflow
- —
- DSCR
- —
- Eligible?
- —
No personal income docs; deal must DSCR.
Hard money
10% down · 12.0% · 12mo
- Down + closing
- —
- Monthly P&I
- —
- Monthly cashflow
- —
- DSCR
- —
- Eligible?
- —
Short-term bridge; refi at stabilization.
Listing history 25 events
-
2026-06-18status $179,500 Pending 73 DOM
-
2026-06-18days on market $179,500 Active 73 DOM
-
2026-06-17days on market $179,500 Active 72 DOM
-
2026-06-16days on market $179,500 Active 71 DOM
-
2026-06-15days on market $179,500 Active 70 DOM
-
2026-06-14days on market $179,500 Active 68 DOM
-
2026-06-12days on market $179,500 Active 67 DOM
-
2026-06-09days on market $179,500 Active 64 DOM
-
2026-06-08days on market $179,500 Active 63 DOM
-
2026-06-07days on market $179,500 Active 62 DOM
-
2026-06-05days on market $179,500 Active 59 DOM
-
2026-06-03days on market $179,500 Active 58 DOM
-
2026-06-02days on market $179,500 Active 57 DOM
-
2026-06-01days on market $179,500 Active 56 DOM
-
2026-05-31days on market $179,500 Active 55 DOM
-
2026-05-30days on market $179,500 Active 54 DOM
-
2026-05-07price $179,500
-
2026-04-06$196,500 Active
-
2019-03-11historical
-
2019-02-15soldstatus $64,395 Closed 221-char remark
Show marketing remark (221 chars)
HUD Case# 422-290826. All properties are sold AS IS without any guarantee or warranty by seller. BUYERS TO VERIFY ALL INFO. FOR UTILITY TURN ONS, APPROVAL MUST BE GRANTED IN ADVANCE FROM HUD’S FIELD SERVICE MANAGER.
-
2018-12-12status Pending 221-char remark
Show marketing remark (221 chars)
HUD Case# 422-290826. All properties are sold AS IS without any guarantee or warranty by seller. BUYERS TO VERIFY ALL INFO. FOR UTILITY TURN ONS, APPROVAL MUST BE GRANTED IN ADVANCE FROM HUD’S FIELD SERVICE MANAGER.
-
2018-12-05price $67,300 221-char remark
Show marketing remark (221 chars)
HUD Case# 422-290826. All properties are sold AS IS without any guarantee or warranty by seller. BUYERS TO VERIFY ALL INFO. FOR UTILITY TURN ONS, APPROVAL MUST BE GRANTED IN ADVANCE FROM HUD’S FIELD SERVICE MANAGER.
-
2018-10-22$76,500 Active 221-char remark
Show marketing remark (221 chars)
HUD Case# 422-290826. All properties are sold AS IS without any guarantee or warranty by seller. BUYERS TO VERIFY ALL INFO. FOR UTILITY TURN ONS, APPROVAL MUST BE GRANTED IN ADVANCE FROM HUD’S FIELD SERVICE MANAGER.
-
2016-09-21$88,625 Active
-
2001-10-12soldstatus $14,000
ⓘ Source: listings_history table (triggers on properties + properties_extension) + one-shot
backfill from property_details.listing_events for pre-trigger history.
Tax reassessment forecast OK · Resets to sale price
- Current annual tax
- $545 · $45/mo
- Projected year-2 tax
- $1,615 · $135/mo
- Expected delta
- +$1,070/yr (+$89/mo · 196.4%)
ⓘ Screening estimate from a state-policy table — verify with the county assessor before closing.
Climate risk First Street
- Flood 1/10 Low FEMA zone X (unshaded) · 0% chance over 30 yrs
- Wildfire 9/10 Extreme
- Heat 5/10 Major 7 d/yr ≥109°F today · 19 d/yr by 30 yrs out
- Wind 2/10 Low 3% chance of damaging wind over 30 yrs
- Air quality 2/10 Low 1 unhealthy d/yr today · 2 by 30 yrs out
Nearby sold comps map
Loading sold comps map…
Walkable amenities ~0.75 mi
Loading nearby amenities…
Taxation est. · year 1
- Rental income
- $14,888
- − Mortgage interest
- −$10,055
- − Property taxes
- −$545
- − Insurance
- −$898
- − Repairs & maintenance
- −$1,191
- − Management
- −$1,191
- − Depreciation
- −$5,222
- Taxable loss
- −$4,213
- Est. tax savings @ 24.0%
- +$1,011
- After-tax cash flow
- $34/yr
For passive investors: Depreciation is non-cash, so a rental often shows a tax loss while cash-flowing — sheltering income. Rental losses are passive: they offset passive income freely, and up to $25,000/yr can offset ordinary (W-2) income if you actively participate and your MAGI is under $100k (phasing out to $0 by $150k); unused losses carry forward. On sale, claimed depreciation is recaptured at up to 25%, and gains may owe capital-gains tax (a 1031 exchange can defer both). Figures are a year-1 estimate at your 24.0% rate — not tax advice; consult a CPA.
Schools (NCES district)
- District
- Oaks-Mission
- NCES district ID
- 4022410
- Math proficiency
- 10% ▬ 0.00%
- Reading proficiency
- 20% ▲ 5.00%
- Median HH income
- $36,795
- Composite
- 15.94/100
- National rank
- #14312
- State rank
- #476 of 513 in OK
Livability — Teresita
- Score
- 59/100
- State rank
- #368
- US rank
- #19683
Category grades
Schools grade is shown separately in the Schools card above.
Census & demographics
- Census place
- Teresita, OK
- Population (ZIP)
- 1,716
Population outlook (Cherokee County) Hauer SSP2
- Today (2025)
- 51,747 people
- By 2030
- 53,481 · +3.4%
- By 2040
- 56,503 · +9.2%
- By 2050
- 59,370 · +14.7%
- By 2075
- 67,178 · +29.8%
- By 2100
- 70,900 · +37.0%
Race, ethnicity, and origin ACS 2023
- Neighborhood character
- Highly diverse neighborhood (Simpson 0.73)
- Race & ethnicity
- White 51% Native American 31% Two or more races 13% Asian 2% Hispanic / Latino 2%
- Common ancestry
- Italian 2% Serbian 1% Slovak 1%
- Foreign-born
- 2% · China
- Languages at home
- 93% English-only · Spanish 2% Other Asian/Pacific 1%
Political lean MEDSL · Cherokee
- 2024 margin
- Solid R (+32.6) · D 32.7% · R 65.3% · Other 2.0%
- 2008→2024 swing
- -20.4pp toward R · 2008: -12.2pp · 2024: -32.6pp
- All cycles
- 2024: R+32.6 2020: R+29.3 2016: R+27.5 2012: R+14.1 2008: R+12.2
Not yet ingested
- Civics
- —
Market trends
- HPI YoY
- ▲ 8.30%
- Current HPI
- 304.7963
- Rent YoY
- —
- Metro
- —
- State GDP YoY
- ▲ 1.55%
- F500 in state
- 6
Industry mix (Fortune 500 HQ in OK)
| Industry | F500 HQs | Revenue |
|---|---|---|
| Energy | 3 | $48B |
|
||
Price history
+1182.1% since first listed9 events — show timeline
- 2026-05-07 Price Changed $179,500 MLS Technology, Inc.
- 2026-04-06 Listed $196,500 MLS Technology, Inc.
- 2019-03-11 Listing Removed — MLSOK
- 2019-02-15 Sold (MLS) $64,395 MLS Technology, Inc.
- 2018-12-12 Pending — MLS Technology, Inc.
- 2018-12-05 Price Changed $67,300 MLS Technology, Inc.
- 2018-10-22 Listed $76,500 MLS Technology, Inc.
- 2016-09-21 Listed $88,625 MLSOK
- 2001-10-12 Sold (Public Records) $14,000 Public Records
Property tax history
+0.1%/yrLatest (2025): $545 · +5.0% YoY. Source: county tax records.
Cash-flow waterfall
monthlySold comps — $/sqft
last 12 mo · ≤1 miLoading sold comps…