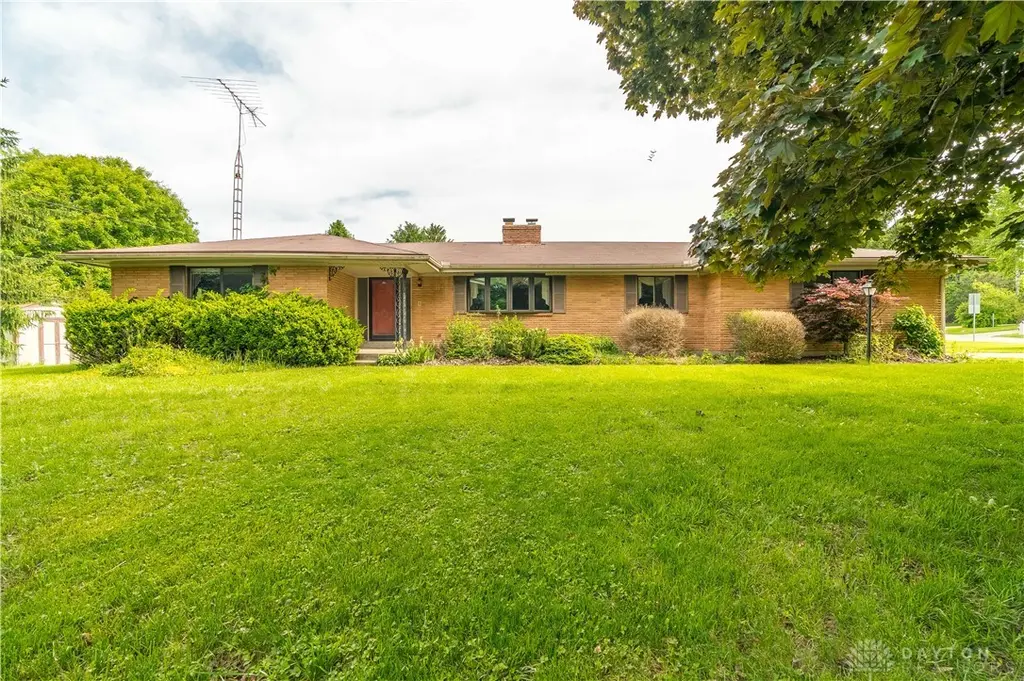
2830 Joy Dr · Beavercreek, OH
Flood risk 1/10 · Minimal
- FEMA flood zone
- X (unshaded)
- Chance of flooding over 30 yrs
- 0.0%
- Est. flood insurance / yr
- $507 – $1,088
Fire risk 3/10 · Minor
- Est. fire insurance / yr
- $713 – $1,323
Heat risk 4/10 · Minor
- Hot days now (above 102°F)
- 7 days/yr
- Hot days in 30 yrs
- 18 days/yr
Wind risk 2/10 · Minimal
- Chance of severe wind over 30 yrs
- 1.0%
Air-quality risk 3/10 · Minor
- Unhealthy air days now
- 3 days/yr
- Unhealthy air days in 30 yrs
- 4 days/yr
Risk factors via First Street. Map © Google.
Why this score? — see what drove the D grade
The composite is a weighted blend of 9 inputs, each scored 0–100. Each bar is that input's sub-score; the figure is the points it added to the 100-point composite (weight × sub-score).
- ARV discount +15.0/15.0
- Cash flow +6.9/30.0
- Schools +6.6/10.0
- Livability +4.4/5.0
- 1% rule +2.7/10.0
- Rent growth +2.5/5.0
- Condition / age +2.5/5.0
- DSCR +1.1/10.0
- Appreciation +0.0/10.0
$279,500
🖨 Deal sheet 📄 Offer letter ✓ Due diligence
Listing remarks
Discover the timeless appeal of this charming ranch-style residence, nestled in a lush green setting on a generous half acre lot. This property provides ample outdoor living space, complemented by mature trees and a verdant lawn. Nestled on a culdesac, this classic brick home offers comfort and enduring elegance, welcoming you with an inviting front entrance and an expansive front yard. Step inside to a welcoming foyer adorned with natural light and durable tile flooring. The expansive living area features a cozy brick double-sided fireplace and large windows that bathe the space in abundant natural light, including a charming bay window. Convenient sliding glass doors in the living room of
Key facts
- Verdant lawn
- Brick home
- Half acre lot
Tags
Property features AI
Finance
- Financial info: Property is offered for sale
Exterior
- Parking: Attached two-car garage
- Utilities: Well water; Water available; Cable available
- Home design: Single-story home; Brick construction
- Construction: Brick exterior
- Exterior features: Patio; Storage; Shed(s)
Interior
- Kitchen: Range
- Bathrooms: Two full bathrooms; One half bathroom; Three bathrooms located on the main level
- Heating & cooling: Natural gas heating; Central air conditioning
- Interior features: Crawl space basement; Multi-sided wood-burning fireplace
- Laundry & utility: Washer; Dryer; Gas water heater
Neighborhood map
What this means for you Summary
Snapshot
- This is a 3-bed/2.0-bath single-family listed at $280k.
Deal economics
- At list price, monthly cash flow is $-422 ($-5k/yr) — negative.
- To cash-flow at today's rent, offer at most $205k (26.7% below list).
- To meet the 1% rule (rent ≥ 1% of price), the offer needs to be $215k (23.0% below list).
- Recommended offer: $205k (26.7% below list) — sets the bar for cash-flow.
- Cap rate 4.5% vs local median 3.3% in Beavercreek — top-decile yield for the area; either an underpriced asset or a hidden risk that comps aren't pricing in. Stress-test before assuming the spread holds.
Location & tenants
- Location reads 88/100 on livability (#26 in OH, #239 nationally) — a professional / high-income tenant draw. Strengths: schools A+, employment A+, cost of living A+; Watch: commute F.
- Beavercreek City (suburban): math 70% / reading 78% proficiency, ranked #79 of 656 in OH (top 12%) — strong family-tenant draw, lease renewals of 3-5y typical; only 10% free/reduced lunch — higher-income household profile.
- Market conditions: 96 active listings in the ZIP; 3 comparable units currently listed for rent nearby; rentals leasing fast (median 4d on market — plan ~1-2 weeks tenant-placement turnaround); high-income renter base; 797 units permitted in Greene County in 2024 (148 in 5+ unit buildings).
Forward outlook
- Local home prices are declining (-3.0%/yr); year-one equity from $2k of loan paydown is wiped out by about $8k of value loss. Plan a longer hold.
Negotiation context
- Only 5 days on market — expect competitive offers; lowballing is unlikely to land.
Questions for the listing agent
- What do current leases actually rent for vs. the listed asking? Can we see a recent rent roll and the last 12 months of T-12 income?
- Built in 1964 — when were the roof, HVAC, electrical panel, plumbing, and water heater last replaced?
- Is there a deadline driving the sale (1031 exchange, divorce, estate, relocation)? That informs how much negotiation room exists.
- Schools are A-rated — typically a magnet for longer-tenancy family renters. What's the average tenant stay here, and is there a school-zone premium baked into asking?
- The area grade is low — what's the realistic commute time and amenity access for the typical tenant pool here? Any planned neighborhood developments (good or bad) we should know about?
- What's the average days-on-market for RENTAL listings here right now (not sales)? A rising rental-DOM trend means longer vacancies and softer asking-rent achievability than the comps imply.
- What's the recent tenant-quality profile in this submarket — average credit score on applications, eviction rate, late-payment / NSF rate, and stable-employment percentage? A property-management company in the area should have these aggregated.
- How much new for-sale + rental construction is in the pipeline within 1–3 miles? Heavy new supply typically softens prices + rents 12–24 months out; constrained supply supports both.
Investment metrics
- 1% rule
- 0.77% ✗
- Cap rate
- 4.48%
- Cash-on-cash
- -6.48%
- DSCR
- 0.71
- GRM
- 10.8
CMA / ARV
- ARV (median comp)
- $348,628
- List price
- $279,500
- Delta
- -19.83%
- Verdict
- UNDERPRICED
- Comps
- 20 within 1.0 mi
Show comp detail 12 sales within ~0.75 mi
| Address | Dist | Beds/Ba | Sqft | Sold | Price | $/sf | Match |
|---|---|---|---|---|---|---|---|
| 2830 Joy Dr | 0.00mi | 4/2.5 (+1) | 2,179 (0%) | 1mo | $276,000 | $127 | 92 |
| 1326 Lemcke Rd | 0.46mi | 3/2.0 | 2,187 (+0%) | 3mo | $300,000 | $137 | 75 |
| 1412 Devoe Dr | 0.67mi | 3/2.5 | 2,156 (-1%) | 2mo | $351,800 | $163 | 64 |
| 1176 Geneva Rd | 0.39mi | 3/2.0 | 1,910 (-12%) | 1mo | $295,000 | $154 | 60 |
| 1359 Fudge Dr | 0.53mi | 4/2.5 (+1) | 2,282 (+5%) | 3mo | $335,000 | $147 | 58 |
| 1155 Forest Dr | 0.70mi | 3/2.0 | 2,268 (+4%) | 7mo | $355,000 | $157 | 54 |
| 1367 Howell Rd | 0.59mi | 3/2.5 | 2,342 (+8%) | 6mo | $314,900 | $134 | 53 |
| 2705 Blue Rock Dr | 0.48mi | 4/2.5 (+1) | 1,946 (-11%) | 4mo | $365,000 | $188 | 50 |
| 1276 Meadow Bridge Dr | 0.69mi | 3/2.0 | 1,920 (-12%) | 2mo | $325,000 | $169 | 47 |
| 2853 Oriole Dr | 0.46mi | 4/2.5 (+1) | 2,448 (+12%) | 8mo | $343,000 | $140 | 44 |
| 3050 Viola Dr | 0.70mi | 4/3.0 (+1) | 2,015 (-8%) | 6mo | $390,000 | $194 | 41 |
| 1210 Lomeda Ln | 0.68mi | 4/2.5 (+1) | 1,950 (-10%) | 8mo | $344,900 | $177 | 37 |
Match score weights: distance 35% · size 25% · config 20% · recency 20%. Top-matched comps best support the ARV.
Projected returns pro-forma
-3.0% appreciation · 3.0% rent growth · sell at horizon
- IRR
- -27.4%
- Equity multiple
- 0.08×
- Total profit
- $-72,036
- Equity at exit
- $41,674
- IRR
- -25.3%
- Equity multiple
- -0.24×
- Total profit
- $-96,750
- Equity at exit
- $24,166
Cash invested: $78,260 (down + closing). Projections, not guarantees.
Landlord ↔ Tenant lean methodology
- Overall (STATE)
- 73 Landlord-Friendly
- State Ohio
- 73 Landlord-Friendly · R+6
- County
- — inherits STATE
- City
- — inherits STATE
ZIP-level market 45434
- Home prices YoY
- -19.6%
- Active inventory
- 96
- Price-to-rent
- 10.8×
Monthly cashflow live
- Estimated rent
- $2,153 medium interval (Pro) →
- Mortgage (P&I)
- −$1,466
- Tax from tax record
- −$541 /mo · $6,494/yr
- Insurance
- −$116
- HOA
- −$0
- Vacancy / Maint / Mgmt
- −$452
- Net cashflow
- $-422
Break-even live
UW: 25.0% down · 7.5% · 30yr · 1.5% tax · 5.0% vac · 8.0% maint · 8.0% mgmt
Financing live
Cash to close
- Down payment
- $69,875
- Closing costs
- $8,385
- Reserves months
- —
- Total cash needed
- —
Loan-product check · same deal, 3 products live
Conventional
25% down · 7.5% · 30yr
- Down + closing
- —
- Monthly P&I
- —
- Monthly cashflow
- —
- DSCR
- —
- Eligible?
- —
Personal DTI + credit; lowest rate.
DSCR
20% down · 8.5% · 30yr
- Down + closing
- —
- Monthly P&I
- —
- Monthly cashflow
- —
- DSCR
- —
- Eligible?
- —
No personal income docs; deal must DSCR.
Hard money
10% down · 12.0% · 12mo
- Down + closing
- —
- Monthly P&I
- —
- Monthly cashflow
- —
- DSCR
- —
- Eligible?
- —
Short-term bridge; refi at stabilization.
Rent comps 3 comps
| Address | Beds | Baths | Sqft | Rent | $/sqft | DOM | Units | Dist |
|---|---|---|---|---|---|---|---|---|
| 3103 Glenshaw Dr Beavercreek, OH | 4.0 | 2.5 | 1832 | $2,200 | $1.20 | 2d | 1 | 1.09mi |
| 1605 N Fairfield Rd Unit Na Dayton, OH | 3.0 | 3.5 | 1600 | $1,950 | $1.22 | 44d | 1 | 1.40mi |
| 3033 Stardust Dr Beavercreek, OH | 3.0 | 2.0 | 1620 | $2,295 | $1.42 | 3d | 1 | 1.49mi |
Listing history 2 events
-
2026-05-15$279,500 Active 1866-char remark
-
1973-12-31soldstatus $40,000
ⓘ Source: listings_history table (triggers on properties + properties_extension) + one-shot
backfill from property_details.listing_events for pre-trigger history.
Tax reassessment forecast OH · Partial reset (capped growth)
- Current annual tax
- $6,494 · $541/mo
- Projected year-2 tax
- $6,494 · $541/mo
- Expected delta
- $0/yr ($0/mo · 0.0%)
ⓘ Screening estimate from a state-policy table — verify with the county assessor before closing.
Climate risk First Street
- Flood 1/10 Low FEMA zone X (unshaded) · 0% chance over 30 yrs
- Wildfire 3/10 Moderate
- Heat 4/10 Moderate 7 d/yr ≥102°F today · 18 d/yr by 30 yrs out
- Wind 2/10 Low 100% chance of damaging wind over 30 yrs
- Air quality 3/10 Moderate 3 unhealthy d/yr today · 4 by 30 yrs out
Nearby sold comps map
Loading sold comps map…
Walkable amenities ~0.75 mi
Loading nearby amenities…
Taxation est. · year 1
- Rental income
- $25,839
- − Mortgage interest
- −$15,656
- − Property taxes
- −$6,494
- − Insurance
- −$1,398
- − Repairs & maintenance
- −$2,067
- − Management
- −$2,067
- − Depreciation
- −$8,131
- Taxable loss
- −$9,974
- Est. tax savings @ 24.0%
- +$2,394
- After-tax cash flow
- $-2,674/yr
For passive investors: Depreciation is non-cash, so a rental often shows a tax loss while cash-flowing — sheltering income. Rental losses are passive: they offset passive income freely, and up to $25,000/yr can offset ordinary (W-2) income if you actively participate and your MAGI is under $100k (phasing out to $0 by $150k); unused losses carry forward. On sale, claimed depreciation is recaptured at up to 25%, and gains may owe capital-gains tax (a 1031 exchange can defer both). Figures are a year-1 estimate at your 24.0% rate — not tax advice; consult a CPA.
Schools (NCES district)
- District
- Beavercreek City
- NCES district ID
- 3904724
- Math proficiency
- 70% ▼ -9.00%
- Reading proficiency
- 78% ▼ -1.00%
- Median HH income
- $80,251
- Composite
- 65.55/100
- National rank
- #469
- State rank
- #79 of 656 in OH
Livability — Beavercreek
- Score
- 88/100
- State rank
- #26
- US rank
- #239
Category grades
Schools grade is shown separately in the Schools card above.
Census & demographics
- Census place
- Beavercreek, OH
- County
- Greene · 199,376 people
- City population
- 27,951
- Metro
- Dayton-Kettering-Beavercreek, OH
- Population (ZIP)
- 12,482
- Household income
- $142,260
- Rent vs Own
- Severe rent burden
- 3.9
Population outlook (Greene County) Hauer SSP2
- Today (2025)
- 170,301 people
- By 2030
- 171,840 · +0.9%
- By 2040
- 171,408 · +0.7%
- By 2050
- 167,806 · -1.5%
- By 2075
- 154,430 · -9.3%
- By 2100
- 138,669 · -18.6%
Race, ethnicity, and origin ACS 2023
- Neighborhood character
- Predominantly White (86%)
- Race & ethnicity
- White 86% Hispanic / Latino 5% Black 4% Two or more races 3% Asian 3%
- Hispanic origin (detail)
- Mexican 3%
- Common ancestry
- Romanian 6% Italian 4% Slovak 3%
- Foreign-born
- 5% · Canada
- Languages at home
- 93% English-only · Spanish 3% Other Indo-European 2% German/W. Germanic 1%
Political lean MEDSL · Greene
- 2024 margin
- R (+19.8) · D 39.5% · R 59.3% · Other 1.2%
- 2008→2024 swing
- -1.4pp toward R · 2008: -18.4pp · 2024: -19.8pp
- All cycles
- 2024: R+19.8 2020: R+19.5 2016: R+24.5 2012: R+21.8 2008: R+18.4
Not yet ingested
- Civics
- —
Market trends
- HPI YoY
- ▼ -57.77%
- Current HPI
- 237.5864
- Rent YoY
- —
- Metro
- —
- State GDP YoY
- ▲ 1.98%
- F500 in state
- 48
Industry mix (Fortune 500 HQ in OH)
| Industry | F500 HQs | Revenue |
|---|---|---|
| Insurance | 3 | $145B |
|
||
| Industrial Machinery | 3 | $49B |
|
||
| Financial Services | 3 | $24B |
|
||
| Consumer Goods | 2 | $93B |
|
||
| Aerospace / Defense | 2 | $47B |
|
||
| Utilities | 2 | $33B |
|
||
Price history
+590.0% since first listed4 events — show timeline
- 2026-06-01 Sold (MLS) $276,000 Dayton MLS
- 2026-05-20 Pending — Dayton MLS
- 2026-05-15 Listed $279,500 Dayton MLS
- 1973-12-31 Sold (Public Records) $40,000 Public Records
Property tax history
+6.5%/yrLatest (2025): $6,494 · +0.9% YoY. Source: county tax records.
Cash-flow waterfall
monthlySold comps — $/sqft
last 12 mo · ≤1 miLoading sold comps…