200 Patio Dr · Columbia, SC
Flood risk 1/10 · Minimal
- FEMA flood zone
- X (unshaded)
- Chance of flooding over 30 yrs
- 0.0%
- Est. flood insurance / yr
- $507 – $1,088
Fire risk 4/10 · Minor
- Est. fire insurance / yr
- $783 – $1,453
Heat risk 7/10 · Major
- Hot days now (above 108°F)
- 7 days/yr
- Hot days in 30 yrs
- 16 days/yr
Wind risk 6/10 · Moderate
- Chance of severe wind over 30 yrs
- 60.0%
Air-quality risk 3/10 · Minor
- Unhealthy air days now
- 2 days/yr
- Unhealthy air days in 30 yrs
- 3 days/yr
Risk factors via First Street. Map © Google.
Why this score? — see what drove the D+ grade
The composite is a weighted blend of 9 inputs, each scored 0–100. Each bar is that input's sub-score; the figure is the points it added to the 100-point composite (weight × sub-score).
- Cash flow +15.4/30.0
- ARV discount +7.5/15.0
- Appreciation +5.0/10.0
- DSCR +4.7/10.0
- Schools +4.5/10.0
- Livability +3.9/5.0
- 1% rule +3.3/10.0
- Rent growth +2.5/5.0
- Condition / age +2.5/5.0
$242,500
🖨 Deal sheet 📄 Offer letter ✓ Due diligence
Listing remarks
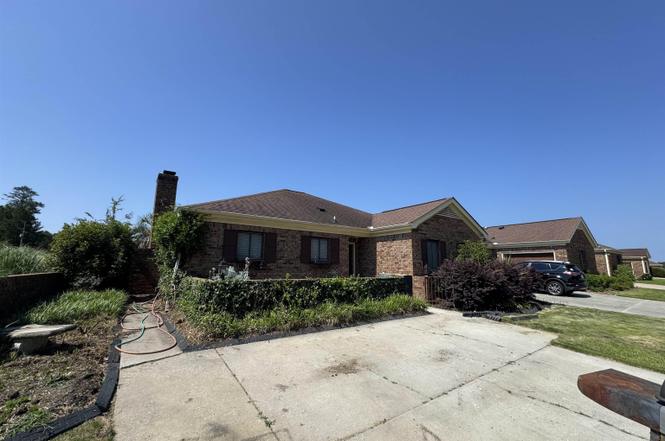
Nestled at the end of the street adjacent to a community common area, this all-brick home enjoys a private setting with no through traffic. Offering approximately 1,700 square feet, this is one of the larger two-bedroom, two-bath floor plans in the neighborhood. The home features a welcoming brick front patio, side-entry access to the backyard, and an open-concept layout created during a previous renovation. The updated kitchen showcases custom cabinetry, quartz countertops, tile backsplash, stainless steel appliances, and overlooks the main living areas, providing a seamless flow from the front entry to the backyard and pool area. The spacious owner's suite includes an oversized closet and
Key facts
- Brick front patio
- Custom cabinetry
- Quartz countertops
Tags
Property features AI
Finance
- Other: Sidewalks in the community
- HOA & community: Homeowners association with fees covering common area maintenance
Exterior
- Parking: 2 parking spaces
- Utilities: Public water; Public sewer
- Home design: Single-story home; Brick exterior on all sides above foundation
- Construction: Slab foundation
- Exterior features: Patio; Shed; Partial gutters; Inground pool; Rear brick fencing
Interior
- Kitchen: Eat-in kitchen with bar; Tile floor and tiled backsplash; Painted cabinets; Quartz countertops; Dishwasher; Free-standing range
- Bedrooms: Master bedroom on main level with garden tub, private bath, separate shower, walk-in closet, ceiling fan, and tile floors; Second bedroom on main level with shared bath, tub/shower, private closet, and tile floors
- Flooring: Tile floors in primary living areas and bedrooms
- Bathrooms: Two full bathrooms
- Heating & cooling: Heat pump (serving first level); Electric heating
- Interior features: Ceiling fan(s); Attic with pull-down access; Fireplace; Florida room; Formal dining area; Great room with tile floors
- Laundry & utility: Laundry closet on main level
Neighborhood map
What this means for you Summary
Snapshot
- This is a 2-bed/2.0-bath townhouse listed at $242k.
Deal economics
- At list price, monthly cash flow is $95 ($1k/yr) — positive.
- The deal already cash-flows at list — no discount required.
- To meet the 1% rule (rent ≥ 1% of price), the offer needs to be $201k (17.0% below list).
- Recommended offer: $201k (17.0% below list) — sets the bar for 1% rule.
- Cap rate 6.8% vs local median 5.0% in Columbia — top-decile yield for the area; either an underpriced asset or a hidden risk that comps aren't pricing in. Stress-test before assuming the spread holds.
Location & tenants
- Location reads 78/100 on livability (#18 in SC, #2,436 nationally) — a middle-class / working-renter tenant base. Strengths: amenities A+, commute A+, cost of living A+; Watch: employment D, crime F.
- Lexington 05 (suburban): math 47% / reading 55% proficiency, ranked #5 of 80 in SC (top 6%) — acceptable for families but not a draw, mixed tenant base, ~2y average lease.
- Zoned schools: Dutch Fork Elementary (math 32% / reading 37%, grade F, #344 of 597 statewide, top 60%, 475 students, 82% FRL); Dutch Fork High (math 54% / reading 86%, grade B+, #58 of 196 statewide, top 30%, 1,726 students, 52% FRL) — zoned schools average 67% FRL vs 27% district-wide (40 pts higher); higher-poverty schools than district average — tighter screening recommended.
- Market conditions: 1 active listings in the ZIP; 39 comparable units currently listed for rent nearby; rentals leasing fast (median 3d on market — plan ~1-2 weeks tenant-placement turnaround); 3,472 units permitted in Richland County in 2024 (1,096 in 5+ unit buildings).
Forward outlook
- In year one you build about $9k of equity ($2k loan paydown + $7k appreciation (3.0% local appreciation)).
- Richland County population projected at +30% by 2050 — long-run rental-demand tailwind backs the buy-and-hold thesis.
- At projected returns (3.0% appreciation + 3.0% rent growth), your $68k cash investment doubles in ~6 years — after that, you're playing with house money.
- By year 4, paydown + projected appreciation supports a ~$30k cash-out refi (75% LTV) — recoverable capital for the next deal without selling this one.
Negotiation context
- Only 2 days on market — expect competitive offers; lowballing is unlikely to land.
- Current owner paid $140k; list at $242k implies a 73% gain — meaningful room to come down on a strong offer.
Risks & watch-outs
- Climate carrying-cost: major wind risk, 60% chance of damaging wind over 30y; extreme-heat days projected 7→16/yr by 2055 (HVAC capex compounding) — expect insurance premiums to compound above CPI over the hold.
Questions for the listing agent
- Is there a deadline driving the sale (1031 exchange, divorce, estate, relocation)? That informs how much negotiation room exists.
- Schools are D-rated, which usually means shorter tenancies and higher turnover. Who's the typical renter profile here, and what's been the actual vacancy rate?
- Crime grade is F in this area — have there been break-ins, vandalism, or insurance claims at this property in the last 3 years? What carrier currently insures it and at what premium?
- The area grade is low — what's the realistic commute time and amenity access for the typical tenant pool here? Any planned neighborhood developments (good or bad) we should know about?
- What's the average days-on-market for RENTAL listings here right now (not sales)? A rising rental-DOM trend means longer vacancies and softer asking-rent achievability than the comps imply.
- What's the recent tenant-quality profile in this submarket — average credit score on applications, eviction rate, late-payment / NSF rate, and stable-employment percentage? A property-management company in the area should have these aggregated.
- How much new for-sale + rental construction is in the pipeline within 1–3 miles? Heavy new supply typically softens prices + rents 12–24 months out; constrained supply supports both.
Investment metrics
- 1% rule
- 0.83% ✗
- Cap rate
- 6.76%
- Cash-on-cash
- 1.68%
- DSCR
- 1.07
- GRM
- 10.0
CMA / ARV
No comps found within radius.
Projected returns pro-forma
3.0% appreciation · 3.0% rent growth · sell at horizon
- IRR
- 9.0%
- Equity multiple
- 1.52×
- Total profit
- $35,195
- Equity at exit
- $109,039
- IRR
- 11.5%
- Equity multiple
- 2.72×
- Total profit
- $116,719
- Equity at exit
- $168,041
Cash invested: $67,900 (down + closing). Projections, not guarantees.
Landlord ↔ Tenant lean methodology
- Overall (STATE)
- 90 Strongly Landlord-Friendly
- State South Carolina
- 90 Strongly Landlord-Friendly · R+6
- County
- — inherits STATE
- City
- — inherits STATE
ZIP-level market 29212-2485
- Active inventory
- 1
- Price-to-rent
- 10.0×
Monthly cashflow live
- Estimated rent
- $2,012 high interval (Pro) →
- Mortgage (P&I)
- −$1,272
- Tax from tax record
- −$122 /mo · $1,462/yr
- Insurance
- −$101
- HOA
- −$0
- Vacancy / Maint / Mgmt
- −$423
- Net cashflow
- $95
Break-even live
UW: 25.0% down · 7.5% · 30yr · 1.5% tax · 5.0% vac · 8.0% maint · 8.0% mgmt
Financing live
Cash to close
- Down payment
- $60,625
- Closing costs
- $7,275
- Reserves months
- —
- Total cash needed
- —
Loan-product check · same deal, 3 products live
Conventional
25% down · 7.5% · 30yr
- Down + closing
- —
- Monthly P&I
- —
- Monthly cashflow
- —
- DSCR
- —
- Eligible?
- —
Personal DTI + credit; lowest rate.
DSCR
20% down · 8.5% · 30yr
- Down + closing
- —
- Monthly P&I
- —
- Monthly cashflow
- —
- DSCR
- —
- Eligible?
- —
No personal income docs; deal must DSCR.
Hard money
10% down · 12.0% · 12mo
- Down + closing
- —
- Monthly P&I
- —
- Monthly cashflow
- —
- DSCR
- —
- Eligible?
- —
Short-term bridge; refi at stabilization.
Rent comps 39 comps
| Address | Beds | Baths | Sqft | Rent | $/sqft | DOM | Units | Dist |
|---|---|---|---|---|---|---|---|---|
| 316 Stamport Cir Irmo, SC | 3.0 | 2.5 | 1500 | $1,575 | $1.05 | 3d | 1 | 1.02mi |
| 101 Riverwalk Way Irmo, SC | 3.0 | 2.0 | 1300 | $1,750 | $1.35 | 14d | 1 | 1.10mi |
| 174 Winding Chestnut Dr Columbia, SC | 3.0 | 2.5 | 1335 | $1,875 | $1.40 | 23d | 1 | 1.24mi |
| 6 Forestgrove Ct Columbia, SC | 3.0 | 2.0 | 1066 | $1,599 | $1.50 | 21d | 1 | 1.29mi |
| 167 Pond Oak Ln Columbia, SC | 3.0 | 2.0 | 2105 | $2,200 | $1.05 | 23d | 1 | 1.30mi |
| 356 Lake Murray Blvd Irmo, SC | 1.0–3.0 | 1.0–2.0 | 1020 | $2,058 | $2.02 | 3d | 23 | 1.32mi |
| 185 Winding Chestnut Dr Columbia, SC | 3.0 | 2.5 | 1335 | $1,975 | $1.48 | 23d | 1 | 1.37mi |
| 193 Winding Chestnut Dr Columbia, SC | 3.0 | 2.5 | 1335 | $1,975 | $1.48 | 23d | 1 | 1.38mi |
| 200 Winding Chestnut Dr Columbia, SC | 3.0 | 2.5 | 1335 | $1,975 | $1.48 | 23d | 1 | 1.39mi |
| 197 Winding Chestnut Dr Columbia, SC | 3.0 | 2.5 | 1335 | $1,875 | $1.40 | 23d | 1 | 1.39mi |
| 204 Winding Chestnut Dr Columbia, SC | 3.0 | 2.5 | 1335 | $1,875 | $1.40 | 23d | 1 | 1.39mi |
| 201 Winding Chestnut Dr Columbia, SC | 3.0 | 2.5 | 1335 | $1,975 | $1.48 | 23d | 1 | 1.40mi |
| 208 Winding Chestnut Dr Columbia, SC | 3.0 | 2.5 | 1335 | $2,125 | $1.59 | 3d | 1 | 1.40mi |
| 210 Winding Chestnut Dr Columbia, SC | 3.0 | 2.5 | 1335 | $2,025 | $1.52 | 3d | 1 | 1.40mi |
| 212 Winding Chestnut Dr Columbia, SC | 3.0 | 2.5 | 1335 | $2,025 | $1.52 | 3d | 1 | 1.41mi |
| 209 Winding Chestnut Dr Columbia, SC | 3.0 | 2.5 | 1335 | $2,125 | $1.59 | 3d | 1 | 1.41mi |
| 214 Winding Chestnut Dr Columbia, SC | 3.0 | 2.5 | 1335 | $2,125 | $1.59 | 3d | 1 | 1.41mi |
| 211 Winding Chestnut Dr Columbia, SC | 3.0 | 2.5 | 1335 | $2,025 | $1.52 | 3d | 1 | 1.41mi |
| 220 Winding Chestnut Dr Columbia, SC | 3.0 | 2.5 | 1335 | $2,125 | $1.59 | 3d | 1 | 1.42mi |
| 213 Winding Chestnut Dr Columbia, SC | 3.0 | 2.5 | 1335 | $2,025 | $1.52 | 3d | 1 | 1.42mi |
| 222 Winding Chestnut Dr Columbia, SC | 3.0 | 2.5 | 1335 | $2,025 | $1.52 | 3d | 1 | 1.42mi |
| 215 Winding Chestnut Dr Columbia, SC | 3.0 | 2.5 | 1335 | $2,125 | $1.59 | 3d | 1 | 1.42mi |
| 224 Winding Chestnut Dr Columbia, SC | 3.0 | 2.5 | 1335 | $2,025 | $1.52 | 3d | 1 | 1.42mi |
| 217 Winding Chestnut Dr Columbia, SC | 3.0 | 2.5 | 1335 | $2,125 | $1.59 | 3d | 1 | 1.42mi |
| 226 Winding Chestnut Dr Columbia, SC | 3.0 | 2.5 | 1335 | $2,125 | $1.59 | 3d | 1 | 1.43mi |
| 219 Winding Chestnut Dr Columbia, SC | 3.0 | 2.5 | 1335 | $2,025 | $1.52 | 3d | 1 | 1.43mi |
| 221 Winding Chestnut Dr Columbia, SC | 3.0 | 2.5 | 1335 | $2,025 | $1.52 | 3d | 1 | 1.43mi |
| 228 Winding Chestnut Dr Columbia, SC | 3.0 | 2.5 | 1335 | $2,125 | $1.59 | 3d | 1 | 1.43mi |
| 230 Winding Chestnut Dr Columbia, SC | 3.0 | 2.5 | 1335 | $2,025 | $1.52 | 3d | 1 | 1.43mi |
| 223 Winding Chestnut Dr Columbia, SC | 3.0 | 2.5 | 1335 | $2,125 | $1.59 | 3d | 1 | 1.43mi |
| 232 Winding Chestnut Dr Columbia, SC | 3.0 | 2.5 | 1335 | $2,025 | $1.52 | 3d | 1 | 1.44mi |
| 225 Winding Chestnut Dr Columbia, SC | 3.0 | 2.5 | 1335 | $2,125 | $1.59 | 3d | 1 | 1.44mi |
| 234 Winding Chestnut Dr Columbia, SC | 3.0 | 2.5 | 1335 | $2,125 | $1.59 | 3d | 1 | 1.44mi |
| 227 Winding Chestnut Dr Columbia, SC | 3.0 | 2.5 | 1335 | $2,025 | $1.52 | 3d | 1 | 1.44mi |
| 229 Winding Chestnut Dr Columbia, SC | 3.0 | 2.5 | 1335 | $2,025 | $1.52 | 3d | 1 | 1.44mi |
| 231 Winding Chestnut Dr Columbia, SC | 3.0 | 2.5 | 1335 | $2,125 | $1.59 | 3d | 1 | 1.45mi |
| 233 Winding Chestnut Dr Columbia, SC | 3.0 | 2.5 | 1335 | $2,125 | $1.59 | 3d | 1 | 1.45mi |
| 235 Winding Chestnut Dr Columbia, SC | 3.0 | 2.5 | 1335 | $2,025 | $1.52 | 3d | 1 | 1.45mi |
| 237 Winding Chestnut Dr Columbia, SC | 3.0 | 2.5 | 1335 | $2,125 | $1.59 | 3d | 1 | 1.46mi |
Listing history 3 events
-
2026-06-18days on market $242,500 Active 2 DOM
-
2026-06-16remarks 699-char remark
-
2026-06-16$242,500 Active 1 DOM
ⓘ Source: listings_history table (triggers on properties + properties_extension) + one-shot
backfill from property_details.listing_events for pre-trigger history.
Tax reassessment forecast SC · Resets to sale price
- Current annual tax
- $1,462 · $122/mo
- Projected year-2 tax
- $1,462 · $122/mo
- Expected delta
- $0/yr ($0/mo · 0.0%)
ⓘ Screening estimate from a state-policy table — verify with the county assessor before closing.
Climate risk First Street
- Flood 1/10 Low FEMA zone X (unshaded) · 0% chance over 30 yrs
- Wildfire 4/10 Moderate
- Heat 7/10 Severe 7 d/yr ≥108°F today · 16 d/yr by 30 yrs out
- Wind 6/10 Major 60% chance of damaging wind over 30 yrs
- Air quality 3/10 Moderate 2 unhealthy d/yr today · 3 by 30 yrs out
Nearby sold comps map
Loading sold comps map…
Walkable amenities ~0.75 mi
Loading nearby amenities…
Taxation est. · year 1
- Rental income
- $24,148
- − Mortgage interest
- −$13,584
- − Property taxes
- −$1,462
- − Insurance
- −$1,212
- − Repairs & maintenance
- −$1,932
- − Management
- −$1,932
- − Depreciation
- −$7,055
- Taxable loss
- −$3,028
- Est. tax savings @ 24.0%
- +$727
- After-tax cash flow
- $1,869/yr
For passive investors: Depreciation is non-cash, so a rental often shows a tax loss while cash-flowing — sheltering income. Rental losses are passive: they offset passive income freely, and up to $25,000/yr can offset ordinary (W-2) income if you actively participate and your MAGI is under $100k (phasing out to $0 by $150k); unused losses carry forward. On sale, claimed depreciation is recaptured at up to 25%, and gains may owe capital-gains tax (a 1031 exchange can defer both). Figures are a year-1 estimate at your 24.0% rate — not tax advice; consult a CPA.
Schools (NCES district)
- District
- Lexington 05
- NCES district ID
- 4502820
- Math proficiency
- 47% ▼ -7.00%
- Reading proficiency
- 55% ▼ -4.00%
- Median HH income
- $67,732
- Composite
- 45.28/100
- National rank
- #2656
- State rank
- #5 of 80 in SC
Livability — Columbia
- Score
- 78/100
- State rank
- #18
- US rank
- #2436
Category grades
Schools grade is shown separately in the Schools card above.
Census & demographics
No demographic data for this ZIP.
Market trends
- HPI YoY
- —
- Current HPI
- —
- Rent YoY
- —
- Metro
- —
- State GDP YoY
- ▲ 4.51%
- F500 in state
- 2
Industry mix (Fortune 500 HQ in SC)
| Industry | F500 HQs | Revenue |
|---|---|---|
| Packaging | 1 | $7B |
|
||
Price history
+105.5% since first listed5 events — show timeline
- 2026-06-15 Listed $242,500 Consolidated MLS
- 2006-08-23 Sold (Public Records) $140,000 Public Records
- 2001-11-07 Sold (Public Records) $134,000 Public Records
- 2001-11-07 Sold (Public Records) $134,000 Public Records
- 1997-09-08 Sold (Public Records) $118,000 Public Records
Property tax history
+2.3%/yrLatest (2025): $1,462 · +4.0% YoY. Source: county tax records.
Cash-flow waterfall
monthlySold comps — $/sqft
last 12 mo · ≤1 miLoading sold comps…