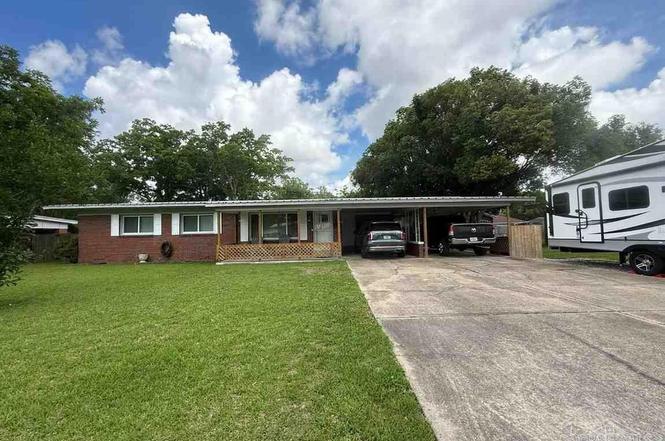
18 Cambridge Ave · Ensley, FL
Flood risk 1/10 · Minimal
- FEMA flood zone
- X (unshaded)
- Chance of flooding over 30 yrs
- 0.0%
- Est. flood insurance / yr
- $507 – $1,088
Fire risk 1/10 · Minimal
- Est. fire insurance / yr
- $947 – $1,759
Heat risk 10/10 · Severe
- Hot days now (above 106°F)
- 7 days/yr
- Hot days in 30 yrs
- 22 days/yr
Wind risk 9/10 · Severe
- Chance of severe wind over 30 yrs
- 99.0%
Air-quality risk 1/10 · Minimal
- Unhealthy air days now
- 0 days/yr
- Unhealthy air days in 30 yrs
- 0 days/yr
Risk factors via First Street. Map © Google.
Why this score? — see what drove the C grade
The composite is a weighted blend of 9 inputs, each scored 0–100. Each bar is that input's sub-score; the figure is the points it added to the 100-point composite (weight × sub-score).
- Cash flow +19.4/30.0
- ARV discount +13.5/15.0
- DSCR +6.1/10.0
- Livability +4.0/5.0
- 1% rule +3.9/10.0
- Schools +3.6/10.0
- Rent growth +3.4/5.0
- Condition / age +2.5/5.0
- Appreciation +0.0/10.0
$194,900
🖨 Deal sheet 📄 Offer letter ✓ Due diligence
Listing remarks MLS
Conveniently located and beautifully maintained! Original hardwood floors throughout, metal roof, and a huge yard are just the beginning of what this home has to offer. As you walk through the front door, you will fall in love with front porch that has plenty of room for rocking chairs. The living area opens into the dining and kitchen area, which make it perfect for entertaining. The bedrooms are spacious and all have nice sized closets! The double wide carport, attached 7x10 finished utility room and 12x16 shed give you plenty of room for storage. The back yard is fenced has a side double entry side gate, so you can pull your RV or boat into the backyard easily. Come take a look at all this house has to offer!
Key facts
- Metal roof
- Hvac
- Thermal windows
Tags
Property features AI
Finance
- HOA & community: No homeowners association
Exterior
- Parking: Covered 2-space carport (total 2 parking spaces)
- Utilities: Circuit breaker electrical service; Public sewer; Paved road access (no road maintenance required)
- Home design: Single-story brick home; Resale property; Not attached to other properties; Homestead-exempt
- Construction: Brick construction; Slab foundation; One level
- Exterior features: Front porch; Gable metal roof; Open loop geothermal heat pump
Interior
- Kitchen: Electric water heater
- Bedrooms: Master bedroom on the first floor (approx. 12 x 12); Two additional first-floor bedrooms (each approx. 10 x 10)
- Flooring: Hardwood; Tile
- Bathrooms: Two full bathrooms
- Heating & cooling: Central heating; Central air; Ceiling fans
- Interior features: Hardwood and tile flooring; Kitchen and dining combined
Neighborhood map
What this means for you Summary
Snapshot
- This is a 3-bed/2.0-bath single-family listed at $195k.
Deal economics
- At list price, monthly cash flow is $217 ($3k/yr) — positive.
- The deal already cash-flows at list — no discount required.
- To meet the 1% rule (rent ≥ 1% of price), the offer needs to be $173k (11.1% below list).
- Recommended offer: $173k (11.1% below list) — sets the bar for 1% rule.
- Cap rate 7.6% vs local median 4.7% in Ensley — top-decile yield for the area; either an underpriced asset or a hidden risk that comps aren't pricing in. Stress-test before assuming the spread holds.
Location & tenants
- Location reads 79/100 on livability (#133 in FL, #1,996 nationally) — a middle-class / working-renter tenant base. Strengths: cost of living A+, housing A+, health & safety A+; Watch: amenities D, employment D, schools F.
- Escambia (suburban): math 40% / reading 45% proficiency, ranked #56 of 73 in FL (top 77%) — families likely to look elsewhere, expect single-tenant / working-renter base with shorter leases.
- Market conditions: Rents rising (+3.6%/yr); 113 active listings in the ZIP; 12 comparable units currently listed for rent nearby; rentals at typical pace (median 14d on market — plan ~3-4 weeks tenant-placement turnaround); 1,479 units permitted in Escambia County in 2024 (0 in 5+ unit buildings).
- This rent runs 35% of the median local income ($59k/yr) — at the standard rent-burdened threshold; future hikes will face affordability resistance.
Forward outlook
- Local home prices are declining (-3.0%/yr); year-one equity from $1k of loan paydown is wiped out by about $6k of value loss. Plan a longer hold.
- Escambia County population projected at +13% by 2050 — modest demand growth; plan on rents tracking national, not racing it.
Negotiation context
- Only 7 days on market — expect competitive offers; lowballing is unlikely to land.
- 5 sale attempts since 23y ago with the ask held roughly flat each time — persistent listings suggest the price (not the market) is what's stuck; bring a comps-based counter.
- Current owner paid $135k; 44% above their basis — modest negotiation headroom, anchor on the comps not their cost.
Risks & watch-outs
- Watch-outs: built in 1959 — expect roof / HVAC / electrical / plumbing capex.
- Climate carrying-cost: severe wind risk, 99% chance of damaging wind over 30y; extreme-heat days projected 7→22/yr by 2055 (HVAC capex compounding) — expect insurance premiums to compound above CPI over the hold.
Questions for the listing agent
- Built in 1959 — when were the roof, HVAC, electrical panel, plumbing, and water heater last replaced?
- Is there a deadline driving the sale (1031 exchange, divorce, estate, relocation)? That informs how much negotiation room exists.
- Schools are F-rated, which usually means shorter tenancies and higher turnover. Who's the typical renter profile here, and what's been the actual vacancy rate?
- What's the average days-on-market for RENTAL listings here right now (not sales)? A rising rental-DOM trend means longer vacancies and softer asking-rent achievability than the comps imply.
- What's the recent tenant-quality profile in this submarket — average credit score on applications, eviction rate, late-payment / NSF rate, and stable-employment percentage? A property-management company in the area should have these aggregated.
- How much new for-sale + rental construction is in the pipeline within 1–3 miles? Heavy new supply typically softens prices + rents 12–24 months out; constrained supply supports both.
Investment metrics
- 1% rule
- 0.89% ✗
- Cap rate
- 7.63%
- Cash-on-cash
- 4.76%
- DSCR
- 1.21
- GRM
- 9.4
CMA / ARV
- ARV (on-the-fly)
- $224,900
- Comps found
- 12
Show comp detail 12 sales within ~0.75 mi
| Address | Dist | Beds/Ba | Sqft | Sold | Price | $/sf | Match |
|---|---|---|---|---|---|---|---|
| 14 Ivanhoe Ave | 0.06mi | 4/1.0 (+1) | 1,200 (-8%) | 9mo | $70,000 | $58 | 68 |
| 600 W Hannah St | 0.69mi | 3/2.0 | 1,270 (-2%) | 4mo | $115,000 | $91 | 61 |
| 576 Edith Ln | 0.61mi | 3/2.0 | 1,400 (+8%) | 3mo | $285,000 | $204 | 56 |
| 506 W Ensley St | 0.67mi | 3/2.0 | 1,267 (-2%) | 11mo | $230,000 | $182 | 56 |
| 644 Saleta St | 0.62mi | 3/2.0 | 1,233 (-5%) | 8mo | $230,000 | $187 | 56 |
| 9350 Everson Ave | 0.68mi | 3/1.5 | 1,215 (-6%) | 0mo | $199,999 | $165 | 55 |
| 514 W Ensley St | 0.67mi | 3/2.0 | 1,179 (-9%) | 1mo | $230,000 | $195 | 52 |
| 218 Barker St | 0.72mi | 3/2.0 | 1,256 (-3%) | 12mo | $216,880 | $173 | 51 |
| 9517 N Palafox St | 0.42mi | 2/1.5 (-1) | 1,168 (-10%) | 8mo | $162,762 | $139 | 50 |
| 8895 Untreiner Ave | 0.67mi | 3/2.0 | 1,452 (+12%) | 7mo | $200,000 | $138 | 44 |
| 532 Edith Ln | 0.59mi | 3/2.0 | 1,482 (+14%) | 7mo | $267,000 | $180 | 43 |
| 8720 Chemstrand Rd | 0.68mi | 2/2.0 (-1) | 1,492 (+15%) | 11mo | $215,000 | $144 | 30 |
Match score weights: distance 35% · size 25% · config 20% · recency 20%. Top-matched comps best support the ARV.
Projected returns pro-forma
-3.0% appreciation · 3.63% rent growth · sell at horizon
- IRR
- -8.3%
- Equity multiple
- 0.69×
- Total profit
- $-16,769
- Equity at exit
- $29,060
- IRR
- 1.9%
- Equity multiple
- 1.14×
- Total profit
- $7,383
- Equity at exit
- $16,851
Cash invested: $54,572 (down + closing). Projections, not guarantees.
Landlord ↔ Tenant lean methodology
- Overall (STATE)
- 87 Strongly Landlord-Friendly
- State Florida
- 87 Strongly Landlord-Friendly · R+3
- County
- — inherits STATE
- City
- — inherits STATE
ZIP-level market 32534
- Home prices YoY
- -19.1%
- Rents YoY
- 3.6%
- Active inventory
- 113
- Price-to-rent
- 9.4×
Monthly cashflow live
- Estimated rent
- $1,733 high interval (Pro) →
- Mortgage (P&I)
- −$1,022
- Tax from tax record
- −$49 /mo · $587/yr
- Insurance
- −$81
- HOA
- −$0
- Vacancy / Maint / Mgmt
- −$364
- Net cashflow
- $217
Break-even live
UW: 25.0% down · 7.5% · 30yr · 1.5% tax · 5.0% vac · 8.0% maint · 8.0% mgmt
Financing live
Cash to close
- Down payment
- $48,725
- Closing costs
- $5,847
- Reserves months
- —
- Total cash needed
- —
Loan-product check · same deal, 3 products live
Conventional
25% down · 7.5% · 30yr
- Down + closing
- —
- Monthly P&I
- —
- Monthly cashflow
- —
- DSCR
- —
- Eligible?
- —
Personal DTI + credit; lowest rate.
DSCR
20% down · 8.5% · 30yr
- Down + closing
- —
- Monthly P&I
- —
- Monthly cashflow
- —
- DSCR
- —
- Eligible?
- —
No personal income docs; deal must DSCR.
Hard money
10% down · 12.0% · 12mo
- Down + closing
- —
- Monthly P&I
- —
- Monthly cashflow
- —
- DSCR
- —
- Eligible?
- —
Short-term bridge; refi at stabilization.
Rent comps 12 comps
| Address | Beds | Baths | Sqft | Rent | $/sqft | DOM | Units | Dist |
|---|---|---|---|---|---|---|---|---|
| 130 E 9 Mile Rd #5 Pensacola, FL | 2.0 | 1.0 | 925 | $1,095 | $1.18 | 23d | 1 | 0.26mi |
| 8660 Figland Ave Pensacola, FL | 3.0 | 2.0 | 1106 | $1,550 | $1.40 | 14d | 1 | 0.71mi |
| 975 Lovebird Ct Pensacola, FL | 4.0 | 2.0 | 1768 | $2,100 | $1.19 | 14d | 1 | 0.87mi |
| 951 Lovebird Ct Pensacola, FL | 4.0 | 2.0 | 1787 | $2,150 | $1.20 | 14d | 1 | 0.87mi |
| 8881 Bellawood Cir Pensacola, FL | 3.0 | 2.0 | 1685 | $2,100 | $1.25 | 23d | 1 | 0.91mi |
| 9095 Airway Dr Pensacola, FL | 1.0–3.0 | 1.0–2.0 | 1542 | $1,809 | $1.17 | 14d | 19 | 0.97mi |
| 8644 Cove Ave Pensacola, FL | 3.0 | 2.0 | 1588 | $1,850 | $1.16 | 23d | 1 | 1.13mi |
| 9091 Airway Dr Pensacola, FL | 2.0 | 2.0 | 1524 | $1,675 | $1.10 | 14d | 6 | 1.14mi |
| 8651 Airway Dr Pensacola, FL | 2.0 | 2.0 | 1170 | $1,682 | $1.44 | 21d | 15 | 1.24mi |
| 9980 Bowman Ave Unit L Pensacola, FL | 3.0 | 2.0 | 1150 | $1,595 | $1.39 | 14d | 1 | 1.39mi |
| 9980 Bowman Ave Unit N Pensacola, FL | 3.0 | 2.0 | 1150 | $1,595 | $1.39 | 21d | 1 | 1.39mi |
| 758 Mozingo Ln Pensacola, FL | 3.0 | 2.0 | 1700 | $1,850 | $1.09 | 14d | 1 | 1.45mi |
Listing history 6 events
-
2026-06-18days on market $194,900 Active 7 DOM
-
2026-06-17days on market $194,900 Active 6 DOM
-
2026-06-16days on market $194,900 Active 5 DOM
-
2026-06-15days on market $194,900 Active 4 DOM
-
2026-06-14remarks 699-char remark
-
2026-06-14$194,900 Active 2 DOM
ⓘ Source: listings_history table (triggers on properties + properties_extension) + one-shot
backfill from property_details.listing_events for pre-trigger history.
Tax reassessment forecast FL · Resets to sale price
- Current annual tax
- $587 · $49/mo
- Projected year-2 tax
- $1,618 · $135/mo
- Expected delta
- +$1,031/yr (+$86/mo · 175.6%)
ⓘ Screening estimate from a state-policy table — verify with the county assessor before closing.
Climate risk First Street
- Flood 1/10 Low FEMA zone X (unshaded) · 0% chance over 30 yrs
- Wildfire 1/10 Low
- Heat 10/10 Extreme 7 d/yr ≥106°F today · 22 d/yr by 30 yrs out
- Wind 9/10 Extreme 99% chance of damaging wind over 30 yrs
- Air quality 1/10 Low 0 unhealthy d/yr today · 0 by 30 yrs out
Nearby sold comps map
Loading sold comps map…
Walkable amenities ~0.75 mi
Loading nearby amenities…
Taxation est. · year 1
- Rental income
- $20,793
- − Mortgage interest
- −$10,917
- − Property taxes
- −$587
- − Insurance
- −$974
- − Repairs & maintenance
- −$1,663
- − Management
- −$1,663
- − Depreciation
- −$5,670
- Taxable loss
- −$682
- Est. tax savings @ 24.0%
- +$164
- After-tax cash flow
- $2,764/yr
For passive investors: Depreciation is non-cash, so a rental often shows a tax loss while cash-flowing — sheltering income. Rental losses are passive: they offset passive income freely, and up to $25,000/yr can offset ordinary (W-2) income if you actively participate and your MAGI is under $100k (phasing out to $0 by $150k); unused losses carry forward. On sale, claimed depreciation is recaptured at up to 25%, and gains may owe capital-gains tax (a 1031 exchange can defer both). Figures are a year-1 estimate at your 24.0% rate — not tax advice; consult a CPA.
Schools (NCES district)
- District
- Escambia
- NCES district ID
- 1200510
- Math proficiency
- 40% ▼ -9.00%
- Reading proficiency
- 45% ▼ -4.00%
- Median HH income
- $44,649
- Composite
- 36.04/100
- National rank
- #4773
- State rank
- #56 of 73 in FL
Livability — Ensley
- Score
- 79/100
- State rank
- #133
- US rank
- #1996
Category grades
Schools grade is shown separately in the Schools card above.
Census & demographics
- Census place
- Ensley, FL
- County
- Escambia County · 301,722 people
- City population
- 15,879
- Metro
- Pensacola-Ferry Pass-Brent, FL
- Population (ZIP)
- 17,104
- Household income
- $58,992
- Rent vs Own
- Severe rent burden
- 540.0
Population outlook (Escambia County) Hauer SSP2
- Today (2025)
- 334,637 people
- By 2030
- 345,779 · +3.3%
- By 2040
- 364,828 · +9.0%
- By 2050
- 378,514 · +13.1%
- By 2075
- 403,220 · +20.5%
- By 2100
- 386,125 · +15.4%
Race, ethnicity, and origin ACS 2023
- Neighborhood character
- Diverse neighborhood (Simpson 0.65)
- Race & ethnicity
- White 51% Black 30% Two or more races 9% Hispanic / Latino 8% Asian 5%
- Hispanic origin (detail)
- Mexican 2%
- Common ancestry
- Serbian 3% Italian 2% Portuguese 1%
- Foreign-born
- 8% · Canada, Vietnam, Jamaica
- Languages at home
- 89% English-only · Spanish 6% Vietnamese 2% Tagalog/Filipino 1%
Political lean MEDSL · Escambia
- 2024 margin
- R (+19.5) · D 39.7% · R 59.2% · Other 1.1%
- 2008→2024 swing
- -0.2pp no change · 2008: -19.3pp · 2024: -19.5pp
- All cycles
- 2024: R+19.5 2020: R+15.1 2016: R+20.6 2012: R+20.6 2008: R+19.3
Not yet ingested
- Civics
- —
Market trends
- HPI YoY
- ▼ -60.23%
- Current HPI
- 255.7617
- Rent YoY
- ▲ 3.63%
- Metro
- Pensacola-Ferry Pass-Brent, FL
- State GDP YoY
- ▲ 3.28%
- F500 in state
- 36
Industry mix (Fortune 500 HQ in FL)
| Industry | F500 HQs | Revenue |
|---|---|---|
| Industrial Technology | 2 | $29B |
|
||
| Insurance | 2 | $17B |
|
||
| Retail | 1 | $60B |
|
||
| Technology Distribution | 1 | $58B |
|
||
| Homebuilding | 1 | $35B |
|
||
| Technology Manufacturing | 1 | $35B |
|
||
Price history
+369.6% since first listed14 events — show timeline
- 2026-06-11 Listed $194,900 PARMLS
- 2020-11-20 Sold (MLS) $135,000 PARMLS
- 2020-10-28 Listed $135,000 PARMLS
- 2018-02-09 Sold (Public Records) $115,000 Public Records
- 2018-02-09 Sold (MLS) $115,000 PARMLS
- 2017-12-02 Listed $115,000 PARMLS
- 2006-04-03 Sold (Public Records) $114,000 Public Records
- 2006-03-24 Sold (MLS) $114,000 PARMLS
- 2006-01-23 Listed $117,500 PARMLS
- 2003-10-27 Sold (Public Records) $80,500 Public Records
- 2003-10-22 Sold (MLS) $80,500 PARMLS
- 2003-06-09 Listed $82,500 PARMLS
- 1991-12-01 Sold (Public Records) $56,000 Public Records
- 1991-12-01 Sold (Public Records) $41,500 Public Records
Property tax history
-4.6%/yrLatest (2025): $587 · -22.4% YoY. Source: county tax records.
Cash-flow waterfall
monthlySold comps — $/sqft
last 12 mo · ≤1 miLoading sold comps…