 Duplex
9614 Wellsworth Dr · Houston, TX
Flood risk 8/10 · Major
- FEMA flood zone
- X (unshaded)
- Chance of flooding over 30 yrs
- 0.99%
- Est. flood insurance / yr
- $507 – $1,088
Fire risk 1/10 · Minimal
- Est. fire insurance / yr
- $1,222 – $2,270
Heat risk 9/10 · Severe
- Hot days now (above 110°F)
- 7 days/yr
- Hot days in 30 yrs
- 23 days/yr
Wind risk 9/10 · Severe
- Chance of severe wind over 30 yrs
- 99.0%
Air-quality risk 2/10 · Minimal
- Unhealthy air days now
- 2 days/yr
- Unhealthy air days in 30 yrs
- 2 days/yr
Risk factors via First Street. Map © Google.
Why this score? — see what drove the B- grade
The composite is a weighted blend of 9 inputs, each scored 0–100. Each bar is that input's sub-score; the figure is the points it added to the 100-point composite (weight × sub-score).
- Cash flow +25.2/30.0
- ARV discount +15.0/15.0
- DSCR +8.3/10.0
- 1% rule +6.6/10.0
- Schools +4.5/10.0
- Livability +3.7/5.0
- Rent growth +3.0/5.0
- Condition / age +2.5/5.0
- Appreciation +0.0/10.0
$217,990
🖨 Deal sheet (PDF) 📄 Offer letter ✓ Due diligence
Multi-family units
County records classify this as Multi-Family (2-4 Unit). Listing-text estimate: 2 units. confirmed
Listing remarks MLS
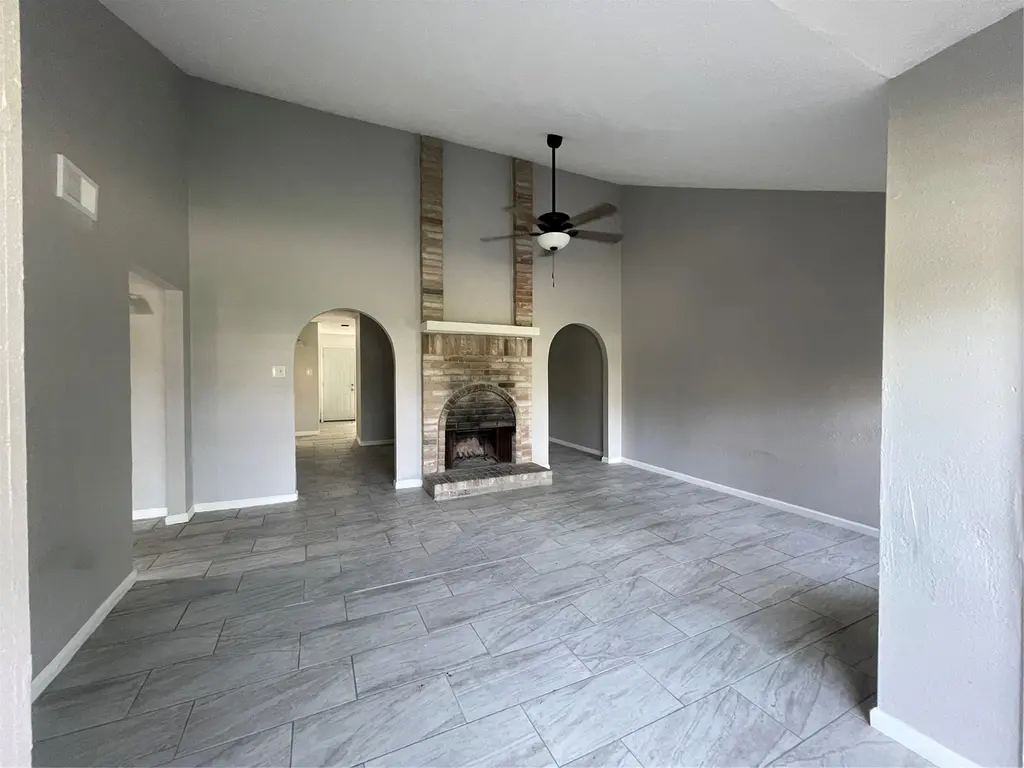
Nicely updated duplex located on the southwest side of town with immediate access to the West Park tollway. Only one side of the duplex is for sale. It’s in a great location with so many nearby retail shopping and fine dining destinations to enjoy!
Key facts
- Immediate access
- Dining destinations
- Nearby shopping
Tags
Neighborhood map
What this means for you Summary
Snapshot
- This is a 2 × 2-bed/1-bath units multifamily listed at $218k.
Deal economics
- At list price, monthly cash flow is $425 ($5k/yr) — positive. Per door: $212/mo.
- The deal already cash-flows at list — no discount required.
- Meets the 1% rule at list price ($3k rent vs $218k).
- Recommended offer: $192k (12.0% below list) — sets the bar for market timing.
- Cap rate 9.0% vs local median 3.2% in Houston — top-decile yield for the area; either an underpriced asset or a hidden risk that comps aren't pricing in. Stress-test before assuming the spread holds.
Location & tenants
- Location reads 74/100 on livability (#184 in TX, #4,771 nationally) — a middle-class / working-renter tenant base. Strengths: amenities A+, cost of living A+, housing A+; Watch: schools D, crime F.
- Fort Bend ISD (suburban): math 44% / reading 53% proficiency, ranked #140 of 826 in TX (top 17%) — families likely to look elsewhere, expect single-tenant / working-renter base with shorter leases.
- Market conditions: Rents rising (+1.9%/yr); 263 active listings in the ZIP; 25 comparable units currently listed for rent nearby; rentals at typical pace (median 23d on market — plan ~3-4 weeks tenant-placement turnaround); 44% of comp listings sitting > 30 days — soft ceiling on asking rent; 12,093 units permitted in Fort Bend County in 2024 (815 in 5+ unit buildings).
- At $2,520/mo this rent would consume 47% of the median local household income ($64k/yr) (locally 2410% of renters already pay >50% of income on rent) — very limited rent-growth headroom before tenants either downsize or default.
Forward outlook
- Local home prices are declining (-3.0%/yr); year-one equity from $2k of loan paydown is wiped out by about $7k of value loss. Plan a longer hold.
- Fort Bend County population projected at +75% by 2050 — long-run rental-demand tailwind backs the buy-and-hold thesis.
Negotiation context
- It's been on market 444 days — a 12% lower offer ($192k) is reasonable based on typical stale-listing flexibility.
Risks & watch-outs
- Watch-outs: flood insurance adds $66/mo.
- Climate carrying-cost: severe flood risk; severe wind risk, 99% chance of damaging wind over 30y; extreme-heat days projected 7→23/yr by 2055 (HVAC capex compounding) — expect insurance premiums to compound above CPI over the hold.
Questions for the listing agent
- It's been on market 444 days. Have you received any prior offers? Is the seller open to a 12% concession, seller financing, or rate buy-down credit?
- Can we see the unit-by-unit rent roll, current vacancy, and any below-market leases? What's the average tenancy length?
- What capital expenditures (roof, boiler, parking lot, exteriors) have been made in the last 5 years, and what's planned in the next 2?
- What's the actual annual flood-insurance premium (NFIP or private), and is the property in a SFHA with mandatory coverage?
- Why hasn't it sold? Are there any deal-killer items the seller is aware of (foundation, flood, title, zoning, code violations)?
- Is there a deadline driving the sale (1031 exchange, divorce, estate, relocation)? That informs how much negotiation room exists.
- Schools are D-rated, which usually means shorter tenancies and higher turnover. Who's the typical renter profile here, and what's been the actual vacancy rate?
- Crime grade is F in this area — have there been break-ins, vandalism, or insurance claims at this property in the last 3 years? What carrier currently insures it and at what premium?
- What's the average days-on-market for RENTAL listings here right now (not sales)? A rising rental-DOM trend means longer vacancies and softer asking-rent achievability than the comps imply.
- What's the recent tenant-quality profile in this submarket — average credit score on applications, eviction rate, late-payment / NSF rate, and stable-employment percentage? A property-management company in the area should have these aggregated.
- How much new apartment / multifamily construction is in the pipeline within 1–3 miles? Heavy new supply (>2% of stock underway) typically softens rents 12–24 months out; light construction supports rent growth.
Investment metrics
- 1% rule
- 1.16% ✓
- Cap rate
- 9.00%
- Cash-on-cash
- 9.65%
- DSCR
- 1.43
- GRM
- 7.2
CMA / ARV
- ARV (median comp)
- $266,788
- List price
- $217,990
- Delta
- -18.29%
- Verdict
- UNDERPRICED
- Comps
- 7 within 2.0 mi
Projected returns pro-forma
-3.0% appreciation · 1.89% rent growth · sell at horizon
- IRR
- -4.9%
- Equity multiple
- 0.82×
- Total profit
- $-10,989
- Equity at exit
- $32,503
- IRR
- 3.4%
- Equity multiple
- 1.24×
- Total profit
- $14,387
- Equity at exit
- $18,848
Cash invested: $61,037 (down + closing). Projections, not guarantees.
Landlord ↔ Tenant lean methodology
- Overall (STATE)
- 87 Strongly Landlord-Friendly
- State Texas
- 87 Strongly Landlord-Friendly · R+5
- County
- — inherits STATE
- City
- — inherits STATE
ZIP-level market 77083
- Home prices YoY
- -19.3%
- Rents YoY
- 1.9%
- Active inventory
- 263
- Price-to-rent
- 14.4×
Monthly cashflow live
- Estimated rent
- $2,520 high interval (Pro) →
- Mortgage (P&I)
- −$1,143
- Tax from tax record
- −$266 /mo · $3,189/yr
- Insurance
- −$91
- Flood insurance flood zone
- −$66 /mo · $798/yr
- HOA
- −$0
- Vacancy / Maint / Mgmt
- −$529
- Net cashflow
- $425
Break-even live
Sensitivity live
| Price | -10% $548 | -5% $486 | +0% $425 | +5% $363 | +10% $301 |
|---|---|---|---|---|---|
| Rent | -10% $226 | -5% $325 | +0% $425 | +5% $524 | +10% $624 |
| Rate | -1.0pp $534 | -0.5pp $480 | base $425 | +0.5pp $368 | +1.0pp $311 |
2-unit breakdown (identical units grouped — click to expand)
| Units | Beds | Baths | Est. rent |
|---|---|---|---|
| 2× units | 2 | 1 | $2,520 |
| #1 | 2 | 1 | $1,260 |
| #2 | 2 | 1 | $1,260 |
| Total (2 units) | $2,520 | ||
UW: 25.0% down · 7.5% · 30yr · 1.5% tax · 5.0% vac · 8.0% maint · 8.0% mgmt
Financing live
Cash to close
- Down payment
- $54,498
- Closing costs
- $6,540
- Reserves months
- —
- Total cash needed
- —
Loan-product check · same deal, 3 products live
Conventional
25% down · 7.5% · 30yr
- Down + closing
- —
- Monthly P&I
- —
- Monthly cashflow
- —
- DSCR
- —
- Eligible?
- —
Personal DTI + credit; lowest rate.
DSCR
20% down · 8.5% · 30yr
- Down + closing
- —
- Monthly P&I
- —
- Monthly cashflow
- —
- DSCR
- —
- Eligible?
- —
No personal income docs; deal must DSCR.
Hard money
10% down · 12.0% · 12mo
- Down + closing
- —
- Monthly P&I
- —
- Monthly cashflow
- —
- DSCR
- —
- Eligible?
- —
Short-term bridge; refi at stabilization.
Rent comps 25 comps
| Address | Beds | Baths | Sqft | Rent | $/sqft | DOM | Units | Dist |
|---|---|---|---|---|---|---|---|---|
| 13916 Bonnercrest Dr Houston, TX | 3.0 | 2.0 | 1512 | $1,610 | $1.06 | 6d | 1 | 0.19mi |
| 9323 Westacre Pl Houston, TX | 3.0 | 3.0 | 1659 | $1,470 | $0.89 | 44d | 1 | 0.43mi |
| 10111 King Ranch Ln Sugar Land, TX | 3.0 | 2.0 | 1419 | $1,850 | $1.30 | 21d | 1 | 0.77mi |
| 10411 Cedartowne Ln Sugar Land, TX | 3.0 | 2.0 | 1296 | $1,756 | $1.35 | 23d | 1 | 0.78mi |
| 10515 Long River Dr Sugar Land, TX | 3.0 | 2.0 | 1584 | $1,695 | $1.07 | 23d | 1 | 1.00mi |
| 10527 Westedge Dr Sugar Land, TX | 4.0 | 2.0 | 1604 | $1,800 | $1.12 | 44d | 1 | 1.00mi |
| 13027 Bacard Ln Houston, TX | 3.0 | 2.0 | 1748 | $1,750 | $1.00 | 44d | 1 | 1.01mi |
| 14402 W Bellfort Ave Unit 28654 Sugar Land, TX | 2.0 | 2.0 | 1360 | $1,488 | $1.09 | 44d | 1 | 1.14mi |
| 14402 W Bellfort Ave Unit 22258 Sugar Land, TX | 2.0 | 2.0 | 1358 | $1,475 | $1.09 | 44d | 1 | 1.14mi |
| 14402 W Bellfort Unit 2174 Sugar Land, TX | 2.0 | 2.0 | 1053 | $1,643 | $1.56 | 11d | 1 | 1.20mi |
| 14402 W Bellfort Unit 14439 Sugar Land, TX | 2.0 | 2.0 | 1053 | $1,654 | $1.57 | 44d | 1 | 1.20mi |
| 14402 W Bellfort Unit 2148 Sugar Land, TX | 2.0 | 2.0 | 1053 | $1,603 | $1.52 | 0d | 1 | 1.20mi |
| 14402 W Bellfort St Sugar Land, TX | 2.0 | 2.0 | 1053 | $1,577 | $1.50 | 23d | 1 | 1.20mi |
| 14402 W Bellfort Apt 424 Sugar Land, TX | 2.0 | 2.0 | 1053 | $1,619 | $1.54 | 6d | 1 | 1.20mi |
| 10810 Lakewood Oaks Dr Sugar Land, TX | 3.0 | 2.0 | 1059 | $1,641 | $1.55 | 44d | 1 | 1.22mi |
| 13106 W Bellfort Ave Houston, TX | 2.0 | 2.0 | 1098 | $1,485 | $1.35 | 44d | 1 | 1.24mi |
| 13100 W Bellfort Ave Houston, TX | 1.0–3.0 | 1.0–2.0 | 1021 | $2,152 | $2.11 | 2d | 28 | 1.25mi |
| 14007 Florence Rd Sugar Land, TX | 2.0 | 2.0 | 1053 | $1,577 | $1.50 | 12d | 1 | 1.34mi |
| 9506 S Dairy Ashford Rd Houston, TX | 2.0–3.0 | 1.5–2.5 | 1223 | $1,260 | $1.03 | 2d | 13 | 1.35mi |
| 9420 S Dairy Ashford Rd Houston, TX | 3.0 | 2.0 | 1228 | $1,370 | $1.12 | 44d | 1 | 1.37mi |
| 10723 Forest Leaf Dr Sugar Land, TX | 3.0 | 2.0 | 1171 | $1,800 | $1.54 | 44d | 1 | 1.39mi |
| 10811 Forest Leaf Dr Sugar Land, TX | 3.0 | 2.0 | 1383 | $1,766 | $1.28 | 44d | 1 | 1.43mi |
| 9903 S Dairy Ashford Rd Unit 510 Houston, TX | 3.0 | 2.0 | 1082 | $1,129 | $1.04 | 0d | 1 | 1.46mi |
| 2414 Chelston Ct Sugar Land, TX | 3.0 | 2.0 | 1736 | $2,198 | $1.27 | 3d | 1 | 1.46mi |
| 12717 Yoshino Cherry St Houston, TX | 3.0 | 2.5 | 1650 | $1,950 | $1.18 | 25d | 1 | 1.48mi |
Listing history 19 events
-
2026-06-21days on market $217,990 Active 444 DOM
-
2026-06-18days on market $217,990 Active 441 DOM
-
2026-06-17days on market $217,990 Active 440 DOM
-
2026-06-16days on market $217,990 Active 439 DOM
-
2026-06-15days on market $217,990 Active 438 DOM
-
2026-06-13days on market $217,990 Active 436 DOM
-
2026-06-09days on market $217,990 Active 432 DOM
-
2026-06-07days on market $217,990 Active 430 DOM
-
2026-06-04days on market $217,990 Active 427 DOM
-
2026-06-03days on market $217,990 Active 426 DOM
-
2026-06-02days on market $217,990 Active 425 DOM
-
2026-06-01days on market $217,990 Active 424 DOM
-
2026-05-31days on market $217,990 Active 423 DOM
-
2026-02-16soldstatus
-
2025-09-18price $217,990 254-char remark
Show marketing remark (254 chars)
Nicely updated duplex located on the southwest side of town with immediate access to the West Park tollway. Only one side of the duplex is for sale. It’s in a great location with so many nearby retail shopping and fine dining destinations to enjoy!
-
2025-06-18price $219,000 254-char remark
Show marketing remark (254 chars)
Nicely updated duplex located on the southwest side of town with immediate access to the West Park tollway. Only one side of the duplex is for sale. It’s in a great location with so many nearby retail shopping and fine dining destinations to enjoy!
-
2025-04-25price $220,000 254-char remark
Show marketing remark (254 chars)
Nicely updated duplex located on the southwest side of town with immediate access to the West Park tollway. Only one side of the duplex is for sale. It’s in a great location with so many nearby retail shopping and fine dining destinations to enjoy!
-
2025-04-04$249,000 Active 254-char remark
Show marketing remark (254 chars)
Nicely updated duplex located on the southwest side of town with immediate access to the West Park tollway. Only one side of the duplex is for sale. It’s in a great location with so many nearby retail shopping and fine dining destinations to enjoy!
-
1996-12-02soldstatus
ⓘ Source: listings_history table (triggers on properties + properties_extension) + one-shot
backfill from property_details.listing_events for pre-trigger history.
Tax reassessment forecast TX · Resets to sale price
- Current annual tax
- $3,189 · $266/mo
- Projected year-2 tax
- $3,989 · $332/mo
- Expected delta
- +$800/yr (+$67/mo · 25.1%)
ⓘ Screening estimate from a state-policy table — verify with the county assessor before closing.
Climate risk First Street
- Flood 8/10 Severe FEMA zone X (unshaded) · 99% chance over 30 yrs
- Wildfire 1/10 Low
- Heat 9/10 Extreme 7 d/yr ≥110°F today · 23 d/yr by 30 yrs out
- Wind 9/10 Extreme 99% chance of damaging wind over 30 yrs
- Air quality 2/10 Low 2 unhealthy d/yr today · 2 by 30 yrs out
Nearby sold comps map
Loading sold comps map…
Walkable amenities ~0.75 mi
Loading nearby amenities…
Taxation est. · year 1
- Rental income
- $30,240
- − Mortgage interest
- −$12,211
- − Property taxes
- −$3,189
- − Insurance
- −$1,887
- − Repairs & maintenance
- −$2,419
- − Management
- −$2,419
- − Depreciation
- −$6,342
- Taxable income
- $1,773
- Est. tax owed @ 24.0%
- −$426
- After-tax cash flow
- $4,670/yr
For passive investors: Depreciation is non-cash, so a rental often shows a tax loss while cash-flowing — sheltering income. Rental losses are passive: they offset passive income freely, and up to $25,000/yr can offset ordinary (W-2) income if you actively participate and your MAGI is under $100k (phasing out to $0 by $150k); unused losses carry forward. On sale, claimed depreciation is recaptured at up to 25%, and gains may owe capital-gains tax (a 1031 exchange can defer both). Figures are a year-1 estimate at your 24.0% rate — not tax advice; consult a CPA.
Schools (NCES district)
- District
- Fort Bend ISD
- NCES district ID
- 4819650
- Math proficiency
- 44% ▼ -15.00%
- Reading proficiency
- 53% ▼ -4.00%
- Median HH income
- $82,360
- Composite
- 44.61/100
- National rank
- #2779
- State rank
- #140 of 826 in TX
Livability — Houston
- Score
- 74/100
- State rank
- #184
- US rank
- #4771
Category grades
Schools grade is shown separately in the Schools card above.
Census & demographics
- County
- Harris County · 4,702,590 people
- City population
- 3,226,434
- Metro
- Houston-The Woodlands-Sugar Land, TX
- Population (ZIP)
- 73,230
- Household income
- $64,418
- Rent vs Own
- Severe rent burden
- 2410.0
Population outlook (Fort Bend County) Hauer SSP2
- Today (2025)
- 1,004,526 people
- By 2030
- 1,153,104 · +14.8%
- By 2040
- 1,453,718 · +44.7%
- By 2050
- 1,753,781 · +74.6%
- By 2075
- 2,455,772 · +144.5%
- By 2100
- 2,930,528 · +191.7%
Race, ethnicity, and origin ACS 2023
- Neighborhood character
- Highly diverse neighborhood (Simpson 0.72)
- Race & ethnicity
- Hispanic / Latino 35% Black 30% Asian 23% Two or more races 14% White 8%
- Hispanic origin (detail)
- Mexican 16% Puerto Rican 1% Cuban 1%
- Foreign-born
- 47% · Canada, Vietnam, China
- Languages at home
- 38% English-only · Spanish 29% Vietnamese 11% Other Indo-European 6%
Political lean MEDSL · Fort Bend
- 2024 margin
- Toss-up / Even · D 49.5% · R 47.9% · Other 2.6%
- 2008→2024 swing
- +4.0pp toward D · 2008: -2.4pp · 2024: 1.6pp
- All cycles
- 2024: D+1.6 2020: D+10.6 2016: D+6.6 2012: R+6.8 2008: R+2.4
Not yet ingested
- Civics
- —
Market trends
- HPI YoY
- ▼ -65.00%
- Current HPI
- 271.2157
- Rent YoY
- ▲ 1.89%
- Metro
- Houston-The Woodlands-Sugar Land, TX
- State GDP YoY
- ▲ 3.95%
- F500 in state
- 110
Industry mix (Fortune 500 HQ in TX)
| Industry | F500 HQs | Revenue |
|---|---|---|
| Energy | 16 | $1,198B |
|
||
| Technology | 5 | $198B |
|
||
| Engineering / Construction | 4 | $72B |
|
||
| Energy Services | 3 | $60B |
|
||
| Utilities | 3 | $41B |
|
||
| Healthcare | 2 | $330B |
|
||
Price history
-12.5% since first listed6 events — show timeline
- 2026-02-16 Sold (Public Records) — Public Records
- 2025-09-18 Price Changed $217,990 HARMLS
- 2025-06-18 Price Changed $219,000 HARMLS
- 2025-04-25 Price Changed $220,000 HARMLS
- 2025-04-04 Listed $249,000 HARMLS
- 1996-12-02 Sold (Public Records) — Public Records
Property tax history
+5.0%/yrLatest (2025): $3,189 · -3.7% YoY. Source: county tax records.
Cash-flow waterfall
monthlySold comps — $/sqft
last 12 mo · ≤1 miLoading sold comps…