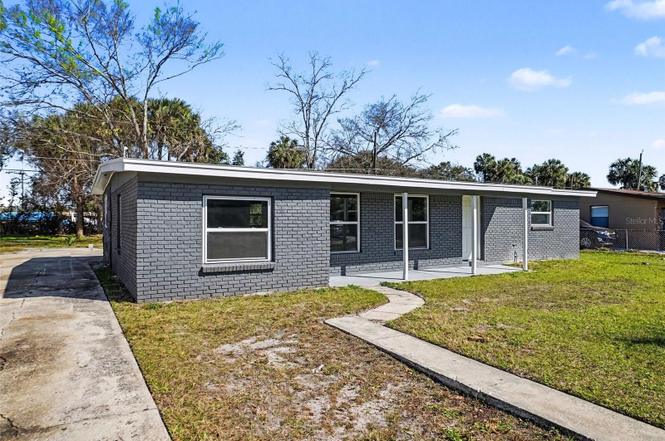
3032 Truman Blvd · Sanford, FL
Flood risk 4/10 · Minor
- FEMA flood zone
- X (unshaded)
- Chance of flooding over 30 yrs
- 0.2%
- Est. flood insurance / yr
- $507 – $1,088
Fire risk 1/10 · Minimal
- Est. fire insurance / yr
- $947 – $1,759
Heat risk 8/10 · Major
- Hot days now (above 107°F)
- 7 days/yr
- Hot days in 30 yrs
- 21 days/yr
Wind risk 9/10 · Severe
- Chance of severe wind over 30 yrs
- 99.0%
Air-quality risk 2/10 · Minimal
- Unhealthy air days now
- 1 days/yr
- Unhealthy air days in 30 yrs
- 1 days/yr
Risk factors via First Street. Map © Google.
Why this score? — see what drove the D+ grade
The composite is a weighted blend of 9 inputs, each scored 0–100. Each bar is that input's sub-score; the figure is the points it added to the 100-point composite (weight × sub-score).
- Cash flow +12.7/30.0
- ARV discount +12.7/15.0
- Schools +5.1/10.0
- DSCR +3.8/10.0
- Livability +3.7/5.0
- 1% rule +2.6/10.0
- Rent growth +2.6/5.0
- Condition / age +2.5/5.0
- Appreciation +0.0/10.0
$240,000
🖨 Deal sheet (PDF) 📄 Offer letter ✓ Due diligence
Listing remarks
Under contract-accepting backup offers. Completely reimagined from top to bottom! This stunning 3-bedroom brick home features brand-new upgrades throughout, including a new roof, plumbing, HVAC system, electrical panel, water heater, windows, tile flooring, and modern lighting. The versatile floor plan offers a bright living/dining combination plus a spacious family room/den—perfect for entertaining or relaxing. The fabulous kitchen shines with butcher block countertops, sleek range hood, and stylish tile backsplash. Beautifully updated bathroom finishes and a convenient inside laundry room add to the appeal. Enjoy a large yard with endless possibilities. Move-in ready and designed to
Key facts
- New plumbing
- New water heater
- New electrical panel
Tags
Property features AI
Finance
- HOA & community: No association
Exterior
- Parking: Driveway; Parking pad
- Security: Smoke detector(s)
- Utilities: Private water source; Private sewer; Electricity connected; Water connected; Sewer connected; Broadband/high-speed internet available
- Home design: Single-family residence; One story; South-facing entry; Completed condition
- Construction: Brick construction; Membrane roof; Slab foundation; Built on a 0.16-acre lot
- Exterior features: Front porch; Private mailbox; Paved asphalt road; public maintained road; Lot is in county
Interior
- Kitchen: Range; Range hood; Refrigerator; Electric water heater
- Bedrooms: 3 bedrooms
- Flooring: Ceramic tile
- Bathrooms: 1 full bathroom
- Heating & cooling: Central heating (electric); Central air conditioning
- Interior features: Living room and dining room combined; Vaulted ceilings; Smoke detectors
- Laundry & utility: Inside laundry room with washer and electric dryer hookups; Family room / inside utility
Neighborhood map
What this means for you Summary
Snapshot
- This is a 3-bed/1.0-bath single-family listed at $240k.
Deal economics
- At list price, monthly cash flow is $-25 ($-297/yr) — negative.
- To cash-flow at today's rent, offer at most $236k (1.8% below list).
- To meet the 1% rule (rent ≥ 1% of price), the offer needs to be $183k (23.6% below list).
- Recommended offer: $183k (23.6% below list) — sets the bar for 1% rule.
- Cap rate 6.2% vs local median 3.6% in Sanford — top-decile yield for the area; either an underpriced asset or a hidden risk that comps aren't pricing in. Stress-test before assuming the spread holds.
Location & tenants
- Location reads 73/100 on livability (#316 in FL) — a middle-class / working-renter tenant base. Strengths: cost of living A+, housing A+, health & safety A+; Watch: employment C-, crime F, amenities F.
- Seminole (suburban): math 57% / reading 61% proficiency, ranked #13 of 73 in FL (top 18%) — acceptable for families but not a draw, mixed tenant base, ~2y average lease.
- Zoned schools: Bentley Elementary School (math 53% / reading 60%, grade C+, #816 of 2,144 statewide, top 39%, 949 students, 68% FRL); Greenwood Lakes Middle School (math 49% / reading 55%, grade C+, #217 of 571 statewide, top 40%, 1,000 students, 63% FRL); Lake Mary High School (math 39% / reading 58%, grade D, #198 of 667 statewide, top 30%, 2,684 students, 42% FRL) — zoned schools average 58% FRL vs 38% district-wide (19 pts higher); higher-poverty schools than district average — tighter screening recommended.
- Market conditions: Rents flat; 565 active listings in the ZIP; 40 comparable units currently listed for rent nearby; rentals at typical pace (median 19d on market — plan ~3-4 weeks tenant-placement turnaround); solid renter incomes; 1,979 units permitted in Seminole County in 2024 (1,191 in 5+ unit buildings).
Forward outlook
- Local home prices are declining (-3.0%/yr); year-one equity from $2k of loan paydown is wiped out by about $7k of value loss. Plan a longer hold.
- Seminole County population projected at +24% by 2050 — long-run rental-demand tailwind backs the buy-and-hold thesis.
Negotiation context
- It's been on market 74 days — a 6% lower offer ($226k) is reasonable based on typical stale-listing flexibility.
- 3 sale attempts with the ask held roughly flat each time — persistent listings suggest the price (not the market) is what's stuck; bring a comps-based counter.
- Current owner paid $82k; list at $240k implies a 191% gain — meaningful room to come down on a strong offer.
Risks & watch-outs
- Climate carrying-cost: severe wind risk, 99% chance of damaging wind over 30y; extreme-heat days projected 7→21/yr by 2055 (HVAC capex compounding) — expect insurance premiums to compound above CPI over the hold.
Questions for the listing agent
- What do current leases actually rent for vs. the listed asking? Can we see a recent rent roll and the last 12 months of T-12 income?
- It's been on market 74 days. Have you received any prior offers? Is the seller open to a 24% concession, seller financing, or rate buy-down credit?
- Built in 1967 — when were the roof, HVAC, electrical panel, plumbing, and water heater last replaced?
- Why hasn't it sold? Are there any deal-killer items the seller is aware of (foundation, flood, title, zoning, code violations)?
- Is there a deadline driving the sale (1031 exchange, divorce, estate, relocation)? That informs how much negotiation room exists.
- Schools are B-rated — typically a magnet for longer-tenancy family renters. What's the average tenant stay here, and is there a school-zone premium baked into asking?
- Crime grade is F in this area — have there been break-ins, vandalism, or insurance claims at this property in the last 3 years? What carrier currently insures it and at what premium?
- The area grade is low — what's the realistic commute time and amenity access for the typical tenant pool here? Any planned neighborhood developments (good or bad) we should know about?
- What's the average days-on-market for RENTAL listings here right now (not sales)? A rising rental-DOM trend means longer vacancies and softer asking-rent achievability than the comps imply.
- What's the recent tenant-quality profile in this submarket — average credit score on applications, eviction rate, late-payment / NSF rate, and stable-employment percentage? A property-management company in the area should have these aggregated.
- How much new for-sale + rental construction is in the pipeline within 1–3 miles? Heavy new supply typically softens prices + rents 12–24 months out; constrained supply supports both.
Investment metrics
- 1% rule
- 0.76% ✗
- Cap rate
- 6.17%
- Cash-on-cash
- -0.44%
- DSCR
- 0.98
- GRM
- 10.9
CMA / ARV
- ARV (on-the-fly)
- $271,400
- Comps found
- 12
Show comp detail 12 sales within ~0.75 mi
| Address | Dist | Beds/Ba | Sqft | Sold | Price | $/sf | Match |
|---|---|---|---|---|---|---|---|
| 3032 Truman Blvd | 0.00mi | 3/1.0 | 1,268 (+8%) | 1mo | $237,500 | $187 | 87 |
| 136 Academy Ave | 0.48mi | 3/2.0 | 1,152 (-2%) | 0mo | $230,000 | $200 | 69 |
| 2038 Blackston Ave | 0.42mi | 3/2.0 | 1,160 (-2%) | 8mo | $235,000 | $203 | 67 |
| 135 Bob Thomas Cir | 0.38mi | 3/2.5 | 1,240 (+5%) | 2mo | $266,000 | $215 | 67 |
| 2207 Mccarthy Ave | 0.44mi | 3/2.0 | 1,107 (-6%) | 1mo | $270,000 | $244 | 65 |
| 1816 Alexander Ave | 0.24mi | 3/2.0 | 1,100 (-7%) | 10mo | $270,000 | $245 | 64 |
| 107 Academy Ave | 0.35mi | 3/1.0 | 1,021 (-14%) | 2mo | $235,000 | $230 | 60 |
| 143 Bob Thomas Cir | 0.34mi | 4/3.0 (+1) | 1,196 (+1%) | 12mo | $272,000 | $227 | 59 |
| 209 Satsuma Dr | 0.51mi | 3/2.0 | 1,089 (-8%) | 2mo | $320,000 | $294 | 57 |
| 1416 Southwest Rd | 0.68mi | 2/2.0 (-1) | 1,168 (-1%) | 1mo | $125,000 | $107 | 57 |
| 108 Academy Ave | 0.38mi | 3/2.0 | 1,301 (+10%) | 6mo | $315,000 | $242 | 57 |
| 128 Academy Ave | 0.45mi | 4/1.5 (+1) | 1,054 (-11%) | 12mo | $262,600 | $249 | 45 |
Match score weights: distance 35% · size 25% · config 20% · recency 20%. Top-matched comps best support the ARV.
Projected returns pro-forma
-3.0% appreciation · 0.38% rent growth · sell at horizon
- IRR
- -19.7%
- Equity multiple
- 0.33×
- Total profit
- $-45,261
- Equity at exit
- $35,785
- IRR
- -18.5%
- Equity multiple
- 0.11×
- Total profit
- $-60,127
- Equity at exit
- $20,751
Cash invested: $67,200 (down + closing). Projections, not guarantees.
Landlord ↔ Tenant lean methodology
- Overall (STATE)
- 87 Strongly Landlord-Friendly
- State Florida
- 87 Strongly Landlord-Friendly · R+3
- County
- — inherits STATE
- City
- — inherits STATE
ZIP-level market 32771
- Rents YoY
- 0.4%
- Active inventory
- 565
- Price-to-rent
- 10.9×
Monthly cashflow live
- Estimated rent
- $1,833 high interval (Pro) →
- Mortgage (P&I)
- −$1,259
- Tax from tax record
- −$114 /mo · $1,370/yr
- Insurance
- −$100
- HOA
- −$0
- Vacancy / Maint / Mgmt
- −$385
- Net cashflow
- $-25
Break-even live
Sensitivity live
| Price | -10% $111 | -5% $43 | +0% $-25 | +5% $-93 | +10% $-161 |
|---|---|---|---|---|---|
| Rent | -10% $-170 | -5% $-97 | +0% $-25 | +5% $48 | +10% $120 |
| Rate | -1.0pp $96 | -0.5pp $36 | base $-25 | +0.5pp $-87 | +1.0pp $-150 |
UW: 25.0% down · 7.5% · 30yr · 1.5% tax · 5.0% vac · 8.0% maint · 8.0% mgmt
Financing live
Cash to close
- Down payment
- $60,000
- Closing costs
- $7,200
- Reserves months
- —
- Total cash needed
- —
Loan-product check · same deal, 3 products live
Conventional
25% down · 7.5% · 30yr
- Down + closing
- —
- Monthly P&I
- —
- Monthly cashflow
- —
- DSCR
- —
- Eligible?
- —
Personal DTI + credit; lowest rate.
DSCR
20% down · 8.5% · 30yr
- Down + closing
- —
- Monthly P&I
- —
- Monthly cashflow
- —
- DSCR
- —
- Eligible?
- —
No personal income docs; deal must DSCR.
Hard money
10% down · 12.0% · 12mo
- Down + closing
- —
- Monthly P&I
- —
- Monthly cashflow
- —
- DSCR
- —
- Eligible?
- —
Short-term bridge; refi at stabilization.
Rent comps 40 comps
| Address | Beds | Baths | Sqft | Rent | $/sqft | DOM | Units | Dist |
|---|---|---|---|---|---|---|---|---|
| 2015 Jones Ave Sanford, FL | 3.0 | 1.5 | 1291 | $1,895 | $1.47 | 14d | 1 | 0.20mi |
| 2735 Bungalow Blvd Sanford, FL | 2.0 | 1.0 | 700 | $1,025 | $1.46 | 0d | 1 | 0.47mi |
| 2735 Bungalow Blvd Sanford, FL | 2.0 | 1.0 | 700 | $1,025 | $1.46 | 6d | 1 | 0.47mi |
| 1935 W 14th St Sanford, FL | 3.0 | 1.5 | 1112 | $1,900 | $1.71 | 4d | 1 | 0.75mi |
| 1908 W 16th St Sanford, FL | 3.0 | 2.0 | 1100 | $1,500 | $1.36 | 22d | 1 | 0.75mi |
| 100 Windchase Blvd Sanford, FL | 1.0–3.0 | 1.0–2.0 | 957 | $1,695 | $1.77 | 4d | 1 | 0.85mi |
| 2630 Cahill Way Lake Mary, FL | 3.0 | 2.0 | 1496 | $2,330 | $1.56 | 19d | 1 | 0.90mi |
| 1132 S Pine Ridge Cir Unit 108 Sanford, FL | 2.0 | 2.0 | 800 | $1,370 | $1.71 | 25d | 1 | 0.99mi |
| 1134 S Pine Ridge Cir Unit 1134 Sanford, FL | 2.0 | 2.0 | 800 | $1,450 | $1.81 | 25d | 1 | 0.99mi |
| 1320 S Oleander Ave Sanford, FL | 3.0 | 2.0 | 1200 | $1,850 | $1.54 | 25d | 1 | 1.00mi |
| 1512 S Pine Ridge Cir Sanford, FL | 2.0 | 2.0 | 1025 | $1,550 | $1.51 | 25d | 1 | 1.00mi |
| 1515 S Oleander Ave Sanford, FL | 2.0 | 2.0 | 1100 | $1,500 | $1.36 | 25d | 1 | 1.00mi |
| 2995 Railside Loop Sanford, FL | 1.0–3.0 | 1.0–2.0 | 961 | $2,458 | $2.56 | 6d | 21 | 1.02mi |
| 2995 Railside Loop Sanford, FL | 1.0–2.0 | 1.0–2.0 | 938 | $3,702 | $3.95 | 0d | 10 | 1.02mi |
| 1324 S Pine Ridge Cir Unit D2 Sanford, FL | 2.0 | 2.0 | 1025 | $1,690 | $1.65 | 25d | 1 | 1.03mi |
| 1122 S Pine Ridge Cir #1122 Sanford, FL | 2.0 | 2.0 | 800 | $1,300 | $1.62 | 25d | 1 | 1.03mi |
| 1114 S Pine Ridge Cir #14 Sanford, FL | 2.0 | 2.0 | 800 | $1,300 | $1.62 | 16d | 1 | 1.04mi |
| 1114 S Pine Ridge Cir Unit D1 Sanford, FL | 2.0 | 2.0 | 800 | $1,300 | $1.62 | 23d | 1 | 1.04mi |
| 1223 S Pine Ridge Cir #23 Sanford, FL | 2.0 | 2.0 | 975 | $1,575 | $1.62 | 4d | 1 | 1.04mi |
| 106 Garrison Dr Sanford, FL | 3.0 | 2.0 | 1080 | $1,895 | $1.75 | 6d | 1 | 1.04mi |
| 107 Garrison Dr Sanford, FL | 3.0 | 2.0 | 1439 | $1,800 | $1.25 | 19d | 1 | 1.08mi |
| 365 Placid Lake Dr Unit Lo Sanford, FL | 3.0 | 2.0 | 1158 | $1,900 | $1.64 | 19d | 1 | 1.11mi |
| 331 Placid Lake Dr Sanford, FL | 3.0 | 2.0 | 1292 | $1,960 | $1.52 | 22d | 1 | 1.16mi |
| 7021 Kirkland Way Lake Mary, FL | 2.0 | 2.0 | 1020 | $1,850 | $1.81 | 6d | 1 | 1.17mi |
| 153 Cape Honeysuckle Pl Sanford, FL | 3.0 | 2.5 | 1380 | $2,395 | $1.74 | 25d | 1 | 1.22mi |
| 2511 Ridgewood Ave Sanford, FL | 2.0 | 1.0 | 1000 | $1,395 | $1.40 | 25d | 1 | 1.24mi |
| 3036 Dellcrest Pl Lake Mary, FL | 3.0 | 2.0 | 1369 | $2,200 | $1.61 | 18d | 1 | 1.25mi |
| 1505 W 25th St Sanford, FL | 3.0 | 2.0 | 1150 | $1,753 | $1.52 | 14d | 1 | 1.26mi |
| 2450 Hartwell Ave Sanford, FL | 2.0 | 2.0 | 784 | $1,400 | $1.79 | 25d | 1 | 1.26mi |
| 2450 Hartwell Ave Sanford, FL | 2.0 | 2.0 | 784 | $1,400 | $1.79 | 14d | 1 | 1.26mi |
| 2450 Hartwell Ave Sanford, FL | 2.0 | 2.0 | 784 | $1,400 | $1.79 | 19d | 1 | 1.26mi |
| 1704 Ridgewood Ln Sanford, FL | 2.0 | 1.0 | 837 | $1,350 | $1.61 | 25d | 1 | 1.30mi |
| 2539 Ridgewood Ave Sanford, FL | 2.0 | 2.0 | 816 | $1,095 | $1.34 | 22d | 1 | 1.30mi |
| 110 Yorktown Pl Sanford, FL | 3.0 | 2.0 | 1281 | $2,319 | $1.81 | 6d | 1 | 1.35mi |
| 2008 William Clark Ave Sanford, FL | 3.0 | 2.0 | 1328 | $2,199 | $1.66 | 4d | 1 | 1.38mi |
| 2714 Ridgewood Ave Sanford, FL | 1.0–2.0 | 1.0–2.0 | 987 | $1,650 | $1.67 | 0d | 6 | 1.39mi |
| 2405 Chase Ave Sanford, FL | 3.0 | 2.0 | 1200 | $2,095 | $1.75 | 16d | 1 | 1.40mi |
| 2441 Marshall Ave Sanford, FL | 3.0 | 2.0 | 1462 | $2,235 | $1.53 | 6d | 1 | 1.41mi |
| 2912 Woodlands Park Ct Lake Mary, FL | 2.0 | 2.5 | 1095 | $1,780 | $1.63 | 25d | 1 | 1.42mi |
| 105 Cobblestone Way Sanford, FL | 3.0 | 2.0 | 1314 | $1,975 | $1.50 | 25d | 1 | 1.42mi |
Listing history 8 events
-
2026-05-13status Pending
-
2026-04-14status Active
-
2026-04-12status Pending
-
2026-03-08status Active
-
2026-03-06status Pending
-
2026-02-25$240,000 Active
-
2025-03-27soldstatus $82,500
-
2007-01-25soldstatus $115,000
ⓘ Source: listings_history table (triggers on properties + properties_extension) + one-shot
backfill from property_details.listing_events for pre-trigger history.
Tax reassessment forecast FL · Resets to sale price
- Current annual tax
- $1,370 · $114/mo
- Projected year-2 tax
- $1,992 · $166/mo
- Expected delta
- +$622/yr (+$52/mo · 45.4%)
ⓘ Screening estimate from a state-policy table — verify with the county assessor before closing.
Climate risk First Street
- Flood 4/10 Moderate FEMA zone X (unshaded) · 20% chance over 30 yrs
- Wildfire 1/10 Low
- Heat 8/10 Severe 7 d/yr ≥107°F today · 21 d/yr by 30 yrs out
- Wind 9/10 Extreme 99% chance of damaging wind over 30 yrs
- Air quality 2/10 Low 1 unhealthy d/yr today · 1 by 30 yrs out
Nearby sold comps map
Loading sold comps map…
Walkable amenities ~0.75 mi
Loading nearby amenities…
Taxation est. · year 1
- Rental income
- $21,995
- − Mortgage interest
- −$13,444
- − Property taxes
- −$1,370
- − Insurance
- −$1,200
- − Repairs & maintenance
- −$1,760
- − Management
- −$1,760
- − Depreciation
- −$6,982
- Taxable loss
- −$4,520
- Est. tax savings @ 24.0%
- +$1,085
- After-tax cash flow
- $788/yr
For passive investors: Depreciation is non-cash, so a rental often shows a tax loss while cash-flowing — sheltering income. Rental losses are passive: they offset passive income freely, and up to $25,000/yr can offset ordinary (W-2) income if you actively participate and your MAGI is under $100k (phasing out to $0 by $150k); unused losses carry forward. On sale, claimed depreciation is recaptured at up to 25%, and gains may owe capital-gains tax (a 1031 exchange can defer both). Figures are a year-1 estimate at your 24.0% rate — not tax advice; consult a CPA.
Schools (NCES district)
- District
- Seminole
- NCES district ID
- 1201710
- Math proficiency
- 57% ▼ -7.00%
- Reading proficiency
- 61% ▼ -1.00%
- Median HH income
- $58,478
- Composite
- 51.05/100
- National rank
- #1769
- State rank
- #13 of 73 in FL
Livability — Sanford
- Score
- 73/100
- State rank
- #316
- US rank
- #5359
Category grades
Schools grade is shown separately in the Schools card above.
Census & demographics
- County
- Seminole County · 436,154 people
- City population
- 96,638
- Metro
- Orlando-Kissimmee-Sanford, FL
- Population (ZIP)
- 62,606
- Household income
- $77,868
- Rent vs Own
- Severe rent burden
- 2645.0
Population outlook (Seminole County) Hauer SSP2
- Today (2025)
- 515,494 people
- By 2030
- 545,713 · +5.9%
- By 2040
- 598,068 · +16.0%
- By 2050
- 640,663 · +24.3%
- By 2075
- 724,461 · +40.5%
- By 2100
- 755,530 · +46.6%
Race, ethnicity, and origin ACS 2023
- Neighborhood character
- Diverse neighborhood (Simpson 0.70)
- Race & ethnicity
- White 43% Black 24% Hispanic / Latino 23% Two or more races 13% Asian 7%
- Hispanic origin (detail)
- Mexican 2% Puerto Rican 7% Cuban 2% Dominican 2%
- Common ancestry
- Romanian 2% Slovak 1% Italian 1%
- Foreign-born
- 18% · Canada, Jamaica, China
- Languages at home
- 76% English-only · Spanish 15% Other Indo-European 3% Other Asian/Pacific 1%
Political lean MEDSL · Seminole
- 2024 margin
- Toss-up / Even · D 47.6% · R 51.1% · Other 1.3%
- 2008→2024 swing
- -0.8pp no change · 2008: -2.8pp · 2024: -3.5pp
- All cycles
- 2024: R+3.5 2020: D+2.8 2016: R+1.6 2012: R+6.5 2008: R+2.8
Not yet ingested
- Civics
- —
Market trends
- HPI YoY
- ▼ -281.27%
- Current HPI
- 299.2738
- Rent YoY
- ▲ 0.38%
- Metro
- Orlando-Kissimmee-Sanford, FL
- State GDP YoY
- ▲ 3.28%
- F500 in state
- 36
Industry mix (Fortune 500 HQ in FL)
| Industry | F500 HQs | Revenue |
|---|---|---|
| Industrial Technology | 2 | $29B |
|
||
| Insurance | 2 | $17B |
|
||
| Retail | 1 | $60B |
|
||
| Technology Distribution | 1 | $58B |
|
||
| Homebuilding | 1 | $35B |
|
||
| Technology Manufacturing | 1 | $35B |
|
||
Price history
+108.7% since first listed8 events — show timeline
- 2026-05-13 Pending — Stellar MLS as Distributed by MLS Grid
- 2026-04-14 Relisted — Stellar MLS as Distributed by MLS Grid
- 2026-04-12 Pending — Stellar MLS as Distributed by MLS Grid
- 2026-03-08 Relisted — Stellar MLS as Distributed by MLS Grid
- 2026-03-06 Pending — Stellar MLS as Distributed by MLS Grid
- 2026-02-25 Listed $240,000 Stellar MLS as Distributed by MLS Grid
- 2025-03-27 Sold (Public Records) $82,500 Public Records
- 2007-01-25 Sold (Public Records) $115,000 Public Records
Property tax history
+6.4%/yrLatest (2025): $1,370 · -13.9% YoY. Source: county tax records.
Cash-flow waterfall
monthlySold comps — $/sqft
last 12 mo · ≤1 miLoading sold comps…