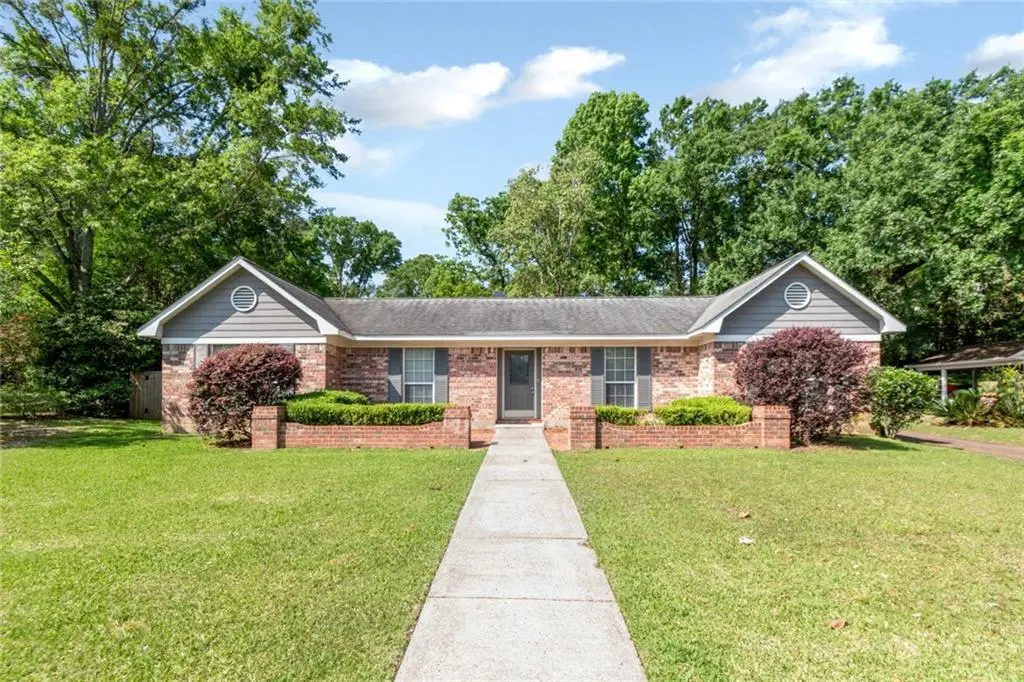
1216 Edinburgh Ct · Mobile, AL
Flood risk 6/10 · Moderate
- FEMA flood zone
- X (unshaded)
- Chance of flooding over 30 yrs
- 0.71%
- Est. flood insurance / yr
- $507 – $1,088
Fire risk 1/10 · Minimal
- Est. fire insurance / yr
- $916 – $1,700
Heat risk 9/10 · Severe
- Hot days now (above 105°F)
- 7 days/yr
- Hot days in 30 yrs
- 21 days/yr
Wind risk 9/10 · Severe
- Chance of severe wind over 30 yrs
- 99.0%
Air-quality risk 1/10 · Minimal
- Unhealthy air days now
- 0 days/yr
- Unhealthy air days in 30 yrs
- 0 days/yr
Risk factors via First Street. Map © Google.
Why this score? — see what drove the D grade
The composite is a weighted blend of 9 inputs, each scored 0–100. Each bar is that input's sub-score; the figure is the points it added to the 100-point composite (weight × sub-score).
- ARV discount +14.8/15.0
- Cash flow +10.8/30.0
- Livability +3.8/5.0
- Rent growth +3.3/5.0
- DSCR +3.1/10.0
- Condition / age +2.5/5.0
- Schools +2.3/10.0
- 1% rule +1.8/10.0
- Appreciation +0.0/10.0
$267,500
🖨 Deal sheet (PDF) 📄 Offer letter ✓ Due diligence
Listing remarks
A Find with a POOL!! Beautiful location in Regency on a quiet cul de sac. This home has been loved for years and does need some updating of the interior. The pool is a treasure - very, very private with open brick lined patio areas as well as a shaded deck for entertaining. The home has four very generous sized bedrooms and two and a half baths. There are two separate family areas as well as a game room off the master. and many more custom touches throughout.
Key facts
- Shaded deck
- Private
- Game room
Tags
Property features AI
Finance
- HOA & community: Located in the Gleneagles subdivision
Exterior
- Parking: No dedicated parking
- Utilities: Water available; Public sewer; Electric service: other
- Home design: Single-family residence; Residential property
- Construction: Brick (four sides) construction; Shingle roof; Built in 1983; Slab foundation
- Exterior features: Back yard fencing; Other exterior features; Property has a view; In-ground fenced pool
Interior
- Kitchen: Dishwasher; Electric range
- Bedrooms: 3 bedrooms
- Flooring: Carpet
- Bathrooms: 2 full bathrooms; 1 half bathroom
- Heating & cooling: Central heating; Central air conditioning
- Interior features: Cathedral ceilings; Fireplace in the family room
Neighborhood map
What this means for you Summary
Snapshot
- This is a 3-bed/2.5-bath single-family listed at $268k.
Deal economics
- At list price, monthly cash flow is $-125 ($-1k/yr) — negative.
- To cash-flow at today's rent, offer at most $246k (8.2% below list).
- To meet the 1% rule (rent ≥ 1% of price), the offer needs to be $183k (31.5% below list).
- Recommended offer: $183k (31.5% below list) — sets the bar for 1% rule.
Location & tenants
- Location reads 75/100 on livability (#20 in AL, #4,262 nationally) — a middle-class / working-renter tenant base. Strengths: commute A+, cost of living A+, housing A+; Watch: crime F, employment D-.
- Mobile County (urban): math 15% / reading 39% proficiency, ranked #81 of 129 in AL (top 63%) — low school quality limits family demand, transient renter base, plan for 1-2y turnover; 67% free/reduced lunch — lower-income household profile, screen leases tightly.
- Zoned schools: Er Dickson Elementary School (math 12% / reading 40%, grade F, #409 of 627 statewide, top 65%, 1,038 students, 67% FRL); Denton Magnet School of Technology (math 26% / reading 69%, grade C-, #32 of 257 statewide, top 12%, 314 students, 94% FRL); Wp Davidson High School (math 36% / reading 41%, grade F, #37 of 305 statewide, top 12%, 1,535 students, 61% FRL).
- Market conditions: Rents rising (+3.1%/yr); 145 active listings in the ZIP; 12 comparable units currently listed for rent nearby; rentals at typical pace (median 23d on market — plan ~3-4 weeks tenant-placement turnaround); 42% of comp listings sitting > 30 days — soft ceiling on asking rent; 1,678 units permitted in Mobile County in 2024 (264 in 5+ unit buildings).
- This rent runs 44% of the median local income ($50k/yr) — at the standard rent-burdened threshold; future hikes will face affordability resistance.
Forward outlook
- Local home prices are declining (-3.0%/yr); year-one equity from $2k of loan paydown is wiped out by about $8k of value loss. Plan a longer hold.
- Mobile County population projected to shrink 8% by 2050 — rents likely to lag national; underwrite the cash flow, not the appreciation.
Negotiation context
- It's been on market 38 days — a 3% lower offer ($259k) is reasonable based on typical stale-listing flexibility.
Risks & watch-outs
- Climate carrying-cost: major flood risk; severe wind risk, 99% chance of damaging wind over 30y; extreme-heat days projected 7→21/yr by 2055 (HVAC capex compounding) — expect insurance premiums to compound above CPI over the hold.
Questions for the listing agent
- What do current leases actually rent for vs. the listed asking? Can we see a recent rent roll and the last 12 months of T-12 income?
- It's been on market 38 days. Have you received any prior offers? Is the seller open to a 32% concession, seller financing, or rate buy-down credit?
- Is there a deadline driving the sale (1031 exchange, divorce, estate, relocation)? That informs how much negotiation room exists.
- Schools are D-rated, which usually means shorter tenancies and higher turnover. Who's the typical renter profile here, and what's been the actual vacancy rate?
- Crime grade is F in this area — have there been break-ins, vandalism, or insurance claims at this property in the last 3 years? What carrier currently insures it and at what premium?
- The area grade is low — what's the realistic commute time and amenity access for the typical tenant pool here? Any planned neighborhood developments (good or bad) we should know about?
- What's the average days-on-market for RENTAL listings here right now (not sales)? A rising rental-DOM trend means longer vacancies and softer asking-rent achievability than the comps imply.
- What's the recent tenant-quality profile in this submarket — average credit score on applications, eviction rate, late-payment / NSF rate, and stable-employment percentage? A property-management company in the area should have these aggregated.
- How much new for-sale + rental construction is in the pipeline within 1–3 miles? Heavy new supply typically softens prices + rents 12–24 months out; constrained supply supports both.
Investment metrics
- 1% rule
- 0.68% ✗
- Cap rate
- 5.73%
- Cash-on-cash
- -1.99%
- DSCR
- 0.91
- GRM
- 12.2
CMA / ARV
- ARV (median comp)
- $319,279
- List price
- $267,500
- Delta
- -16.22%
- Verdict
- UNDERPRICED
- Comps
- 20 within 1.0 mi
Show comp detail 12 sales within ~0.75 mi
| Address | Dist | Beds/Ba | Sqft | Sold | Price | $/sf | Match |
|---|---|---|---|---|---|---|---|
| 1213 Edinburgh Ct | 0.05mi | 3/2.5 | 2,072 (+6%) | 8mo | $310,000 | $150 | 80 |
| 1201 Edinburgh Ct | 0.09mi | 4/2.0 (+1) | 1,847 (-5%) | 4mo | $320,000 | $173 | 76 |
| 1056 Cross Gates Pl | 0.16mi | 3/2.0 | 2,071 (+6%) | 8mo | $285,000 | $138 | 73 |
| 1459 Fern Valley Rd | 0.36mi | 4/2.0 (+1) | 1,916 (-2%) | 2mo | $258,000 | $135 | 72 |
| 1106 Wildwood Ave | 0.55mi | 3/2.5 | 2,041 (+5%) | 2mo | $275,500 | $135 | 65 |
| 1500 Fern Valley Rd | 0.41mi | 3/2.0 | 1,863 (-4%) | 10mo | $249,900 | $134 | 63 |
| 6140 Louise Pl E | 0.75mi | 3/2.0 | 1,949 (+0%) | 2mo | $319,900 | $164 | 62 |
| 1052 Linlen Ave | 0.48mi | 3/2.0 | 1,741 (-11%) | 1mo | $269,000 | $155 | 57 |
| 407 Ridgecrest Ct | 0.46mi | 3/3.0 | 1,729 (-11%) | 2mo | $200,000 | $116 | 56 |
| 1054 Linlen Ave | 0.48mi | 3/2.0 | 1,778 (-9%) | 7mo | $260,000 | $146 | 56 |
| 955 Linlen Ave | 0.55mi | 3/2.0 | 1,732 (-11%) | 4mo | $265,000 | $153 | 50 |
| 309 Byron Ave W | 0.62mi | 4/2.0 (+1) | 1,798 (-8%) | 4mo | $158,000 | $88 | 48 |
Match score weights: distance 35% · size 25% · config 20% · recency 20%. Top-matched comps best support the ARV.
Projected returns pro-forma
-3.0% appreciation · 3.07% rent growth · sell at horizon
- IRR
- -19.6%
- Equity multiple
- 0.32×
- Total profit
- $-51,290
- Equity at exit
- $39,885
- IRR
- -12.4%
- Equity multiple
- 0.27×
- Total profit
- $-54,921
- Equity at exit
- $23,129
Cash invested: $74,900 (down + closing). Projections, not guarantees.
Landlord ↔ Tenant lean methodology
- Overall (STATE)
- 90 Strongly Landlord-Friendly
- State Alabama
- 90 Strongly Landlord-Friendly · R+15
- County
- — inherits STATE
- City
- — inherits STATE
ZIP-level market 36609
- Rents YoY
- 3.1%
- Active inventory
- 145
- Price-to-rent
- 12.2×
Monthly cashflow live
- Estimated rent
- $1,832 high interval (Pro) →
- Mortgage (P&I)
- −$1,403
- Tax from tax record
- −$57 /mo · $689/yr
- Insurance
- −$111
- HOA
- −$0
- Vacancy / Maint / Mgmt
- −$385
- Net cashflow
- $-125
Break-even live
Sensitivity live
| Price | -10% $27 | -5% $-49 | +0% $-125 | +5% $-200 | +10% $-276 |
|---|---|---|---|---|---|
| Rent | -10% $-269 | -5% $-197 | +0% $-125 | +5% $-52 | +10% $20 |
| Rate | -1.0pp $10 | -0.5pp $-56 | base $-125 | +0.5pp $-194 | +1.0pp $-264 |
UW: 25.0% down · 7.5% · 30yr · 1.5% tax · 5.0% vac · 8.0% maint · 8.0% mgmt
Financing live
Cash to close
- Down payment
- $66,875
- Closing costs
- $8,025
- Reserves months
- —
- Total cash needed
- —
Loan-product check · same deal, 3 products live
Conventional
25% down · 7.5% · 30yr
- Down + closing
- —
- Monthly P&I
- —
- Monthly cashflow
- —
- DSCR
- —
- Eligible?
- —
Personal DTI + credit; lowest rate.
DSCR
20% down · 8.5% · 30yr
- Down + closing
- —
- Monthly P&I
- —
- Monthly cashflow
- —
- DSCR
- —
- Eligible?
- —
No personal income docs; deal must DSCR.
Hard money
10% down · 12.0% · 12mo
- Down + closing
- —
- Monthly P&I
- —
- Monthly cashflow
- —
- DSCR
- —
- Eligible?
- —
Short-term bridge; refi at stabilization.
Rent comps 12 comps
| Address | Beds | Baths | Sqft | Rent | $/sqft | DOM | Units | Dist |
|---|---|---|---|---|---|---|---|---|
| 5900 Grelot Rd Mobile, AL | 2.0 | 2.0–2.5 | 1259 | $1,600 | $1.27 | 15d | 2 | 0.36mi |
| 1056 Linlen Ave Mobile, AL | 3.0 | 3.0 | 1975 | $2,300 | $1.16 | 45d | 1 | 0.46mi |
| 424 Byron Ave E Mobile, AL | 4.0 | 2.0 | 1917 | $2,500 | $1.30 | 23d | 1 | 0.50mi |
| 5155 Ridgedale Rd Mobile, AL | 3.0 | 1.5 | 1263 | $1,400 | $1.11 | 15d | 1 | 0.79mi |
| 4306 Via Alta Dr Mobile, AL | 3.0 | 2.0 | 1640 | $1,600 | $0.98 | 45d | 1 | 0.81mi |
| 1724 Rustic Wood Ct Mobile, AL | 3.0 | 2.0 | 1607 | $1,850 | $1.15 | 45d | 1 | 0.85mi |
| 5901 Ole Mill Rd Mobile, AL | 3.0 | 2.0 | 1600 | $1,900 | $1.19 | 45d | 1 | 0.94mi |
| 1601 Hillcrest Rd Mobile, AL | 2.0 | 2.0 | 1250 | $1,603 | $1.28 | 15d | 1 | 1.00mi |
| 713 Raines Dr Mobile, AL | 4.0 | 2.0 | 1600 | $1,858 | $1.16 | 15d | 1 | 1.25mi |
| 4077 Lancewood Dr S Mobile, AL | 4.0 | 1.0 | 1283 | $1,600 | $1.25 | 45d | 1 | 1.25mi |
| 315 Bomar Pl Mobile, AL | 3.0 | 2.0 | 1632 | $1,850 | $1.13 | 15d | 1 | 1.30mi |
| 6605 Chimney Top Dr S Mobile, AL | 4.0 | 2.5 | 2400 | $2,500 | $1.04 | 23d | 1 | 1.36mi |
Listing history 8 events
-
2026-06-07statusdays on market $267,500 Pending 38 DOM
-
2026-06-05days on market $267,500 Active 37 DOM
-
2026-06-03days on market $267,500 Active 36 DOM
-
2026-06-02days on market $267,500 Active 35 DOM
-
2026-06-01days on market $267,500 Active 34 DOM
-
2026-05-31days on market $267,500 Active 33 DOM
-
2026-05-30days on market $267,500 Active 32 DOM
-
2026-04-28$267,500 Active 468-char remark
ⓘ Source: listings_history table (triggers on properties + properties_extension) + one-shot
backfill from property_details.listing_events for pre-trigger history.
Tax reassessment forecast AL · Resets to sale price
- Current annual tax
- $689 · $57/mo
- Projected year-2 tax
- $1,097 · $91/mo
- Expected delta
- +$407/yr (+$34/mo · 59.1%)
ⓘ Screening estimate from a state-policy table — verify with the county assessor before closing.
Climate risk First Street
- Flood 6/10 Major FEMA zone X (unshaded) · 71% chance over 30 yrs
- Wildfire 1/10 Low
- Heat 9/10 Extreme 7 d/yr ≥105°F today · 21 d/yr by 30 yrs out
- Wind 9/10 Extreme 99% chance of damaging wind over 30 yrs
- Air quality 1/10 Low 0 unhealthy d/yr today · 0 by 30 yrs out
Nearby sold comps map
Loading sold comps map…
Walkable amenities ~0.75 mi
Loading nearby amenities…
Taxation est. · year 1
- Rental income
- $21,983
- − Mortgage interest
- −$14,984
- − Property taxes
- −$689
- − Insurance
- −$1,338
- − Repairs & maintenance
- −$1,759
- − Management
- −$1,759
- − Depreciation
- −$7,782
- Taxable loss
- −$6,327
- Est. tax savings @ 24.0%
- +$1,519
- After-tax cash flow
- $25/yr
For passive investors: Depreciation is non-cash, so a rental often shows a tax loss while cash-flowing — sheltering income. Rental losses are passive: they offset passive income freely, and up to $25,000/yr can offset ordinary (W-2) income if you actively participate and your MAGI is under $100k (phasing out to $0 by $150k); unused losses carry forward. On sale, claimed depreciation is recaptured at up to 25%, and gains may owe capital-gains tax (a 1031 exchange can defer both). Figures are a year-1 estimate at your 24.0% rate — not tax advice; consult a CPA.
Schools (NCES district)
- District
- Mobile County
- NCES district ID
- 0102370
- Math proficiency
- 15% ▼ -28.00%
- Reading proficiency
- 39% ▬ 0.00%
- Median HH income
- $42,455
- Composite
- 22.9/100
- National rank
- #8002
- State rank
- #81 of 129 in AL
Livability — Mobile
- Score
- 75/100
- State rank
- #20
- US rank
- #4262
Category grades
Schools grade is shown separately in the Schools card above.
Census & demographics
- Census place
- Mobile, AL
- County
- Mobile County · 246,577 people
- City population
- 205,729
- Metro
- Mobile, AL
- Population (ZIP)
- 23,820
- Household income
- $49,830
- Rent vs Own
- Severe rent burden
- 1379.0
Population outlook (Mobile County) Hauer SSP2
- Today (2025)
- 415,303 people
- By 2030
- 411,755 · -0.9%
- By 2040
- 399,670 · -3.8%
- By 2050
- 382,616 · -7.9%
- By 2075
- 337,353 · -18.8%
- By 2100
- 283,391 · -31.8%
Race, ethnicity, and origin ACS 2023
- Neighborhood character
- Diverse neighborhood (Simpson 0.62)
- Race & ethnicity
- Black 44% White 42% Two or more races 6% Hispanic / Latino 5% Asian 5%
- Common ancestry
- Lithuanian 3% Slovak 2% Italian 2%
- Foreign-born
- 6% · Canada, Vietnam, China
- Languages at home
- 93% English-only · Spanish 2% Vietnamese 2% Other Indo-European 1%
Political lean MEDSL · Mobile
- 2024 margin
- R (+16.4) · D 41.3% · R 57.7%
- 2008→2024 swing
- -7.7pp toward R · 2008: -8.7pp · 2024: -16.4pp
- All cycles
- 2024: R+16.4 2020: R+11.9 2016: R+13.9 2012: R+9.3 2008: R+8.7
Not yet ingested
- Civics
- —
Market trends
- HPI YoY
- ▼ -124.06%
- Current HPI
- 200.0811
- Rent YoY
- ▲ 3.07%
- Metro
- Mobile, AL
- State GDP YoY
- ▲ 2.94%
- F500 in state
- 4
Industry mix (Fortune 500 HQ in AL)
| Industry | F500 HQs | Revenue |
|---|---|---|
| Financial Services | 1 | $8B |
|
||
| Healthcare | 1 | $5B |
|
||
Price history
2 events — show timeline
- 2026-06-05 Pending — GCMLS AL
- 2026-04-28 Listed $267,500 GCMLS AL
Property tax history
-6.7%/yrLatest (2017): $689 · -3.7% YoY. Source: county tax records.
Cash-flow waterfall
monthlySold comps — $/sqft
last 12 mo · ≤1 miLoading sold comps…