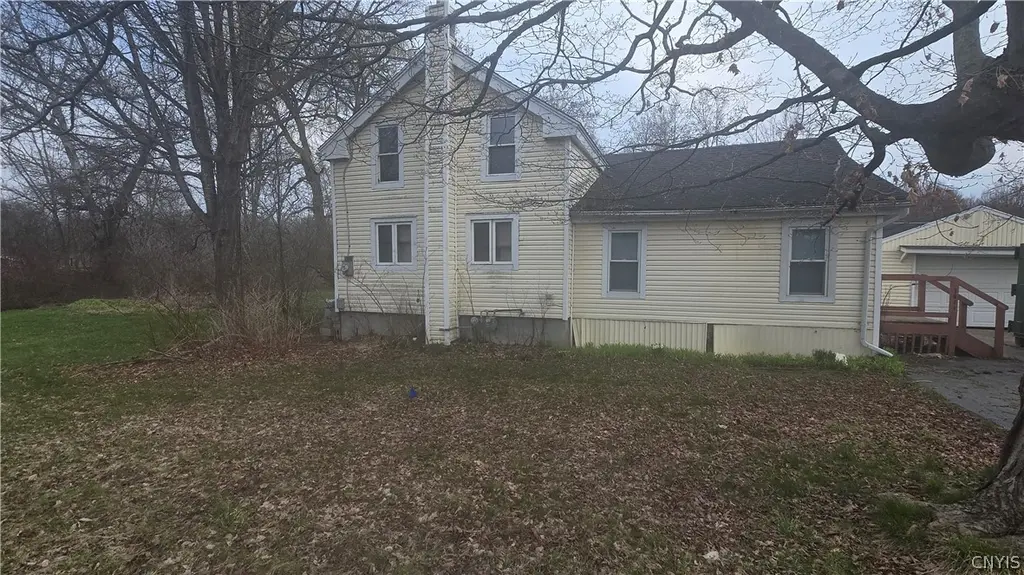
7821 Bull St · Bridgeport, NY
Flood risk 1/10 · Minimal
- FEMA flood zone
- X (unshaded)
- Chance of flooding over 30 yrs
- 0.0%
- Est. flood insurance / yr
- $507 – $1,088
Fire risk 2/10 · Minimal
- Est. fire insurance / yr
- $691 – $1,283
Heat risk 3/10 · Minor
- Hot days now (above 95°F)
- 7 days/yr
- Hot days in 30 yrs
- 16 days/yr
Wind risk 1/10 · Minimal
- Chance of severe wind over 30 yrs
- —
Air-quality risk 2/10 · Minimal
- Unhealthy air days now
- 1 days/yr
- Unhealthy air days in 30 yrs
- 2 days/yr
Risk factors via First Street. Map © Google.
Why this score? — see what drove the C+ grade
The composite is a weighted blend of 9 inputs, each scored 0–100. Each bar is that input's sub-score; the figure is the points it added to the 100-point composite (weight × sub-score).
- Cash flow +25.7/30.0
- 1% rule +9.0/10.0
- DSCR +8.6/10.0
- ARV discount +7.5/15.0
- Schools +4.2/10.0
- Livability +3.3/5.0
- Rent growth +2.5/5.0
- Condition / age +2.5/5.0
- Appreciation +0.6/10.0
$99,000
🖨 Deal sheet (PDF) 📄 Offer letter ✓ Due diligence
Listing remarks MLS
home features 4-bedrooms 1 full bath with large deep lot. Home will need updates and some work. 1 car garage. Home has country feel. Would make a great rental or flip. Home has 2 lots 66 wide X 305 Deep. For total of 112 x 305. NO Survey Provided. Will need work to pass loan. Heat is off but works. Public water off but hooked up. Some broke water lines in basement. Sold As-IS to settle estate. All offers must have proof of funds and signed addendums. CNS Schools.
Key facts
- 0.46 acre lot
- Garage
- Built 1925
Neighborhood map
What this means for you Summary
Snapshot
- This is a 4-bed/1.0-bath single-family listed at $99k.
Deal economics
- At list price, monthly cash flow is $237 ($3k/yr) — positive.
- The deal already cash-flows at list — no discount required.
- Meets the 1% rule at list price ($1k rent vs $99k).
- Recommended offer: $96k (3.0% below list) — sets the bar for market timing.
- Cap rate 9.2% vs local median 2.3% in Bridgeport — top-decile yield for the area; either an underpriced asset or a hidden risk that comps aren't pricing in. Stress-test before assuming the spread holds.
Location & tenants
- Location reads 66/100 on livability (#655 in NY) — a middle-class / working-renter tenant base. Strengths: cost of living A+, housing A+, crime A-; Watch: schools C-, amenities F, commute F.
- North Syracuse Central School District (suburban): math 45% / reading 50% proficiency, ranked #402 of 590 in NY (top 68%) — families likely to look elsewhere, expect single-tenant / working-renter base with shorter leases.
- Market conditions: 46 active listings in the ZIP; 616 units permitted in Onondaga County in 2024 (256 in 5+ unit buildings).
Forward outlook
- Local home prices are declining (-3.0%/yr); year-one equity from $684 of loan paydown is wiped out by about $3k of value loss. Plan a longer hold.
- Onondaga County population projected to shrink 9% by 2050 — rents likely to lag national; underwrite the cash flow, not the appreciation.
Negotiation context
- It's been on market 35 days — a 3% lower offer ($96k) is reasonable based on typical stale-listing flexibility.
Risks & watch-outs
- Watch-outs: property tax is 3.6% of price; built in 1925 — expect roof / HVAC / electrical / plumbing capex.
Questions for the listing agent
- It's been on market 35 days. Have you received any prior offers? Is the seller open to a 3% concession, seller financing, or rate buy-down credit?
- Built in 1925 — when were the roof, HVAC, electrical panel, plumbing, and water heater last replaced?
- Property tax is high relative to price — has the assessment been appealed recently, and will the sale trigger a re-assessment?
- Is there a deadline driving the sale (1031 exchange, divorce, estate, relocation)? That informs how much negotiation room exists.
- What's the average days-on-market for RENTAL listings here right now (not sales)? A rising rental-DOM trend means longer vacancies and softer asking-rent achievability than the comps imply.
- What's the recent tenant-quality profile in this submarket — average credit score on applications, eviction rate, late-payment / NSF rate, and stable-employment percentage? A property-management company in the area should have these aggregated.
- How much new for-sale + rental construction is in the pipeline within 1–3 miles? Heavy new supply typically softens prices + rents 12–24 months out; constrained supply supports both.
Investment metrics
- 1% rule
- 1.40% ✓
- Cap rate
- 9.17%
- Cash-on-cash
- 10.26%
- DSCR
- 1.46
- GRM
- 6.0
CMA / ARV
- ARV (median comp)
- $200,510
- List price
- $99,000
- Delta
- -50.63%
- Verdict
- UNDERPRICED
- Comps
- 20 within 1.0 mi
Show comp detail 12 sales within ~0.75 mi
| Address | Dist | Beds/Ba | Sqft | Sold | Price | $/sf | Match |
|---|---|---|---|---|---|---|---|
| 7872 Beaver Ln | 0.36mi | 3/1.0 (-1) | 1,170 (-4%) | 4mo | $212,180 | $181 | 68 |
| 7926 Rinaldo Blvd N | 0.39mi | 3/1.0 (-1) | 1,152 (-5%) | 6mo | $170,000 | $148 | 63 |
| 7899 Rinaldo Blvd W | 0.45mi | 3/1.0 (-1) | 1,152 (-5%) | 7mo | $140,000 | $122 | 60 |
| 7935 Rinaldo Blvd E | 0.50mi | 3/1.0 (-1) | 1,152 (-5%) | 5mo | $123,641 | $107 | 59 |
| 7887 Rinaldo Blvd E | 0.59mi | 3/1.0 (-1) | 1,152 (-5%) | 10mo | $145,000 | $126 | 50 |
| 7848 State Route 31 | 0.44mi | 3/1.0 (-1) | 1,157 (-5%) | 20mo | $180,000 | $156 | 50 |
| 7843 Oneida Trl | 0.37mi | 3/1.0 (-1) | 1,056 (-13%) | 8mo | $281,500 | $267 | 49 |
| 7936 John Huss Ave | 0.49mi | 3/1.0 (-1) | 1,152 (-5%) | 18mo | $120,000 | $104 | 49 |
| 7924 Rinaldo Blvd E | 0.54mi | 3/1.0 (-1) | 1,392 (+14%) | 6mo | $193,000 | $139 | 40 |
| 7842 Eisenhower Blvd | 0.66mi | 3/1.0 (-1) | 1,344 (+10%) | 8mo | $210,000 | $156 | 40 |
| 7830 Areopagitica Ave | 0.68mi | 3/1.0 (-1) | 1,306 (+7%) | 15mo | $203,000 | $155 | 39 |
| 7921 Eisenhower Blvd | 0.73mi | 3/1.0 (-1) | 1,340 (+10%) | 9mo | $207,300 | $155 | 37 |
Match score weights: distance 35% · size 25% · config 20% · recency 20%. Top-matched comps best support the ARV.
Projected returns pro-forma
-3.0% appreciation · 3.0% rent growth · sell at horizon
- IRR
- -0.8%
- Equity multiple
- 0.97×
- Total profit
- $-818
- Equity at exit
- $14,761
- IRR
- 9.0%
- Equity multiple
- 1.69×
- Total profit
- $19,241
- Equity at exit
- $8,560
Cash invested: $27,720 (down + closing). Projections, not guarantees.
Landlord ↔ Tenant lean methodology
- Overall (STATE)
- 15 Strongly Tenant-Friendly
- State New York
- 15 Strongly Tenant-Friendly · D+10
- County
- — inherits STATE
- City
- — inherits STATE
ZIP-level market 13030
- Home prices YoY
- -2.7%
- Active inventory
- 46
- Price-to-rent
- 6.0×
Monthly cashflow live
- Estimated rent
- $1,384 medium interval (Pro) →
- Mortgage (P&I)
- −$519
- Tax from tax record
- −$296 /mo · $3,547/yr
- Insurance
- −$41
- HOA
- −$0
- Vacancy / Maint / Mgmt
- −$291
- Net cashflow
- $237
Break-even live
Sensitivity live
| Price | -10% $293 | -5% $265 | +0% $237 | +5% $209 | +10% $181 |
|---|---|---|---|---|---|
| Rent | -10% $128 | -5% $182 | +0% $237 | +5% $292 | +10% $346 |
| Rate | -1.0pp $287 | -0.5pp $262 | base $237 | +0.5pp $211 | +1.0pp $185 |
UW: 25.0% down · 7.5% · 30yr · 1.5% tax · 5.0% vac · 8.0% maint · 8.0% mgmt
Financing live
Cash to close
- Down payment
- $24,750
- Closing costs
- $2,970
- Reserves months
- —
- Total cash needed
- —
Loan-product check · same deal, 3 products live
Conventional
25% down · 7.5% · 30yr
- Down + closing
- —
- Monthly P&I
- —
- Monthly cashflow
- —
- DSCR
- —
- Eligible?
- —
Personal DTI + credit; lowest rate.
DSCR
20% down · 8.5% · 30yr
- Down + closing
- —
- Monthly P&I
- —
- Monthly cashflow
- —
- DSCR
- —
- Eligible?
- —
No personal income docs; deal must DSCR.
Hard money
10% down · 12.0% · 12mo
- Down + closing
- —
- Monthly P&I
- —
- Monthly cashflow
- —
- DSCR
- —
- Eligible?
- —
Short-term bridge; refi at stabilization.
Listing history 2 events
-
2026-05-04price $99,000 468-char remark
Show marketing remark (468 chars)
home features 4-bedrooms 1 full bath with large deep lot. Home will need updates and some work. 1 car garage. Home has country feel. Would make a great rental or flip. Home has 2 lots 66 wide X 305 Deep. For total of 112 x 305. NO Survey Provided. Will need work to pass loan. Heat is off but works. Public water off but hooked up. Some broke water lines in basement. Sold As-IS to settle estate. All offers must have proof of funds and signed addendums. CNS Schools.
-
2026-04-15$109,000 Active 468-char remark
Show marketing remark (468 chars)
home features 4-bedrooms 1 full bath with large deep lot. Home will need updates and some work. 1 car garage. Home has country feel. Would make a great rental or flip. Home has 2 lots 66 wide X 305 Deep. For total of 112 x 305. NO Survey Provided. Will need work to pass loan. Heat is off but works. Public water off but hooked up. Some broke water lines in basement. Sold As-IS to settle estate. All offers must have proof of funds and signed addendums. CNS Schools.
ⓘ Source: listings_history table (triggers on properties + properties_extension) + one-shot
backfill from property_details.listing_events for pre-trigger history.
Tax reassessment forecast NY · Partial reset (capped growth)
- Current annual tax
- $3,547 · $296/mo
- Projected year-2 tax
- $3,547 · $296/mo
- Expected delta
- $0/yr ($0/mo · 0.0%)
ⓘ Screening estimate from a state-policy table — verify with the county assessor before closing.
Climate risk First Street
- Flood 1/10 Low FEMA zone X (unshaded) · 0% chance over 30 yrs
- Wildfire 2/10 Low
- Heat 3/10 Moderate 7 d/yr ≥95°F today · 16 d/yr by 30 yrs out
- Wind 1/10 Low
- Air quality 2/10 Low 1 unhealthy d/yr today · 2 by 30 yrs out
Nearby sold comps map
Loading sold comps map…
Walkable amenities ~0.75 mi
Loading nearby amenities…
Taxation est. · year 1
- Rental income
- $16,603
- − Mortgage interest
- −$5,546
- − Property taxes
- −$3,547
- − Insurance
- −$495
- − Repairs & maintenance
- −$1,328
- − Management
- −$1,328
- − Depreciation
- −$2,880
- Taxable income
- $1,479
- Est. tax owed @ 24.0%
- −$355
- After-tax cash flow
- $2,490/yr
For passive investors: Depreciation is non-cash, so a rental often shows a tax loss while cash-flowing — sheltering income. Rental losses are passive: they offset passive income freely, and up to $25,000/yr can offset ordinary (W-2) income if you actively participate and your MAGI is under $100k (phasing out to $0 by $150k); unused losses carry forward. On sale, claimed depreciation is recaptured at up to 25%, and gains may owe capital-gains tax (a 1031 exchange can defer both). Figures are a year-1 estimate at your 24.0% rate — not tax advice; consult a CPA.
Schools (NCES district)
- District
- North Syracuse Central School District
- NCES district ID
- 3621210
- Math proficiency
- 45% ▼ -9.00%
- Reading proficiency
- 50% ▲ 1.00%
- Median HH income
- $62,904
- Composite
- 41.93/100
- National rank
- #3356
- State rank
- #402 of 590 in NY
Livability — Bridgeport
- Score
- 66/100
- State rank
- #655
- US rank
- #12191
Category grades
Schools grade is shown separately in the Schools card above.
Census & demographics
- City population
- 3,611
- Population (ZIP)
- 3,611
Population outlook (Onondaga County) Hauer SSP2
- Today (2025)
- 467,894 people
- By 2030
- 463,381 · -1.0%
- By 2040
- 447,697 · -4.3%
- By 2050
- 426,399 · -8.9%
- By 2075
- 373,661 · -20.1%
- By 2100
- 307,967 · -34.2%
Race, ethnicity, and origin ACS 2023
- Neighborhood character
- Predominantly White (90%)
- Race & ethnicity
- White 90% Hispanic / Latino 5% Two or more races 5% Asian 2%
- Common ancestry
- Romanian 5% Lithuanian 3% Serbian 2%
- Foreign-born
- 4% · Canada, China
- Languages at home
- 93% English-only · Spanish 3% Other Indo-European 1% Chinese 1%
Political lean MEDSL · Onondaga
- 2024 margin
- D (+17.3) · D 58.6% · R 41.4%
- 2008→2024 swing
- -3.0pp toward R · 2008: 20.3pp · 2024: 17.3pp
- All cycles
- 2024: D+17.3 2020: D+20.6 2016: D+12.8 2012: D+21.1 2008: D+20.3
Not yet ingested
- Civics
- —
Market trends
- HPI YoY
- ▼ -8.81%
- Current HPI
- 315.162
- Rent YoY
- —
- Metro
- —
- State GDP YoY
- ▲ 2.60%
- F500 in state
- 92
Industry mix (Fortune 500 HQ in NY)
| Industry | F500 HQs | Revenue |
|---|---|---|
| Financial Services | 10 | $950B |
|
||
| Consumer Goods | 9 | $162B |
|
||
| Insurance | 4 | $225B |
|
||
| Telecommunications | 2 | $144B |
|
||
| Pharmaceuticals | 2 | $112B |
|
||
| Media / Entertainment | 2 | $69B |
|
||
Price history
-9.2% since first listed2 events — show timeline
- 2026-05-04 Price Changed $99,000 CNYIS
- 2026-04-15 Listed $109,000 CNYIS
Property tax history
+17.2%/yrLatest (2025): $3,547 · +3.1% YoY. Source: county tax records.
Cash-flow waterfall
monthlySold comps — $/sqft
last 12 mo · ≤1 miLoading sold comps…