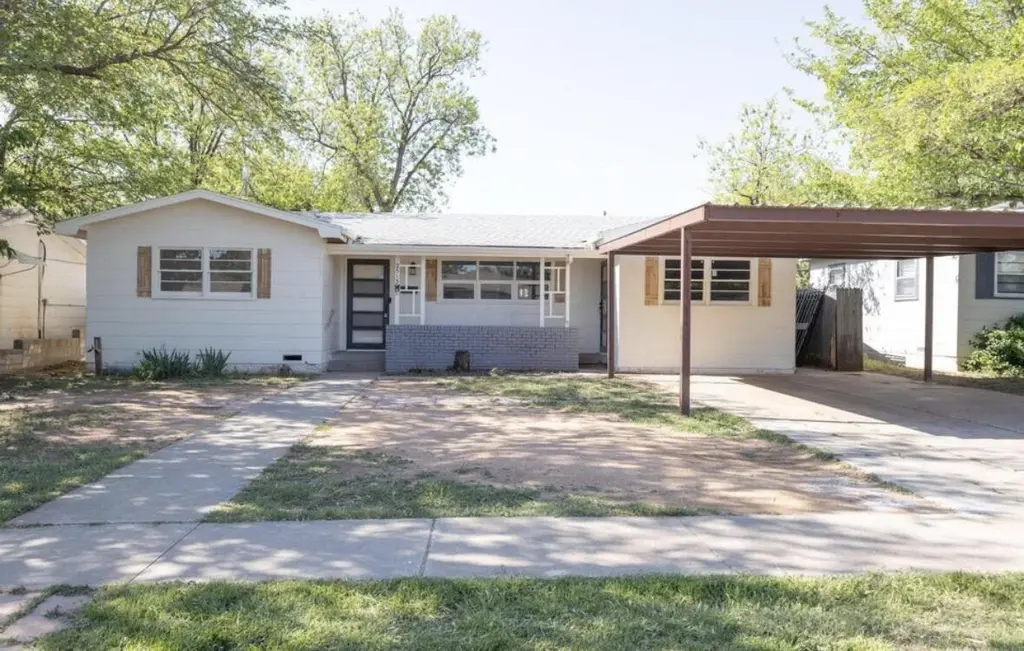
2513 44th St · Lubbock, TX
Flood risk 1/10 · Minimal
- FEMA flood zone
- X (unshaded)
- Chance of flooding over 30 yrs
- 0.0%
- Est. flood insurance / yr
- $507 – $1,088
Fire risk 1/10 · Minimal
- Est. fire insurance / yr
- $1,222 – $2,270
Heat risk 5/10 · Moderate
- Hot days now (above 99°F)
- 7 days/yr
- Hot days in 30 yrs
- 21 days/yr
Wind risk 2/10 · Minimal
- Chance of severe wind over 30 yrs
- —
Air-quality risk 2/10 · Minimal
- Unhealthy air days now
- 1 days/yr
- Unhealthy air days in 30 yrs
- 1 days/yr
Risk factors via First Street. Map © Google.
Why this score? — see what drove the D- grade
The composite is a weighted blend of 9 inputs, each scored 0–100. Each bar is that input's sub-score; the figure is the points it added to the 100-point composite (weight × sub-score).
- Cash flow +13.2/30.0
- DSCR +4.0/10.0
- Livability +4.0/5.0
- 1% rule +3.9/10.0
- ARV discount +3.8/15.0
- Schools +3.1/10.0
- Rent growth +3.0/5.0
- Condition / age +2.5/5.0
- Appreciation +0.0/10.0
$189,000
🖨 Deal sheet 📄 Offer letter ✓ Due diligence
Listing remarks MLS
RARE find!!! Updated 4 bed, 2 bath home in central Lubbock! This home has TONS of space with 3 living areas (one being a huge sun room with wood-burning stove), new paint and flooring throughout the inside as well as outside. New fixtures throughout, and new appliances as well. Outside is a large backyard with storage building! This home was recently appraised for $215K-so you are walking in with instant equity!! Also being sold as a package along with these addresses- 2804 2nd Place, 2715 39th Street
Key facts
- Large backyard
- Storage building
- Central lubbock
Tags
Neighborhood map
What this means for you Summary
Snapshot
- This is a 3-bed/2.0-bath single-family listed at $189k.
Deal economics
- At list price, monthly cash flow is $-4 ($-43/yr) — negative.
- To cash-flow at today's rent, offer at most $188k (0.3% below list).
- To meet the 1% rule (rent ≥ 1% of price), the offer needs to be $167k (11.4% below list).
- Recommended offer: $167k (11.4% below list) — sets the bar for 1% rule.
Location & tenants
- Location reads 80/100 on livability (#37 in TX, #1,749 nationally) — a professional / high-income tenant draw. Strengths: commute A+, cost of living A+, housing A+; Watch: employment C-, schools D+, crime F.
- Lubbock ISD (urban): math 36% / reading 39% proficiency, ranked #481 of 826 in TX (top 58%) — families likely to look elsewhere, expect single-tenant / working-renter base with shorter leases; 60% free/reduced lunch — lower-income household profile, screen leases tightly.
- Market conditions: Rents rising (+1.9%/yr); 183 active listings in the ZIP; 40 comparable units currently listed for rent nearby; rentals lingering (median 44d on market — plan ~5-8 weeks vacancy on turnover, expect pricing pressure); 55% of comp listings sitting > 30 days — soft ceiling on asking rent; 2,219 units permitted in Lubbock County in 2024 (252 in 5+ unit buildings).
Forward outlook
- Local home prices are declining (-3.0%/yr); year-one equity from $1k of loan paydown is wiped out by about $6k of value loss. Plan a longer hold.
- Lubbock County population projected at +39% by 2050 — long-run rental-demand tailwind backs the buy-and-hold thesis.
Negotiation context
- Only 10 days on market — expect competitive offers; lowballing is unlikely to land.
- 3 sale attempts since 2y ago with the ask held roughly flat each time — persistent listings suggest the price (not the market) is what's stuck; bring a comps-based counter.
Risks & watch-outs
- Watch-outs: built in 1954 — expect roof / HVAC / electrical / plumbing capex.
- Climate carrying-cost: extreme-heat days projected 7→21/yr by 2055 (HVAC capex compounding) — expect insurance premiums to compound above CPI over the hold.
Questions for the listing agent
- What do current leases actually rent for vs. the listed asking? Can we see a recent rent roll and the last 12 months of T-12 income?
- Built in 1954 — when were the roof, HVAC, electrical panel, plumbing, and water heater last replaced?
- Is there a deadline driving the sale (1031 exchange, divorce, estate, relocation)? That informs how much negotiation room exists.
- Schools are D-rated, which usually means shorter tenancies and higher turnover. Who's the typical renter profile here, and what's been the actual vacancy rate?
- Crime grade is F in this area — have there been break-ins, vandalism, or insurance claims at this property in the last 3 years? What carrier currently insures it and at what premium?
- The area grade is low — what's the realistic commute time and amenity access for the typical tenant pool here? Any planned neighborhood developments (good or bad) we should know about?
- What's the average days-on-market for RENTAL listings here right now (not sales)? A rising rental-DOM trend means longer vacancies and softer asking-rent achievability than the comps imply.
- What's the recent tenant-quality profile in this submarket — average credit score on applications, eviction rate, late-payment / NSF rate, and stable-employment percentage? A property-management company in the area should have these aggregated.
- How much new for-sale + rental construction is in the pipeline within 1–3 miles? Heavy new supply typically softens prices + rents 12–24 months out; constrained supply supports both.
Investment metrics
- 1% rule
- 0.89% ✗
- Cap rate
- 6.27%
- Cash-on-cash
- -0.08%
- DSCR
- 1.00
- GRM
- 9.4
CMA / ARV
- ARV (median comp)
- $174,814
- List price
- $189,000
- Delta
- 8.11%
- Verdict
- FAIR
- Comps
- 2 within 1.0 mi
Projected returns pro-forma
-3.0% appreciation · 1.94% rent growth · sell at horizon
- IRR
- -17.6%
- Equity multiple
- 0.38×
- Total profit
- $-32,586
- Equity at exit
- $28,181
- IRR
- -11.9%
- Equity multiple
- 0.33×
- Total profit
- $-35,617
- Equity at exit
- $16,341
Cash invested: $52,920 (down + closing). Projections, not guarantees.
Landlord ↔ Tenant lean methodology
- Overall (STATE)
- 87 Strongly Landlord-Friendly
- State Texas
- 87 Strongly Landlord-Friendly · R+5
- County
- — inherits STATE
- City
- — inherits STATE
ZIP-level market 79413
- Rents YoY
- 1.9%
- Active inventory
- 183
- Price-to-rent
- 9.4×
Monthly cashflow live
- Estimated rent
- $1,675 high interval (Pro) →
- Mortgage (P&I)
- −$991
- Tax from tax record
- −$257 /mo · $3,083/yr
- Insurance
- −$79
- HOA
- −$0
- Vacancy / Maint / Mgmt
- −$352
- Net cashflow
- $-4
Break-even live
UW: 25.0% down · 7.5% · 30yr · 1.5% tax · 5.0% vac · 8.0% maint · 8.0% mgmt
Financing live
Cash to close
- Down payment
- $47,250
- Closing costs
- $5,670
- Reserves months
- —
- Total cash needed
- —
Loan-product check · same deal, 3 products live
Conventional
25% down · 7.5% · 30yr
- Down + closing
- —
- Monthly P&I
- —
- Monthly cashflow
- —
- DSCR
- —
- Eligible?
- —
Personal DTI + credit; lowest rate.
DSCR
20% down · 8.5% · 30yr
- Down + closing
- —
- Monthly P&I
- —
- Monthly cashflow
- —
- DSCR
- —
- Eligible?
- —
No personal income docs; deal must DSCR.
Hard money
10% down · 12.0% · 12mo
- Down + closing
- —
- Monthly P&I
- —
- Monthly cashflow
- —
- DSCR
- —
- Eligible?
- —
Short-term bridge; refi at stabilization.
Rent comps 40 comps
| Address | Beds | Baths | Sqft | Rent | $/sqft | DOM | Units | Dist |
|---|---|---|---|---|---|---|---|---|
| 2609 41st St Lubbock, TX | 3.0 | 2.0 | 1469 | $1,550 | $1.06 | 21d | 1 | 0.21mi |
| 2403 38th St Lubbock, TX | 3.0 | 1.5 | 1786 | $1,700 | $0.95 | 44d | 1 | 0.42mi |
| 2508 37th St Lubbock, TX | 3.0 | 2.5 | 1495 | $1,700 | $1.14 | 44d | 1 | 0.47mi |
| 2801 36th St Lubbock, TX | 3.0 | 2.0 | 1446 | $2,700 | $1.87 | 44d | 1 | 0.58mi |
| 2107 48th St Lubbock, TX | 3.0 | 1.0 | 1956 | $1,200 | $0.61 | 44d | 1 | 0.60mi |
| 2215 36th St Lubbock, TX | 3.0 | 2.0 | 1578 | $1,450 | $0.92 | 44d | 1 | 0.62mi |
| 3108 39th St Lubbock, TX | 3.0 | 2.0 | 1504 | $1,295 | $0.86 | 21d | 1 | 0.68mi |
| 2601 33rd St Lubbock, TX | 3.0 | 2.0 | 1894 | $1,800 | $0.95 | 21d | 1 | 0.69mi |
| 3114 40th St Lubbock, TX | 3.0 | 2.0 | 1488 | $1,375 | $0.92 | 44d | 1 | 0.69mi |
| 2823 54th St Lubbock, TX | 3.0 | 2.0 | 1725 | $1,825 | $1.06 | 44d | 1 | 0.74mi |
| 1718 43rd St Lubbock, TX | 4.0 | 2.0 | 1870 | $1,075 | $0.57 | 21d | 1 | 0.86mi |
| 2121 56th St Lubbock, TX | 3.0 | 2.0 | 2047 | $1,999 | $0.98 | 21d | 1 | 0.86mi |
| 2430 31st St Lubbock, TX | 3.0 | 2.0 | 1592 | $1,450 | $0.91 | 44d | 1 | 0.87mi |
| 2614 31st St Lubbock, TX | 3.0 | 2.0 | 1549 | $1,650 | $1.07 | 44d | 1 | 0.87mi |
| 3019 33rd St Lubbock, TX | 3.0 | 1.5 | 1573 | $1,500 | $0.95 | 14d | 1 | 0.87mi |
| 3312 47th St Lubbock, TX | 3.0 | 2.0 | 1880 | $1,795 | $0.95 | 44d | 1 | 0.88mi |
| 2613 30th St Lubbock, TX | 3.0 | 2.0 | 1472 | $1,500 | $1.02 | 44d | 1 | 0.90mi |
| 2518 30th St Lubbock, TX | 4.0 | 2.0 | 1558 | $1,750 | $1.12 | 21d | 1 | 0.93mi |
| 1919 34th St Lubbock, TX | 2.0 | 2.0 | 1463 | $1,100 | $0.75 | 14d | 1 | 0.93mi |
| 2310 59th St Lubbock, TX | 3.0 | 2.5 | 2637 | $1,900 | $0.72 | 44d | 1 | 0.94mi |
| 2416 30th St Lubbock, TX | 3.0 | 2.0 | 1746 | $1,425 | $0.82 | 21d | 1 | 0.94mi |
| 3404 42nd St Lubbock, TX | 3.0 | 2.0 | 1475 | $1,500 | $1.02 | 44d | 1 | 0.95mi |
| 3115 32nd St Lubbock, TX | 4.0 | 2.5 | 2300 | $2,200 | $0.96 | 21d | 1 | 0.99mi |
| 3417 47th St Lubbock, TX | 3.0 | 2.0 | 1450 | $1,550 | $1.07 | 44d | 1 | 1.04mi |
| 3415 49th St Unit B Lubbock, TX | 3.0 | 2.0 | 1410 | $1,350 | $0.96 | 44d | 1 | 1.04mi |
| 3408 38th St Lubbock, TX | 3.0 | 2.0 | 1927 | $1,895 | $0.98 | 44d | 1 | 1.05mi |
| 2319 28th St Lubbock, TX | 4.0 | 2.0 | 2146 | $1,650 | $0.77 | 21d | 1 | 1.06mi |
| 2220 29th St Lubbock, TX | 3.0 | 2.0 | 2032 | $1,300 | $0.64 | 44d | 1 | 1.07mi |
| 3505 46th St Lubbock, TX | 2.0 | 2.0 | 1686 | $1,550 | $0.92 | 44d | 1 | 1.08mi |
| 2701 27th St Lubbock, TX | 3.0 | 2.0 | 1569 | $1,800 | $1.15 | 44d | 1 | 1.08mi |
| 2725 63rd St Unit FS Lubbock, TX | 3.0 | 2.0 | 1624 | $1,599 | $0.98 | 44d | 1 | 1.22mi |
| 3612 44th St Lubbock, TX | 3.0 | 2.0 | 1675 | $1,850 | $1.10 | 44d | 1 | 1.24mi |
| 2311 25th St Lubbock, TX | 4.0 | 2.0 | 1400 | $1,400 | $1.00 | 21d | 1 | 1.27mi |
| 3119 26th St Lubbock, TX | 3.0 | 3.0 | 1888 | $1,400 | $0.74 | 21d | 1 | 1.30mi |
| 3302 28th St Lubbock, TX | 3.0 | 2.5 | 1660 | $1,725 | $1.04 | 21d | 1 | 1.30mi |
| 3423 56th St Lubbock, TX | 3.0 | 2.0 | 2224 | $1,895 | $0.85 | 44d | 1 | 1.32mi |
| 2511 23rd St Lubbock, TX | 2.0 | 2.0 | 1428 | $1,500 | $1.05 | 21d | 1 | 1.33mi |
| 3708 46th St Lubbock, TX | 3.0 | 2.0 | 2378 | $1,750 | $0.74 | 14d | 1 | 1.34mi |
| 2117 65th St Lubbock, TX | 3.0 | 2.0 | 2285 | $1,975 | $0.86 | 21d | 1 | 1.35mi |
| 3712 47th St Lubbock, TX | 3.0 | 2.0 | 1767 | $1,400 | $0.79 | 21d | 1 | 1.37mi |
Listing history 26 events
-
2026-06-18days on market $189,000 Active 10 DOM
-
2026-06-17days on market $189,000 Active 9 DOM
-
2026-06-16days on market $189,000 Active 8 DOM
-
2026-06-15days on market $189,000 Active 7 DOM
-
2026-06-14days on market $189,000 Active 5 DOM
-
2026-06-13days on market $189,000 Active 4 DOM
-
2026-06-10days on market $189,000 Active 2 DOM
-
2026-06-09days on market $189,000 Active 1 DOM
-
2026-06-08days on market $189,000 Active 133 DOM
-
2026-06-07days on market $189,000 Active 132 DOM
-
2026-06-05days on market $189,000 Active 129 DOM
-
2026-06-03days on market $189,000 Active 128 DOM
-
2026-06-02days on market $189,000 Active 127 DOM
-
2026-06-01days on market $189,000 Active 126 DOM
-
2026-05-31days on market $189,000 Active 125 DOM
-
2026-05-30days on market $189,000 Active 124 DOM
-
2026-01-13$189,000 Active 509-char remark
Show marketing remark (509 chars)
RARE find!!! Updated 4 bed, 2 bath home in central Lubbock! This home has TONS of space with 3 living areas (one being a huge sun room with wood-burning stove), new paint and flooring throughout the inside as well as outside. New fixtures throughout, and new appliances as well. Outside is a large backyard with storage building! This home was recently appraised for $215K-so you are walking in with instant equity!! Also being sold as a package along with these addresses- 2804 2nd Place, 2715 39th Street
-
2024-09-11price $185,000
-
2024-09-11historical $1,650
-
2024-09-06$1,650
-
2024-08-30historical $1,750
-
2024-07-02$1,750
-
2024-06-13price $189,900
-
2024-05-24price $194,900
-
2019-11-14soldstatus
-
2019-11-14soldstatus
ⓘ Source: listings_history table (triggers on properties + properties_extension) + one-shot
backfill from property_details.listing_events for pre-trigger history.
Tax reassessment forecast TX · Resets to sale price
- Current annual tax
- $3,083 · $257/mo
- Projected year-2 tax
- $3,459 · $288/mo
- Expected delta
- +$376/yr (+$31/mo · 12.2%)
ⓘ Screening estimate from a state-policy table — verify with the county assessor before closing.
Climate risk First Street
- Flood 1/10 Low FEMA zone X (unshaded) · 0% chance over 30 yrs
- Wildfire 1/10 Low
- Heat 5/10 Major 7 d/yr ≥99°F today · 21 d/yr by 30 yrs out
- Wind 2/10 Low
- Air quality 2/10 Low 1 unhealthy d/yr today · 1 by 30 yrs out
Nearby sold comps map
Loading sold comps map…
Walkable amenities ~0.75 mi
Loading nearby amenities…
Taxation est. · year 1
- Rental income
- $20,099
- − Mortgage interest
- −$10,587
- − Property taxes
- −$3,083
- − Insurance
- −$945
- − Repairs & maintenance
- −$1,608
- − Management
- −$1,608
- − Depreciation
- −$5,498
- Taxable loss
- −$3,230
- Est. tax savings @ 24.0%
- +$775
- After-tax cash flow
- $732/yr
For passive investors: Depreciation is non-cash, so a rental often shows a tax loss while cash-flowing — sheltering income. Rental losses are passive: they offset passive income freely, and up to $25,000/yr can offset ordinary (W-2) income if you actively participate and your MAGI is under $100k (phasing out to $0 by $150k); unused losses carry forward. On sale, claimed depreciation is recaptured at up to 25%, and gains may owe capital-gains tax (a 1031 exchange can defer both). Figures are a year-1 estimate at your 24.0% rate — not tax advice; consult a CPA.
Schools (NCES district)
- District
- Lubbock ISD
- NCES district ID
- 4828500
- Math proficiency
- 36% ▼ -8.00%
- Reading proficiency
- 39% ▼ -1.00%
- Median HH income
- $39,820
- Composite
- 31.44/100
- National rank
- #5984
- State rank
- #481 of 826 in TX
Livability — Lubbock
- Score
- 80/100
- State rank
- #37
- US rank
- #1749
Category grades
Schools grade is shown separately in the Schools card above.
Census & demographics
- Census place
- Lubbock, TX
- County
- Lubbock County · 293,542 people
- City population
- 283,030
- Metro
- Lubbock, TX
- Population (ZIP)
- 23,343
- Household income
- $69,400
- Rent vs Own
- Severe rent burden
- 1211.0
Population outlook (Lubbock County) Hauer SSP2
- Today (2025)
- 345,960 people
- By 2030
- 371,449 · +7.4%
- By 2040
- 424,539 · +22.7%
- By 2050
- 481,150 · +39.1%
- By 2075
- 633,467 · +83.1%
- By 2100
- 746,853 · +115.9%
Race, ethnicity, and origin ACS 2023
- Neighborhood character
- Diverse neighborhood (Simpson 0.59)
- Race & ethnicity
- White 54% Hispanic / Latino 34% Two or more races 18% Black 6%
- Hispanic origin (detail)
- Mexican 25%
- Common ancestry
- Slovak 2% Italian 2% Serbian 1%
- Foreign-born
- 3% · Canada, China
- Languages at home
- 88% English-only · Spanish 10% Chinese 1%
Political lean MEDSL · Lubbock
- 2024 margin
- Solid R (+39.5) · D 29.7% · R 69.2% · Other 1.0%
- 2008→2024 swing
- -2.8pp toward R · 2008: -36.7pp · 2024: -39.5pp
- All cycles
- 2024: R+39.5 2020: R+32.2 2016: R+38.4 2012: R+40.9 2008: R+36.7
Not yet ingested
- Civics
- —
Market trends
- HPI YoY
- ▼ -145.52%
- Current HPI
- 239.8854
- Rent YoY
- ▲ 1.94%
- Metro
- Lubbock, TX
- State GDP YoY
- ▲ 3.95%
- F500 in state
- 110
Industry mix (Fortune 500 HQ in TX)
| Industry | F500 HQs | Revenue |
|---|---|---|
| Energy | 16 | $1,198B |
|
||
| Technology | 5 | $198B |
|
||
| Engineering / Construction | 4 | $72B |
|
||
| Energy Services | 3 | $60B |
|
||
| Utilities | 3 | $41B |
|
||
| Healthcare | 2 | $330B |
|
||
Price history
-3.0% since first listed10 events — show timeline
- 2026-01-13 Listed $189,000 LARMLS
- 2024-09-11 Price Changed $185,000 LARMLS
- 2024-09-11 Rental Removed $1,650 LARMLS
- 2024-09-06 Listed for Rent $1,650 LARMLS
- 2024-08-30 Rental Removed $1,750 LARMLS
- 2024-07-02 Listed for Rent $1,750 LARMLS
- 2024-06-13 Price Changed $189,900 LARMLS
- 2024-05-24 Price Changed $194,900 LARMLS
- 2019-11-14 Sold (Public Records) — Public Records
- 2019-11-14 Sold (Public Records) — Public Records
Property tax history
+4.0%/yrLatest (2025): $3,083 · +2.6% YoY. Source: county tax records.
Cash-flow waterfall
monthlySold comps — $/sqft
last 12 mo · ≤1 miLoading sold comps…